We’re making it easier to track your projects’ financial health and spot any impending risks with the redesigned Easy Projects Project Financial Module.
We’ve mainly improved four areas:
- We’ve standardized the terminology, formulas, and key metrics to better align with project management industry standards, while still being familiar and intuitive to Easy Projects users.
- We’ve added visuals in the form of bar graphs to communicate your financial health at-a-glance.
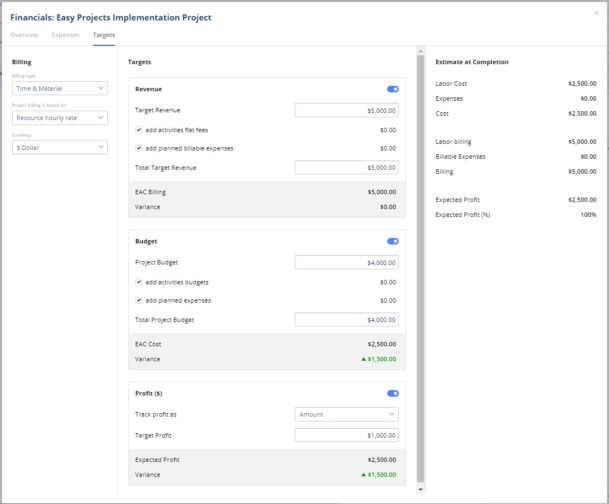
- Most substantially, we’ve added the concept of financial Targets. The Targets tab is where you can set and monitor Revenue, Budget, and Profit targets for the project, more on this later.
- And finally, we’ve split the layout into three tabs to be able to present all of this new functionality in a way that makes sense.
All of the above improvements complement each other and work cohesively to vastly improve the Financial Module’s user experience.
Let’s dig into some of the juicy details.
Targets
The brand new Targets tab is where you can configure your project billing settings and establish the financial targets for your project.
In the Targets tab, you can choose between seven different billing types like Time & Materials, Flat Fee, Rate Card, and more. Once you establish your billing type you can set your targets for Revenue, Budget, and Profit where appropriate. Easy Projects then calculates your expected (or EAC: Estimated at Completion) revenue, cost, and profit. Even more impressive, it also calculates how your EAC values compare to your targets and highlights any variances.
Overview
Next, we’ll switch over to the Overview tab which has been designed to provide all of the relevant project financial data in an intuitive and easy to understand format – think of it as your financial command center.
Front and center is a new bar graph that compares Actual versus Estimated for Billing, Labor Cost, and Expenses, all at-a-glance. Additionally, you’ll find a new summary section of your progress versus your targets, again with conditional highlighting depending on your results – green is good and red is bad.
Expenses
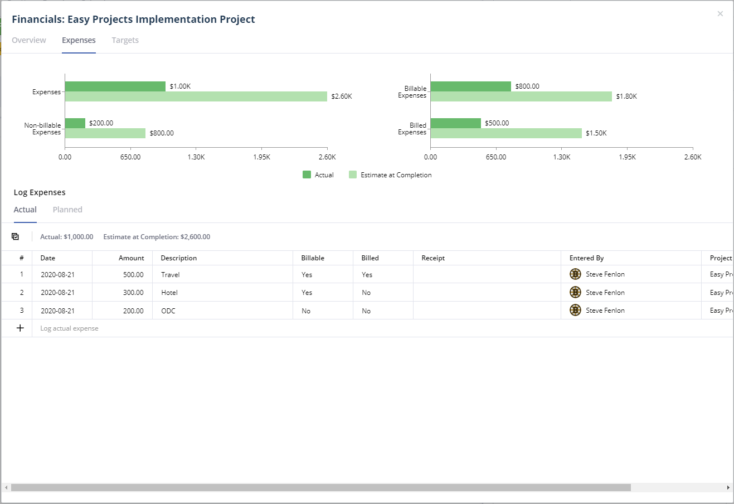
Lastly, we’ve also moved Expenses to their own tab to accommodate four new graphs that display how your actuals compare to your estimates for total expenses, billable, non-billable, and billed.
And if that wasn’t enough we’ve also added the ability to upload expense receipts directly into Easy Projects!
With the redesigned Financial Module, you can spot any risks long before they impact the project’s financial health.
To learn more about the new Project Financial module you can click the below help articles:
Project Financials Overview Tab
Project Financials Expenses Tab
Project Financials Targets Tab


