Ksenia Kartamysheva
 - Track KPIs that drive decisions, not just reporting. The most valuable metrics help leaders take action before delivery, profitability, or capacity become problems.
- No single KPI tells the whole story. Financial, resource, project, operational, and executive metrics should be reviewed together to understand what’s driving business performance.
- Organize KPIs into role-based dashboards. Executives, finance teams, PMOs, and resource managers need different views of the same underlying data to make faster, more informed decisions.
- Focus on forward-looking indicators. Metrics such as forecast utilization, capacity forecasts, and revenue forecasts help identify risks and opportunities before they impact delivery or profitability.
- A unified reporting framework creates better outcomes. When finance, operations, and project teams work from shared KPI definitions and connected dashboards, organizations spend less time validating reports and more time improving business performance.
Ask ten operations leaders which KPI matters most and you’ll probably hear ten different answers. Some will say utilization. Others will point to project profitability, revenue forecasts, or project health. The reality is that no single KPI tells you whether a professional services business is performing well.
The organizations that consistently improve delivery and profitability don’t track more KPIs. They track the right KPIs and use them together to make better decisions.
Professional services KPIs measure how effectively your organization delivers projects, utilizes people, manages financial performance, and plans future capacity. Together, they help leaders answer critical business questions, from whether the team can take on more work to why project margins are changing.
Many firms already have dashboards full of metrics but still struggle to understand what’s happening across the business. Resource plans live in spreadsheets, financial data sits in accounting software, and project information is spread across multiple systems. As a result, teams spend more time validating reports than acting on them, making it difficult to identify delivery risks, forecast capacity, or improve profitability. These reporting challenges are common among growing professional services organizations.
This guide explains which KPIs actually matter, how they work together, and how operations leaders can organize them into a reporting framework that supports better decisions across the business.
Why KPIs matter in professional services
Professional services businesses depend on one resource above all else: their people. Revenue is generated by matching the right skills to the right projects at the right time while delivering work profitably.
That makes reporting fundamentally different from industries that manage inventory or production. A drop in utilization, an overloaded team, or delayed time approvals can quickly affect project delivery, cash flow, and profitability. Looking at a single metric rarely explains the whole picture.
Effective professional services reporting connects operational, financial, and delivery metrics so leaders can identify trends early, understand what’s causing them, and take action before clients or margins are affected.
Which KPIs actually matter?
Not every metric deserves executive attention.
The most useful KPIs share four characteristics:
- They support a decision, not just describe activity.
- They are measured consistently across departments.
- They highlight change that requires action.
- They work with other KPIs to explain business performance.
For example, project profitability becomes much more valuable when reviewed alongside utilization, realization, and budget variance. Together, these metrics help explain why margins are improving or declining instead of simply reporting the outcome.
In this guide, we’ve grouped the 30 most important KPIs into five categories:
- Resource management to optimize capacity and staffing.
- Project delivery to monitor execution.
- Financial performance to protect profitability and cash flow.
- Operations to improve internal efficiency.
- Executive reporting to support strategic planning.
Organizing KPIs this way shifts reporting from a collection of disconnected metrics to a decision-making framework. Instead of asking, Which report should I review?, leaders can focus on the more important question: What decision am I trying to make?
How mature professional services firms organize KPIs
Tracking 30 KPIs doesn’t make an organization data-driven. In fact, one of the most common reporting mistakes is expecting executives to monitor every available metric.
High-performing professional services firms organize KPIs into layers, with each leadership role seeing only the metrics needed to make decisions. Instead of one large dashboard, they build a reporting framework where executive, financial, operational, and project dashboards work together.

At the top, executives focus on a small group of strategic KPIs that answer questions such as:
- Are we on track to hit our revenue targets?
- Do we have enough capacity to support future growth?
- Which parts of the portfolio require executive attention?
These dashboards typically include metrics such as revenue forecast, portfolio health, capacity forecast, and gross margin.
Finance leaders need a different perspective. Their dashboards focus on profitability, realization, billing performance, and cash flow. Resource managers monitor utilization, availability, workload balance, and future demand, while project managers work with delivery-focused KPIs such as schedule variance, milestone completion, and project health.
This layered approach keeps every team focused on the decisions they own while ensuring everyone works from the same underlying data. Instead of maintaining separate spreadsheets for finance, operations, and project management, organizations create a connected reporting framework where every dashboard contributes to a single view of business performance.
Key takeaway: Mature organizations don’t ask executives to review 30 KPIs. They organize those KPIs into role-based dashboards so every leader sees the right information at the right level of detail.
Resource management KPIs: Can we deliver the work we’ve sold?
The first question every operations leader should answer isn’t “How busy is the team?” It’s “Can we deliver the work we’ve already committed to, and do we have capacity for what’s coming next?”
Many organizations answer this question with a single utilization report. Unfortunately, utilization alone rarely tells the full story. A team can be operating at 85% utilization while still missing deadlines because critical specialists are overloaded. Another team may appear underutilized simply because future project demand hasn’t yet been reflected in the resource plan.
This is why mature professional services organizations don’t rely on one resource metric. They combine several KPIs to understand current capacity, future demand, staffing efficiency, and planning accuracy. Together, these metrics help answer one of the most important business questions: Can we confidently deliver future work without compromising profitability or employee wellbeing?
The six resource management KPIs
| KPI | Why it matters |
| Billable utilization | Shows how effectively billable staff generate revenue while maintaining sustainable workloads. |
| Capacity utilization | Reveals how much available capacity has already been committed, helping teams avoid over-allocation. |
| Resource availability | Identifies future capacity so operations and sales can confidently accept new work. |
| Bench utilization | Ensures non-billable time is invested in activities that improve future delivery instead of becoming idle capacity. |
| Forecast utilization | Predicts future workload based on confirmed projects and expected demand, supporting hiring and staffing decisions. |
| Allocation accuracy | Measures how closely actual work matches the original resource plan, improving future forecasting and budgeting. |
These KPIs become significantly more valuable when reviewed together rather than individually. For example, high utilization paired with low resource availability may indicate that hiring is required, while declining allocation accuracy often explains why resource forecasts become unreliable over time.
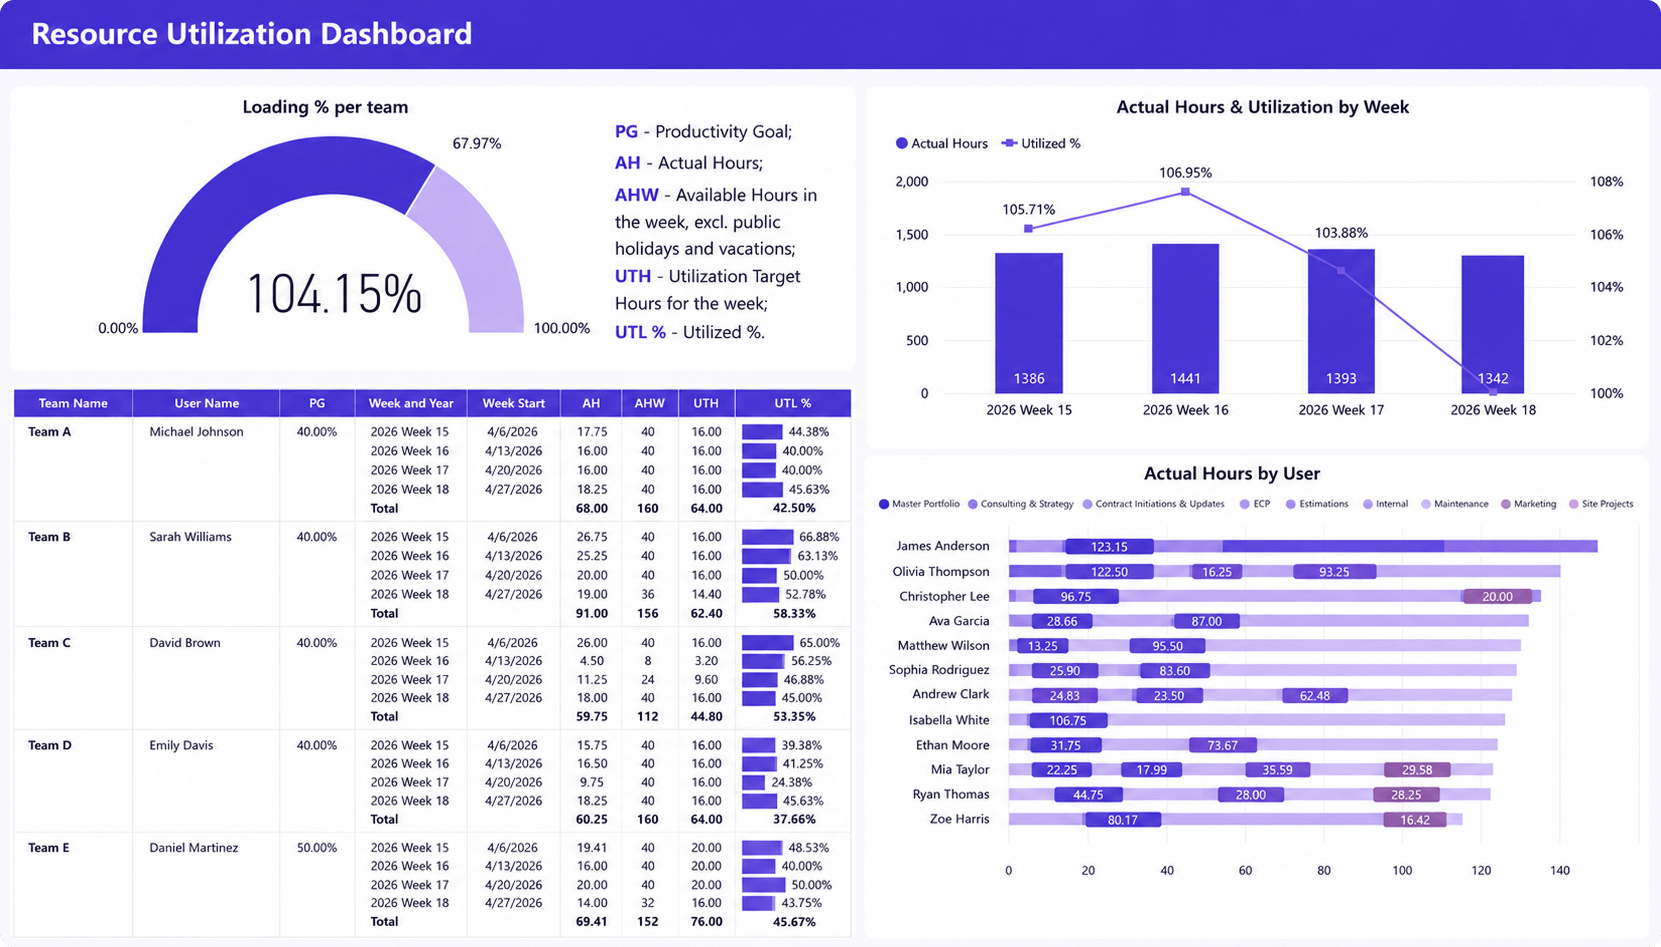
Birdview’s Resource Utilization Dashboard brings together team utilization, weekly utilization trends, actual hours, and resource loading in a single view. This helps operations leaders quickly identify overloaded teams, underutilized capacity, and utilization trends without manually combining data from multiple reports.
Project delivery KPIs: Are our projects staying healthy?
Winning new business is only half the challenge. Consistently delivering projects on time, within budget, and at the expected level of quality is what drives client satisfaction, repeat business, and long-term profitability.
The difficulty is that projects rarely fail because of a single issue. Budget overruns, missed deadlines, and client escalations are usually the result of several small problems that develop over time. A project may start slipping because resources are reassigned, requirements continue to change, or milestones are missed without triggering immediate action.
That’s why experienced operations leaders don’t wait until a project is marked “late.” They monitor a small set of delivery KPIs that reveal early warning signs across the entire portfolio. Instead of reacting to problems after they affect the client, they can identify projects that need attention while there is still time to recover.
The six project delivery KPIs
| KPI | Why it matters |
| On-time delivery | Measures how consistently projects meet planned completion dates, indicating the reliability of your delivery process. |
| Schedule variance | Shows whether projects are progressing faster or slower than planned, helping identify delays before deadlines are missed. |
| Budget variance | Compares planned and actual project costs, highlighting projects where delivery is becoming less profitable than expected. |
| Milestone completion | Tracks progress against key deliverables, providing a clearer picture of project health than task completion alone. |
| Project health score | Combines schedule, budget, workload, and risk indicators into a single metric that helps prioritize management attention. |
| Change request frequency | Identifies projects experiencing frequent scope changes, which often lead to schedule delays, budget overruns, and reduced margins. |
These KPIs should never be reviewed independently. A project that is slightly behind schedule may not require immediate action if the budget remains healthy and future milestones are still achievable. However, when schedule variance, budget variance, and change request frequency all begin trending in the wrong direction, they often indicate a project that requires management intervention.
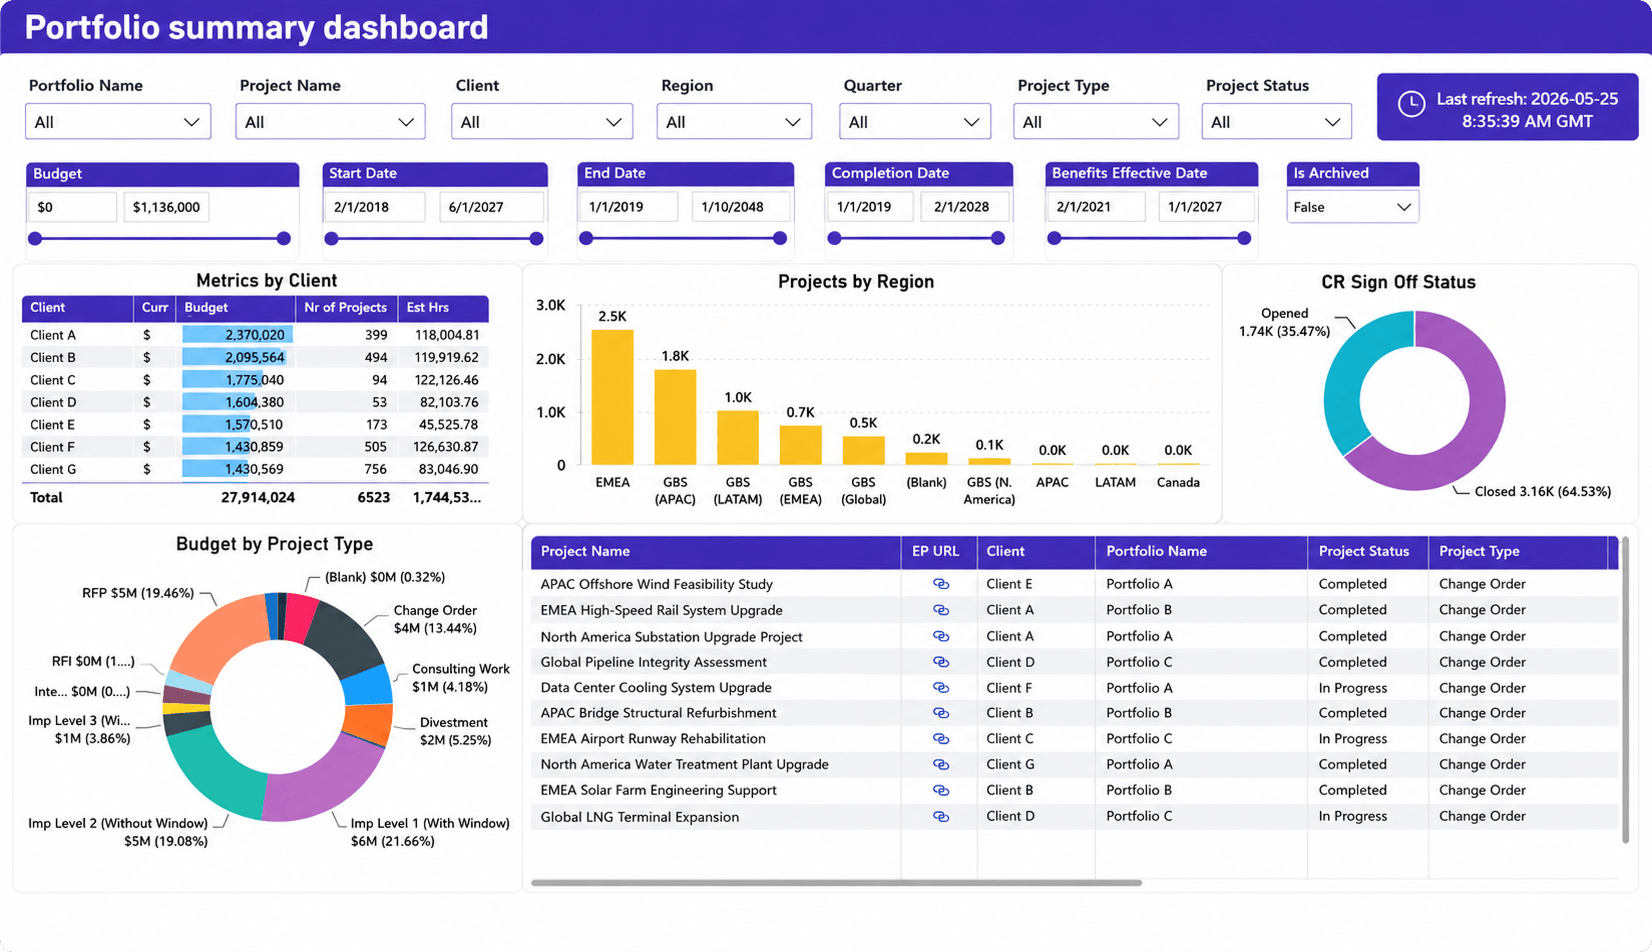
Birdview’s Project Portfolio Dashboard gives operations and PMO leaders a portfolio-wide view of project budgets, client distribution, regional performance, project status, and change order activity. Instead of reviewing individual projects one by one, they can quickly identify trends, monitor portfolio performance, and focus attention on the areas that require further investigation.
Financial KPIs: Are we turning delivery into profitable growth?
One of the most common challenges in professional services is confusing revenue with financial performance. New projects are coming in, consultants are fully booked, and invoices are being sent, yet margins continue to shrink. In most cases, the problem isn’t a lack of work. It’s that small operational issues, such as poor estimates, delayed approvals, scope creep, or low realization, quietly erode profitability throughout project delivery.
That’s why financial KPIs shouldn’t be viewed as month-end accounting reports. They should be monitored alongside delivery and resource metrics to understand whether the business is converting work into sustainable profit.
The six financial KPIs
| KPI | Why it matters |
| Project profitability | Measures whether individual projects generate healthy margins after labour and delivery costs are considered. |
| Gross margin | Tracks overall profitability across the business, helping leadership identify broader trends that affect financial performance. |
| Realization rate | Shows how much billable work is ultimately invoiced, highlighting revenue lost through write-offs, discounts, or inefficient delivery. |
| Revenue per consultant | Indicates whether growth in headcount is translating into growth in revenue, helping evaluate the productivity of the business. |
| Unbilled revenue | Identifies completed work that hasn’t yet been invoiced, exposing delays that negatively impact cash flow. |
| Billing cycle time | Measures how quickly completed work becomes an invoice, helping reduce revenue delays and improve working capital. |
These KPIs tell a much stronger story when they’re reviewed together. For example, declining project profitability may initially appear to be a pricing problem. However, when it’s accompanied by lower realization rates, increasing budget variance, and rising unbilled revenue, the underlying issue is often operational rather than commercial. Without viewing these metrics as part of the same reporting framework, it’s easy to solve the wrong problem.
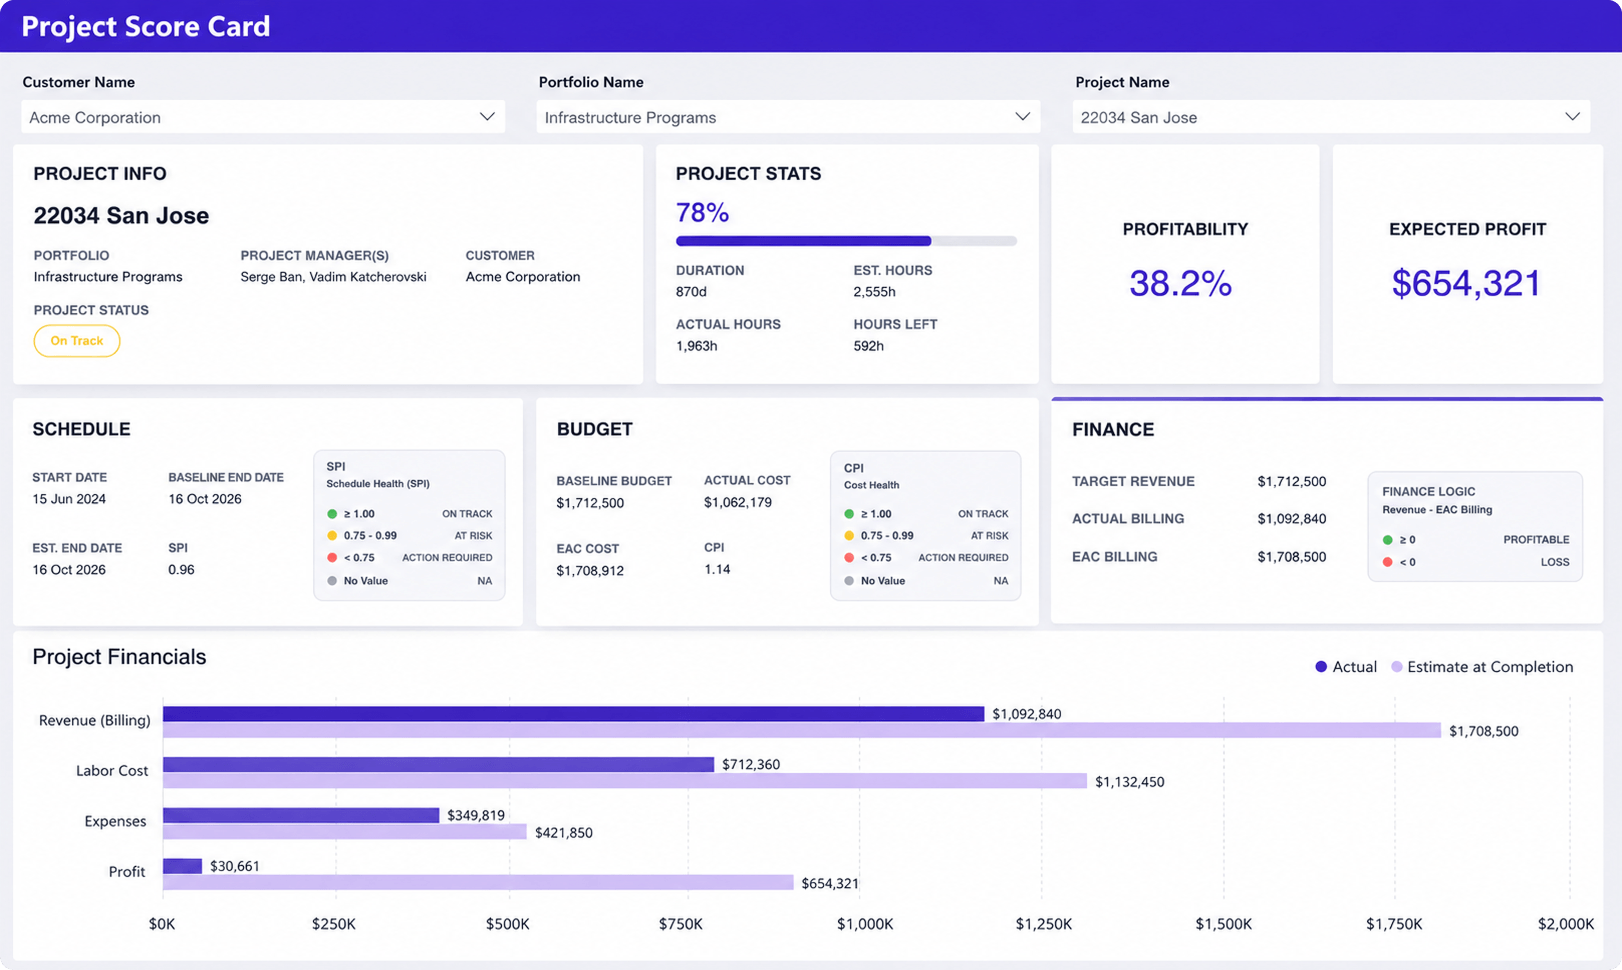
Birdview’s Project Score Card brings together project profitability, budget performance, schedule health, billing progress, expected profit, and overall project financials in a single view. By monitoring these KPIs throughout the project lifecycle, finance and operations leaders can identify declining margins, budget risks, and delivery issues before they impact project profitability.
Operations KPIs: Are our processes helping us scale?
As professional services firms grow, operational complexity increases faster than headcount. More projects, more clients, and more people create additional coordination, approvals, and reporting requirements. Without the right operational metrics, small inefficiencies gradually become bottlenecks that affect delivery, profitability, and employee productivity.
Unlike financial KPIs, which measure business outcomes, operations KPIs focus on how efficiently work moves through the organization. They help leaders identify process issues before they begin affecting project performance or client satisfaction.
The six operations KPIs
| KPI | Why it matters |
| Active projects | Provides context for overall delivery capacity and helps determine whether project growth remains sustainable. |
| Workload balance | Measures how evenly work is distributed across teams, reducing burnout while improving delivery consistency. |
| Approval cycle time | Identifies delays in approving timesheets, expenses, or project changes that can slow reporting and invoicing. |
| Resource conflicts | Highlights overlapping assignments and overbooked employees before they impact project delivery. |
| Forecast accuracy | Measures how closely operational forecasts match actual results, improving hiring, budgeting, and resource planning over time. |
| Service delivery performance | Combines operational indicators such as delivery quality, project health, and client outcomes into a single measure of execution. |
These KPIs work together because operational problems rarely exist in isolation. For example, declining forecast accuracy may initially appear to be a planning issue. However, when it coincides with increasing resource conflicts, uneven workloads, and longer approval cycles, it often points to a broader breakdown in operational processes rather than a single scheduling problem.
Which KPIs each leadership role should monitor
Not every stakeholder needs the same dashboard. The most effective reporting frameworks present each leadership role with the metrics it can influence directly.
| Role | Priority KPIs |
| Operations Leader | Billable utilization, capacity utilization, forecast accuracy, workload balance, service delivery performance |
| Finance Director / CFO | Project profitability, gross margin, realization rate, unbilled revenue, billing cycle time |
| PMO Director | Project health, schedule variance, milestone completion, portfolio health |
| Resource Manager | Resource availability, allocation accuracy, forecast utilization, resource conflicts, bench utilization |
| Executive Team | Revenue forecast, capacity forecast, portfolio health, client profitability, delivery risk |
Role-based dashboards reduce reporting noise and keep leadership focused on the decisions they are responsible for making, rather than requiring everyone to interpret the same collection of reports.
Executive KPIs
Resource, delivery, financial, and operational KPIs help teams manage individual areas of the business. Executive KPIs bring those perspectives together to answer a broader question: Is the organization positioned for sustainable growth?
Executives don’t need dozens of detailed reports. They need a concise view of business performance that highlights risks, opportunities, and trends across the entire portfolio.
Portfolio health
Portfolio health provides an overall view of active projects by combining indicators such as project health, schedule performance, budget status, and resource capacity.
Instead of reviewing projects individually, leadership can quickly identify which parts of the portfolio require attention and where additional support or reprioritization is needed.
Revenue forecast
Unlike historical revenue reports, a revenue forecast estimates future performance based on confirmed projects, work in progress, planned billing milestones, and expected sales.
When reviewed alongside capacity forecasts, this KPI helps determine whether growth targets are realistic or whether additional hiring or business development is required.
Client profitability
Not every client contributes equally to long-term success.
Client profitability evaluates revenue against delivery costs across all projects for a customer. It helps identify strategic accounts that deserve further investment, as well as relationships where pricing, scope, or delivery models should be reviewed.
Delivery risk
Delivery risk highlights projects that are most likely to experience delays, budget overruns, or resource issues.
Rather than waiting for project status meetings, executives can use this KPI to focus on high-risk initiatives while there is still time to intervene.
Capacity forecast
Capacity forecast compares expected demand with available resources over the coming months.
This KPI supports strategic hiring, contractor planning, and sales decisions. It also reduces one of the biggest risks facing growing professional services firms: committing to work without the people needed to deliver it successfully.
Strategic initiative progress
Client work often dominates executive attention, making internal improvement initiatives easy to postpone.
Tracking strategic initiative progress ensures investments in process improvement, technology, and organizational development remain visible alongside day-to-day project delivery.
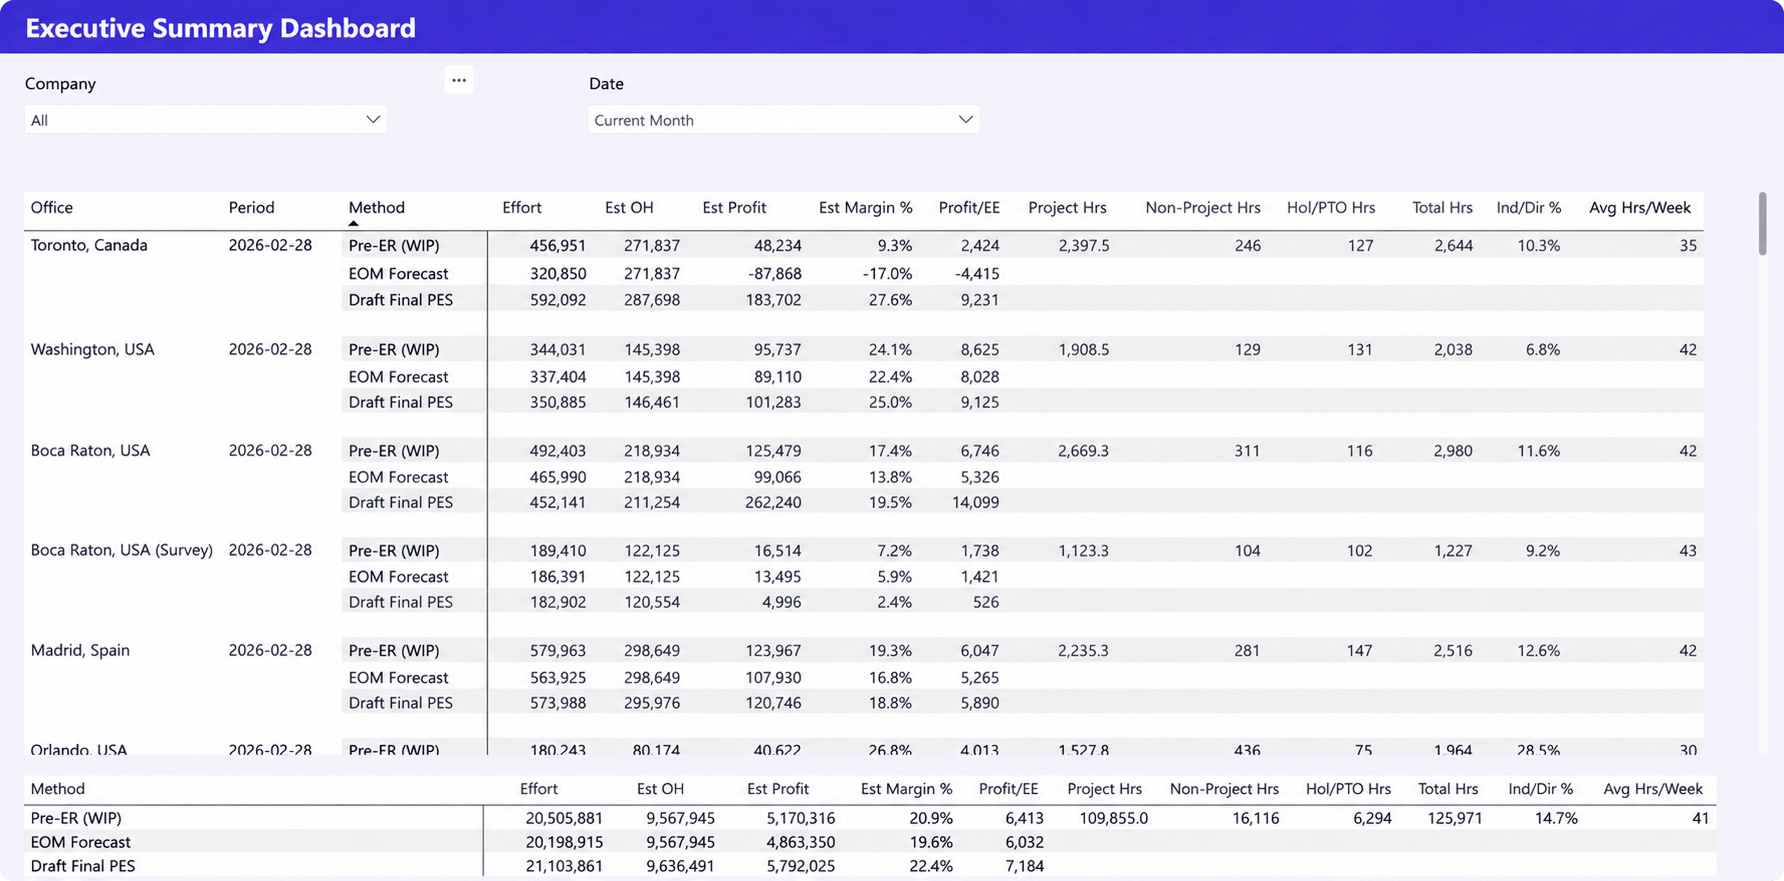
Birdview’s Executive Summary Dashboard consolidates revenue forecasts, estimated profit, project hours, margins, and workforce utilization into a single leadership view. This enables executives to compare performance across business units, monitor forecast accuracy, and make informed decisions about profitability, capacity, and future growth.
Common KPI mistakes professional services firms make
Even mature organizations can struggle with reporting if they measure the wrong things or present them in the wrong way.
The most common mistake is tracking too many KPIs. Dashboards filled with dozens of charts rarely improve decision-making. Instead, they make it harder to identify the few metrics that actually require action.
Another mistake is measuring activity instead of outcomes. Logged hours, completed tasks, and meeting counts may describe work, but they don’t explain whether projects are profitable or clients are receiving value.
Many organizations also rely too heavily on historical reporting. Looking only at last month’s results doesn’t help leaders anticipate resource shortages or delivery risks. Forward-looking KPIs, such as forecast utilization and capacity forecasts, are equally important.
Finally, reporting often breaks down because finance and operations use different data sources. When every department maintains its own spreadsheets and KPI definitions, meetings become discussions about which numbers are correct rather than what actions should be taken. Establishing shared definitions and a single reporting framework is often more valuable than adding another dashboard.
Turning KPIs into dashboards
Individual KPIs provide valuable insight, but they become far more powerful when grouped into dashboards that support specific business decisions.
A Resource Utilization Dashboard helps operations leaders monitor team utilization, resource loading, and workforce performance to make informed staffing decisions. A Project Portfolio Dashboard provides a portfolio-wide view of budgets, project status, client distribution, and change order activity, making it easier to identify trends and prioritize management attention. Finance teams benefit from a Project Score Card, which combines project profitability, budget performance, billing progress, expected profit, and overall project financials to identify risks before they affect margins. At the executive level, an Executive Summary Dashboard consolidates revenue forecasts, estimated profit, project hours, margins, and utilization into a single view that supports strategic planning and business performance reviews.
Birdview PSA is one example of how professional services organizations can consolidate project, financial, resource, and operational data into role-based dashboards. Instead of manually combining reports from multiple systems, leaders can access the KPIs most relevant to their responsibilities and quickly move from high-level insights to the underlying project details.
The objective isn’t to create more reports. It’s to ensure every leader has the right information to make faster, more confident decisions.
Download the professional services KPI framework
Choosing the right KPIs is only the first step. The real challenge is organizing them into dashboards that help every leadership role make better decisions.
Our Professional Services KPI Framework & Dashboard Planner helps you build a practical reporting framework by including:
- 30 essential KPIs grouped by business function
- KPI definitions and calculation formulas
- Recommended owners and reporting frequency
- A dashboard planning worksheet for executive, finance, resource, and project reporting
- A KPI prioritization matrix to identify which metrics belong on each dashboard
- A reporting maturity checklist to evaluate your current reporting process
- Dashboard wireframes to help design role-based executive reporting
Whether you’re building your first KPI framework or redesigning executive reporting, the planner provides a practical roadmap for aligning finance, operations, project delivery, and resource management around the same business goals.
FAQ
What are professional services KPIs?
Professional services KPIs are measurable indicators that track the performance of resource management, project delivery, financial health, and business operations. Together, they help leaders make better staffing, forecasting, and profitability decisions.
Which KPI is the most important?
There isn’t a single most important KPI. The most effective reporting frameworks combine resource, delivery, financial, operational, and executive metrics because each provides a different view of business performance.
How many KPIs should executives monitor?
Most executive dashboards work best with 10 to 15 carefully selected KPIs. The goal is to support faster decisions, not to display every available metric.
How often should KPI dashboards be reviewed?
Operational dashboards are typically reviewed daily or weekly, while executive and financial dashboards are often reviewed weekly or monthly. Forecasting metrics should be updated whenever project schedules, staffing, or demand changes significantly.
What’s the difference between operational and financial KPIs?
Operational KPIs measure how efficiently work is delivered, such as utilization, workload balance, and project health. Financial KPIs measure business outcomes, including profitability, revenue, realization, and billing performance. Both are needed to understand why the business is performing the way it is.
Final thoughts
Professional services firms don’t become more data-driven by tracking more KPIs. They improve by connecting the right KPIs to the decisions leaders make every day. When finance, operations, resource management, and project delivery all work from the same reporting framework, KPIs stop being monthly reports and become a foundation for predictable growth, profitable delivery, and better business decisions.