This article will explore the diverse types of project dashboards available, each tailored to meet different strategic, operational, and analytical needs. We will also share our practical guide on effectively designing and implementing these project dashboards, ensuring they are informative and adaptable to the project‘s evolving requirements.
Whether you’re a project manager, an executive, or a team member, understanding how to leverage project dashboards can dramatically enhance your project’s organization and outcome.
Project dashboards are essential tools in modern project management. They provide teams and stakeholders with a visual and real-time overview of a project’s vital signs. These dashboards are a central hub for data-driven insights, blending key performance indicators (KPIs) and metrics into intuitive displays that guide decision-making processes.
What is a project dashboard?
A project management dashboard is a visual representation tool that provides an at-a-glance overview of a project’s key performance indicators (KPIs), metrics, and data points. These dashboards are crucial for project managers, stakeholders, and team members as they help to quickly assess the health and progress of a project. A well-designed project dashboard not only enhances transparency but also facilitates quicker decision-making by highlighting critical issues, trends, and insights.
What are the benefits of project dashboards?
Project dashboards are powerful tools that enhance project management by providing clear visibility into project metrics and progress. Here are some key benefits of using project dashboards in any organizational setup:
- Enhanced transparency
Project management dashboards provide an at-a-glance view of all key project metrics, making it easy for team members and stakeholders to stay informed about the project’s status. This transparency helps in building trust and accountability, as everyone can see the same data in real time.
- Improved communication
With a centralized platform displaying critical project information, communication barriers are reduced. Team members can quickly identify who is working on what, which tasks are pending, and if there are any bottlenecks affecting progress. This streamlined communication ensures that everyone is on the same page, reducing the likelihood of misunderstandings or information silos.
- Data-driven decision making
Dashboards provide a wealth of data that can guide decision-making. By analyzing real-time data, managers can make informed decisions quickly, adjust project scopes, reallocate resources, and reshape strategies to better meet project goals. This agility is critical in today’s fast-paced work environments.
- Time savings
Project dashboards automate the process of collecting and reporting data. This saves project managers and team members significant amounts of time, as they no longer need to manually compile reports from various sources. The time saved can be redirected towards more strategic tasks and project improvements.
- Risk management
By continuously monitoring project health and performance metrics, dashboards help identify potential risks and issues before they escalate into major problems. Early detection of risks allows for proactive interventions, helping to keep the project on track and within budget.
- Performance benchmarking
Dashboards allow teams to measure their performance against predefined KPIs and benchmarks. This comparison can motivate teams to maintain high-performance standards and strive for continuous improvement in their processes and outputs.
- Historical data analysis
Over time, project dashboards accumulate historical data that can be invaluable for future projects. This data can help project managers predict trends, plan resources more effectively, and estimate project timelines and budgets with greater accuracy.
- Simplified reporting
For managers and team leaders, generating progress reports becomes much simpler with a dashboard. With just a few clicks, they can create comprehensive reports that are visually appealing and easy to understand, making it easier to communicate project status to executives or clients.
What are the types of project dashboards?
Project management dashboards come in various forms, each designed to address specific aspects of project management and stakeholder needs. Understanding the different types of dashboards can help organizations choose the most appropriate one for their projects. Here‘s a detailed look at some common types:
Strategic dashboards
For whom: Senior managers and executives
Main goal: To oversee the strategic direction of multiple projects or an entire portfolio.
A strategic admin dashboards aggregates data from various projects to provide a high-level view of performance against strategic goals. It typically includes metrics related to overall health, progress toward strategic objectives, and resource allocation across projects. The focus is on long-term trends and patterns rather than granular details, enabling decision-makers to assess alignment with business strategies and make necessary adjustments.
Operational dashboards
For whom: Project managers and team leads
Main goal: To provide real-time data on the operational aspects of a project, such as task progress, team performance, and deadline compliance.
Operational dashboards help in monitoring the immediate health of a project, facilitating quick responses to issues as they arise. They often feature detailed lists, timelines, and status updates of individual tasks, making them practical tools for maintaining project schedules and productivity.
Analytical dashboards
For whom: Project analysts, data scientists, Quality assurance managers
Main goal: These project dashboards are built to handle large volumes of data and provide sophisticated analytical tools, such as predictive analytics, trend analyses, and drill-down capabilities.
With analytical dashboards, users can explore data at a granular level to uncover underlying trends, identify root causes of issues, and predict future project performance. Analytical dashboards are particularly useful in large projects where data-driven decision-making is crucial for success.
These dashboards monitor and report on specific project components, such as resource utilization, cost management, and performance benchmarks. Tactical dashboards provide a more focused view than strategic dashboards but are less detailed than operational dashboards, making them ideal for managing specific project phases or cross-departmental initiatives.
How to create a project dashboard: 5-step guide
Creating an effective project dashboard doesn’t have to be overwhelming. Think of it as crafting a custom tool that helps you and your team stay on top of everything important. Each step of the creation process, from identifying the audience to iterating based on feedback, plays a crucial role in developing a dashboard. Here‘s how you can create a dashboard that not only looks great but also becomes a central part of your project‘s success.
1. Identify the audience
First off, let’s figure out who needs to see what. The information your dashboard displays will depend on who‘s looking at it. Are you a project manager needing detailed updates, or an executive who just wants the big picture? Maybe you‘re a team member who needs to keep track of daily tasks. Understanding these needs will help you design a dashboard that‘s both useful and relevant to everyone involved.
For example, project managers require a comprehensive view that includes detailed operational data to manage the project effectively. They need to see everything from upcoming deadlines to resource allocation and potential bottlenecks. On the other hand, team members benefit most from seeing task-specific information that helps them manage their daily work and deadlines efficiently. Executives, however, may only need a high-level overview that focuses on the project’s return on investment, how well resources are being utilized, and whether the project aligns with broader strategic goals.
2. Select relevant KPIs
Next, think about what metrics are crucial for tracking your project’s success. Choose KPIs that mirror what‘s important for your project. If budget‘s a big deal, include financial metrics. If timely delivery is essential, focus on milestones and schedules. Make sure these KPIs are not only relevant but also clearly defined, easily understood, and quantifiable. By aligning KPIs with the project‘s objectives, you create a dashboard that can serve as a reliable tool in steering the project toward its goals.
3. Choose a tool
Now for the fun part–choosing the software that lets you bring your dashboard to life. The ideal tool should integrate smoothly with the existing systems used by the organization to ensure data coherence and ease of access. Moreover, it should offer robust customization options that allow the dashboard to be tailored to the specific needs of the project and its stakeholders. Another crucial factor is the tool’s usability; it should be intuitive enough for everyone on your team regardless of their tech-savviness. You will also need to pick a tool that can grow with your needs and make data look good.
4. Design for clarity
Your dashboard should make complex data easy to understand at a glance. Organize the information logically–put the most critical data front and center. Use clean lines, consistent fonts, and a color scheme that‘s easy on the eyes. Simplicity is key; a cluttered dashboard can be confusing. Good use of charts, graphs, and indicators will make the information accessible to everyone.
5. Iterate and improve
Lastly, remember that a good dashboard evolves. It‘s not about setting it and forgetting it. As your project progresses, update the dashboard to reflect new information and feedback from your team. Regular tweaks will keep it relevant and useful. Encourage feedback from users to get valuable insights into how the dashboard is used and its utility, and use this information to make your dashboard better. This ongoing process helps ensure your dashboard continues to serve its purpose effectively throughout the life of the project.
8 common dashboard design mistakes
Creating an effective dashboard can streamline project management and decision-making processes. But it’s easy to run into pitfalls that can undermine its effectiveness. Here are some common mistakes to avoid when designing a dashboard.
Overloading with data
One of the most frequent errors is cramming too much information onto a single dashboard. When dashboards are overloaded with data, important insights can get lost in the noise, making it difficult for users to quickly find the information they need. The key is to balance detail with clarity. Stick to displaying only the most relevant KPIs and metrics that provide genuine insights into project performance.
Lack of clear objectives
A dashboard without a clear purpose will confuse rather than clarify. Each dashboard should be designed with specific goals in mind, catering to the needs of its intended audience. Before you start building your dashboard, clearly define what you want it to achieve. Are you tracking progress, highlighting risks, or measuring efficiency? This focus will guide which data elements are most important and how they should be presented.
Ignoring the audience
Different stakeholders have different needs, and a common mistake is not tailoring the dashboard to the audience that will be using it most frequently. A dashboard meant for executives should not be bogged down with the granular details that might be relevant to a project manager. Understanding your audience ensures that the dashboard is useful and accessible to those who rely on it.
Failing to update data
A dashboard is only as good as its data. If the dashboard isn‘t updated regularly with current data, it loses its effectiveness and can lead to misinformed decisions based on outdated information. Ensure that there are processes in place for regular data refreshes and consider automation tools that keep data current without manual intervention.
Poor visualization choices
Choosing the wrong type of visualization can lead to misunderstanding or misinterpretation of the data. Not every data type needs a complex graph–sometimes, a simple chart is more effective. Additionally, using too many colors or overly complicated graphical elements can distract from the data itself. When selecting visualizations, consider what will most clearly and effectively communicate the key points.
Not testing usability
After creating a dashboard, it‘s crucial to test it with actual users to see if it’s understandable and meets their needs. Without usability testing, you might miss issues that are not obvious during the design phase. Feedback from users can provide critical insights into how the dashboard functions in real-world scenarios and highlight areas for improvement.
Neglecting mobile accessibility
It‘s no news that people value their time and flexibility. In today‘s mobile-first world, it‘s a mistake to design dashboards that only work on desktop computers. Many users need access to data on the go, so it‘s important to ensure that your dashboard is responsive and functions well on mobile devices.
Project dashboard examples
Now, let’s explore some specific examples of project management dashboards for each type of dashboard mentioned above. Each example is designed to meet distinct needs, such as tracking project status, financial progress, or resource utilization. By understanding these examples, project managers and stakeholders can better grasp how to customize and utilize dashboards to monitor critical aspects of their projects efficiently and effectively.
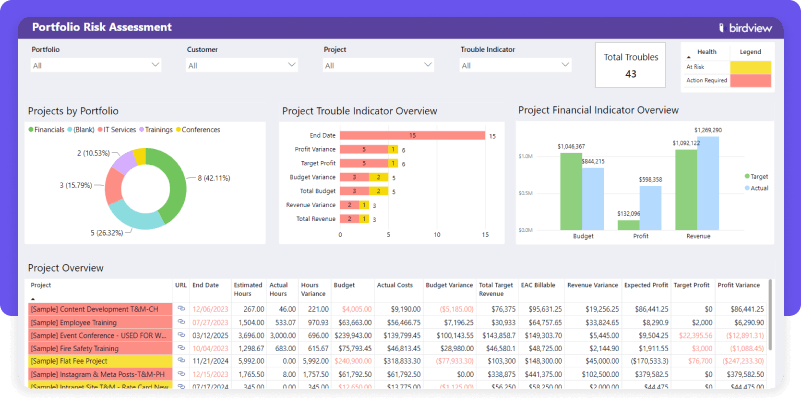
Portfolio management dashboard
Category: Strategic dashboard
This dashboard helps executives and senior project managers to get the big picture of all tasks across portfolios. It provides a quick snapshot of each project‘s condition, using indicators like status, milestones, risk levels, and progress.

How it can be used
Portfolio management dashboards can be used for various purposes:
- Strategic decision-making
With a comprehensive view of your entire project portfolio, you can make smarter decisions about where to focus your attention and resources.
- Risk management
Spotting risks early across all projects allows you to take proactive steps to mitigate them, keeping your projects on track.
- Tracking performance
Regularly checking on the health and budget status of your projects lets you catch any issues before they become bigger problems, ensuring projects stay on course.
- Project prioritization
This dashboard helps you evaluate the performance and strategic value of each project, aiding in decisions about which projects to push forward, scale back, or end, based on their contribution to your goals.
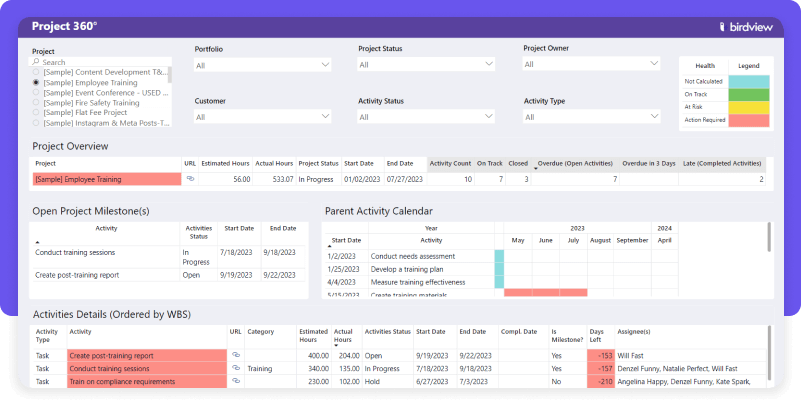
Project status dashboard
Category: Operational dashboard
Project status dashboard displays the overall status of the project, including milestones achieved, current phase, upcoming deadlines, project financials and overall project health. It serves as a quick summary to keep all stakeholders informed.

How it can be used
Project status dashboards can be used for various purposes:
- Monitoring and reporting
Project managers and stakeholders use the dashboard to monitor ongoing project activities and report on its status to higher management or clients. This regular monitoring helps in ensuring that the project stays on track and any deviations are addressed promptly.
- Decision-making
Theprojectr status dashboard provides critical data points that are essential for making informed decisions. For example, if the task completion rate is lagging, additional resources might be allocated to ensure the project meets its deadlines.
- Performance analysis
By continuously observing project metrics, the dashboard can help identify trends, which can be analyzed to improve future project performance. For instance, understanding how well the budget was adhered to or how effectively resources were utilized provides valuable insights for future budgeting and resource planning.
- Risk mitigation
Early identification of risks through the project status dashboard allows project managers to mitigate potential impacts before they become significant issues. This proactive approach is crucial in managing complex projects where multiple variables can affect outcomes.
Financial progress dashboard
Category: Analytical dashboard
This type of dashboard is designed to track and compare financial performance over time across various projects within an organization. It highlights areas where the project may be over or under budget and is crucial for financial planning and monitoring.

How it can be used
Financial progress dashboards can be used for various purposes:
- Budget management
By comparing the Actual spend against the budget, financial managers can track if a project is staying within financial limits or if it’s at risk of overspending. This is crucial for maintaining financial control and ensuring that projects do not exceed financial resources.
- Forecasting
Comparing the Forecast against Actual outcomes allows financial analysts to evaluate the accuracy of their predictive models and adjust forecasts accordingly. This is vital for refining financial predictions and improving the reliability of financial planning.
- Strategic decision-making
Executives and decision-makers can use this dashboard to overview financial health across projects or departments, identify trends, and make informed strategic decisions about resource allocation, potential scaling up, or cutting back on project investments.
- Performance review
This project dashboard serves as a tool for periodically reviewing financial performance. It helps in identifying trends such as cost escalation, revenue growth, or stagnation and is useful in performance discussions or in adjustments to financial strategy.
Resource utilization dashboard
Category: Tactical dashboard
This project dashboard focuses on how resources are allocated and used throughout different projects. It helps manage workloads, identify bottlenecks, and optimize the use of human resources, materials, and equipment.

How it can be used
Resource utilization dashboards can be used for various purposes:
- Resource allocation
Managers can use this dashboard to adjust resource allocation to projects by comparing planned and actual utilization rates. This helps in reallocating resources from underutilized areas to those where there is a shortfall, optimizing overall resource use.
- Forecasting and planning
By understanding trends in resource utilization, management can make informed decisions about future resource needs and project planning. This is particularly useful for anticipating periods of high or low activity and preparing accordingly.
- Performance analysis
Analyzing the realization rate and the gap between planned and actual billable hours can provide deep insights into operational efficiency. It can highlight areas where projects are not meeting financial efficiency goals due to resource management issues.
- Strategic decision-making
For senior management, this dashboard provides critical data that supports strategic decisions regarding workforce management, budgeting, and financial forecasting.
10 top dashboard reporting tools examples
Choosing the right dashboard reporting tool is crucial for enhancing project management capabilities across any organization. Whether you manage a small team or a large enterprise, the appropriate tool can significantly improve your ability to monitor progress, allocate resources efficiently, and make informed decisions. Let’s take a look at some of the dashboard reporting tools tailored to meet the diverse needs of small, midsize, and enterprise organizations.
Dashboard reporting tools for small and midsize teams
Birdview
Ideal for small to midsize businesses, Birdview offers a balanced set of features that support project planning, execution, reporting, and collaboration. Its user-friendly interface and comprehensive project visualization tools help teams stay organized and improve productivity.
Birdview offers interactive real-time reports and dashboards powered by Business Intelligence that can be customized to display critical data across projects, resources, and finances. With Birdview’s reporting capabilities, managers and executives get full visibility into project status, can view and manage the workload of each team member “at a glance”, and even get valuable insights into labor costs and project expenses.
Other features: Project planning and tracking, Portfolio management, Resource planning and workload, Cost and budget management, Time management, Collaboration tools, Customizable workflows
Trial: A free 14-day trial is available, with the possibility of extending the trial period to 28 days. Sign up for a trial today to learn more about Birdview.
Trello
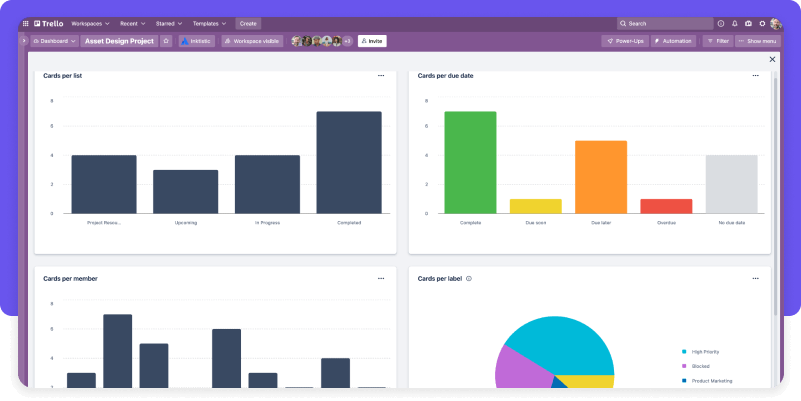
Trello is favored for its user-friendly, card-based interface that makes project management visually intuitive. Small teams can easily organize tasks into boards, lists, and cards to track progress and updates. Its simple drag-and-drop features make it ideal for managing smaller projects or as a personal productivity tool.
While primarily known for task management, Trello also offers basic reporting features through its dashboard add-ons like “Dashboard by Screenful.” These add-ons provide visual project summaries, allowing teams to track progress across boards with metrics like task completion rates and time spent.
Other features: Power-Ups, Automation, Templates, Views
Trial: A free 14-day trial is available.
Zoho Projects

This tool offers a comprehensive suite of project management features including time tracking, task management, and detailed reporting capabilities. Zoho Projects is particularly useful for midsize organizations due to its ability to integrate with other Zoho services and many third-party tools, enhancing its functionality and adaptability.
As for the project management dashboards, the tool offers customizable reports that cover overall project health. It also features a dashboard where you can visualize data with charts and widgets.
Other features: Task Automation, Issue Tracking Module, Gantt Charts, Integration Capabilities, Resource Utilization Charts
Trial: A free 10-day trial is available.
Smartsheet
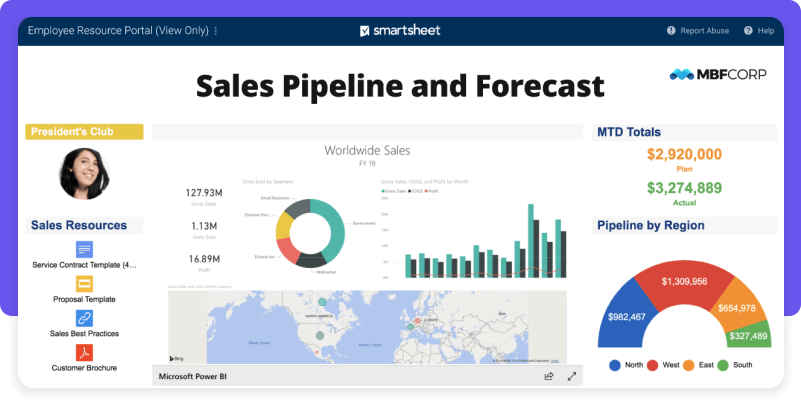
Combining the familiarity of a spreadsheet with powerful collaboration and automation features, Smartsheet allows teams to plan, capture, manage, and report on work from anywhere, helping your team be more effective. Its flexibility and ease of use make it a strong candidate for businesses that need a robust, scalable project management solution.
Smartsheet offers advanced reporting features that enable users to consolidate data from multiple sheets into detailed reports. You can create real-time metrics and executive dashboards to visualize aspects of project performance.
Other features: Automated workflows, Content collaboration, Integrations with leading apps like Microsoft and Google workspace, Secure sharing capabilities
Trial: A free 30-day trial is available.
Asana
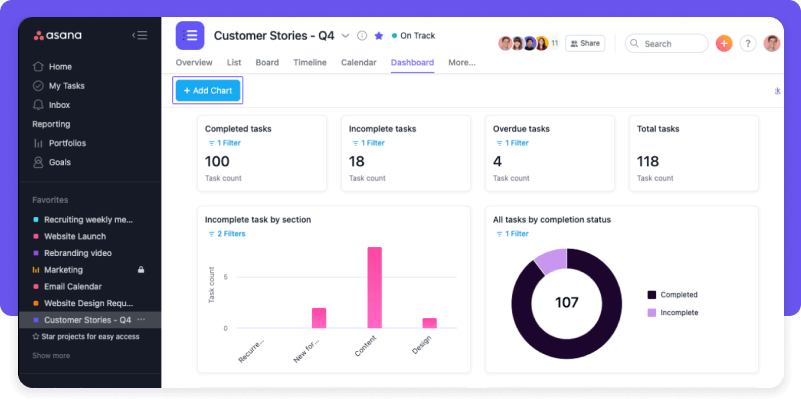
Known for enhancing team collaboration and workflow management, Asana helps teams stay focused on the goals, projects, and daily tasks that grow business. It includes features such as task assignments and timelines, and its reporting tools enable managers to monitor projects and ongoing work at a glance.
Asana provides project reporting through customizable dashboards that can track specific key performance indicators like task completion times, project milestones, and team productivity.
Other features: Custom Fields, Timelines, Portfolios, Automation, Workload visualization
Trial: A free 30-day trial is available.
Dashboard reporting tools for enterprises
Birdview Enterprise
Within its two products, Birdview Project Management and Birdview Professional Services, Birdview provides an Enterprise license, purpose-built for larger organizations seeking expanded capabilities and support. Designed for enterprise-scale needs, Birdview Enterprise solution provides comprehensive tools for managing extensive project portfolios. It supports advanced project planning, resource allocation, risk management, and integration capabilities with other enterprise systems, offering a holistic view of corporate objectives and project metrics.
Birdview stands out for its enterprise-grade reporting functionality, offering detailed insights into project health, performance metrics, and compliance tracking. Its dashboards are highly customizable, allowing large organizations to monitor multiple project portfolios and aggregate data for executive reporting.
Other features: Resource planning and scheduling, Portfolio analytics, Cross-project dependencies, Activity expenses, AI project completion forecast, Enhanced security
Trial: A free 14-day trial is available, with the possibility of extending the trial period to 28 days. Sign up for a trial today to learn more about Birdview.
SAP Project and Portfolio Management
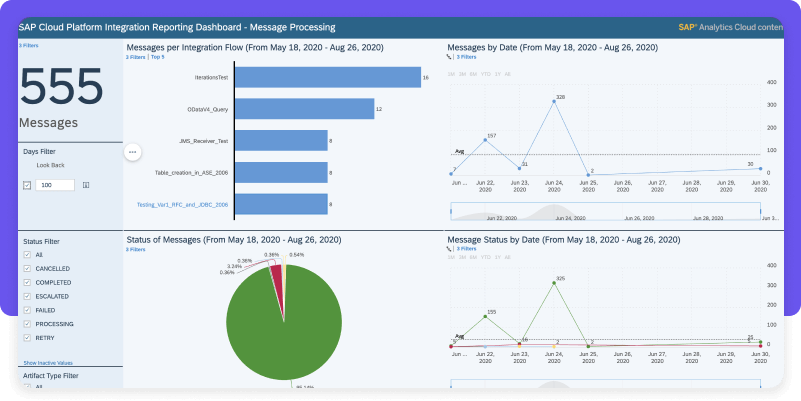
SAP PPM provides comprehensive tools that help enterprises manage complex project portfolios with efficiency and precision. It offers robust functionalities for planning, executing, and monitoring project progress, integrating seamlessly with other SAP solutions to ensure a unified approach to enterprise resource planning.
The reporting capabilities of SAP PPM are extensive, allowing for detailed insights into project metrics, financials, and resource allocation, all within a scalable framework suitable for large organizations.
Other features: Scenario Planning, Commercial Project Management, Portfolio Monitoring, Collaboration Tools
Trial: No free trial is offered.
Oracle NetSuite

Oracle NetSuite offers extensive customization options and powerful automation capabilities for managing a wide range of business activities, including project management, financials, CRM, and more. Its ability to scale and handle complex operations makes it a top choice for enterprises.
Oracle NetSuite provides powerful reporting capabilities with real-time dashboards that can be personalized for different user roles. Its reporting tools allow for deep analysis of financial data, project performance, and operational metrics, supporting detailed scrutiny and strategic planning at the enterprise level.
Other features: Real-Time Metrics, Project Accounting, Comprehensive Project Management, CRM Integration, Scalable Cloud Architecture
Trial: A free 14-day trial is available.
Workfront

Workfront offers enterprise-level workflow and project management solutions that help connect strategy to delivery. Its features support complex processes, collaboration, and reporting, all within a framework that integrates seamlessly with other enterprise tools, including Adobe Creative Cloud.
Workfront offers comprehensive reporting capabilities, including customizable dashboards and advanced analytics that help enterprises track and measure productivity, project status, and resource allocation. Its integration with Adobe Analytics further enhances data visualization and decision-making processes.
Other features: Project Tracking, Resource Management, Automated Reporting, Integration with Adobe Creative Cloud
Trial: No free trial is offered.
Tableau
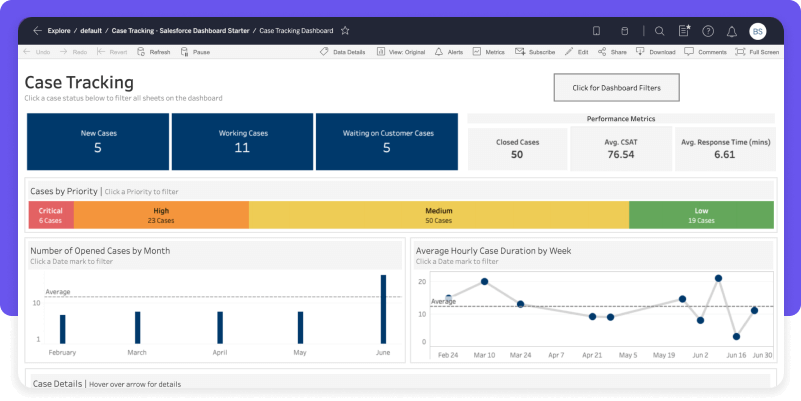
While primarily a data visualization tool, Tableau can be integrated with various data sources to create powerful, interactive dashboards for project management. It excels in transforming raw data into easily understandable visual formats, making it invaluable for data-driven decision making in large organizations.
Tableau specializes in making data accessible through advanced visualization tools. It allows users to create dynamic, interactive reports and dashboards from virtually any type of data source. This capability is particularly valuable for enterprises needing to integrate and visualize large datasets across various aspects of project management.
Other features: Advanced Data Visualization, Interactive Dashboards, Real-Time Data Processing, Collaboration Features, Mobile Support
Trial: A free 14-day trial is available.