For professional services organizations, project profitability is the ultimate measure of success. Yet, many firms still rely on outdated spreadsheets and monthly financial reports to understand where they stand. This reactive approach means you only discover a project is unprofitable after the damage is done–when budget overruns have already eroded your margins. The consequences are all too common: shrinking profits, inaccurate forecasting, and an inability to make timely, data-driven decisions.
The solution is to move from hindsight to insight. By leveraging a Professional Services Automation (PSA) platform, you can connect your project operations with your finances to calculate project profitability in real time. Instead of waiting weeks for a financial snapshot, you gain an up-to-the-minute view of every project’s health, allowing you to protect your margins proactively.
This guide provides a step-by-step framework for calculating and monitoring project profitability in real time. We‘ll cover the essential formulas, key performance indicators (KPIs), and forecasting methods that empower you to take control of your financial outcomes.
What is real-time project profitability and why is it critical?
Real-time project profitability is the ability to see the current revenue, costs, and profit margin of a project at any given moment. It is achieved by using a unified system, like a Professional Services Automation (PSA) software, that captures operational data–such as time logs and expenses–and instantly translates it into financial metrics.
For service-based firms, this capability is a game-changer. You‘ve likely experienced the frustration of discovering a project went over budget long after you could have intervened. Traditional, lagging indicators from accounting software only show historical performance. Real-time visibility turns financial data into a proactive management tool, enabling you to:
- Make proactive decisions: Spot budget variances and scope creep the moment they occur, not weeks later.
- Course-correct failing projects: Identify which projects are underperforming and take immediate action to steer them back to profitability.
- Improve forecasting accuracy: Use live data to generate more reliable revenue and profit forecasts for current and future projects.
- Protect profit margins: Ensure that every billable hour and expense is accounted for, preventing revenue leakage and safeguarding your bottom line.
Ultimately, tracking profitability in real time replaces guesswork with certainty, giving you the confidence to scale your operations without sacrificing financial health.
📚 Read more: How PSA software improves project profitability
The core formulas for calculating project profitability
To calculate project profitability in real time, you must first understand its core components: revenue, costs, and profit. A PSA platform automates these calculations, but knowing the underlying formulas is essential for interpreting the data and making informed decisions.
Calculating project revenue
Project revenue is the total income generated from a client project. How you calculate it depends on your billing model. A PSA system simplifies this by automatically calculating recognized revenue based on tracked work.
- Time and Materials (T&M): Revenue is calculated by multiplying the number of hours logged by the billable rate for each resource.
- Revenue = Billable Hours x Billable Rate
- Fixed Fee: Revenue is a predetermined amount for the entire project or specific phases. Revenue is typically recognized based on project completion percentage or at set milestones.
- Milestone Billing: Revenue is recognized as specific, predefined project milestones are completed and approved.
📚 Read more: Project revenue and project-based billing methods
Calculating project costs
Project costs are the total expenses incurred to deliver a project. The largest component for service firms is almost always labor.
- Labor Costs: This is the cost of the employees working on the project. It‘s critical to use a fully burdened cost rate, which includes not just salary but also benefits, payroll taxes, and overhead.
- Total Labor Cost = Hours Worked x Burdened Cost Rate
- Expenses: This includes all other direct costs, such as software licenses, travel, and materials. An integrated system allows team members to log these expenses directly against a project.
- Total Project Cost:
- Total Costs = Total Labor Cost + Total Expenses
Calculating project profit and margin
With revenue and costs calculated, determining your profit and profit margin is straightforward. These are the ultimate indicators of a project’s financial success.
- Project Profit: The absolute monetary gain from a project.
- Profit = Total Revenue – Total Costs
- Project Profit Margin: The percentage of revenue that is profit. This is a critical KPI for comparing the relative profitability of different projects.
- Profit Margin (%) = (Profit / Total Revenue) * 100
A robust PSA platform centralizes this data, giving you a live view of these calculations without needing manual spreadsheet work.
Key financial metrics to track for real-time profitability
While profit margin is the ultimate goal, several other metrics provide a more complete picture of a project’s financial health. Tracking these KPIs within a PSA platform helps you identify the root causes of unprofitability and take targeted action.
Gross profit margin
Gross profit margin is your most important indicator of financial performance. It shows how efficiently you are delivering services. A low or declining margin is a clear signal that project costs are too high, your pricing is too low, or you are experiencing scope creep. A PSA dashboard should always feature this metric prominently.
Billable utilization rate
The billable utilization rate measures the percentage of a resource‘s available time that is spent on billable client work. Because labor is your primary cost driver, optimizing utilization is one of the most effective ways to boost profitability. Low utilization means you are paying for resources that are not generating revenue.
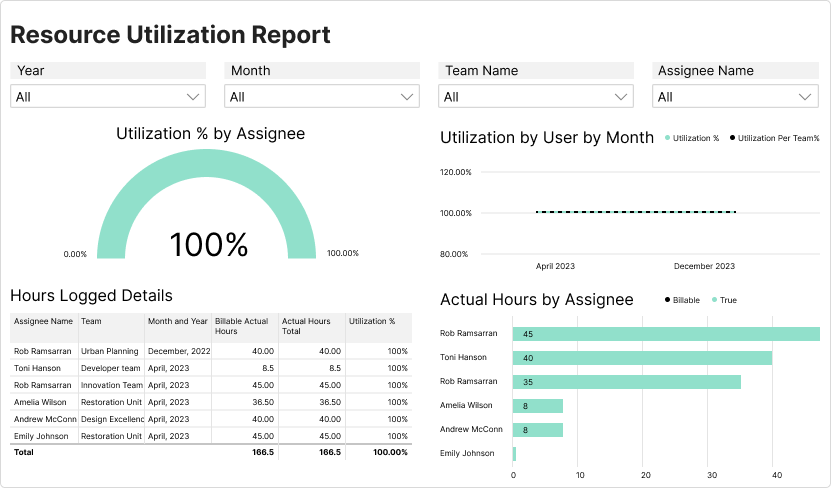
📍 Example: Birdview PSA helps you monitor utilization rates in real time, allowing you to see who is over- or under-utilized and rebalance workloads to maximize billable hours across your portfolio. This visibility is central to effective resource management and budgeting.
📚 Read more: How tracking billable and non-billable hours can increase your profits
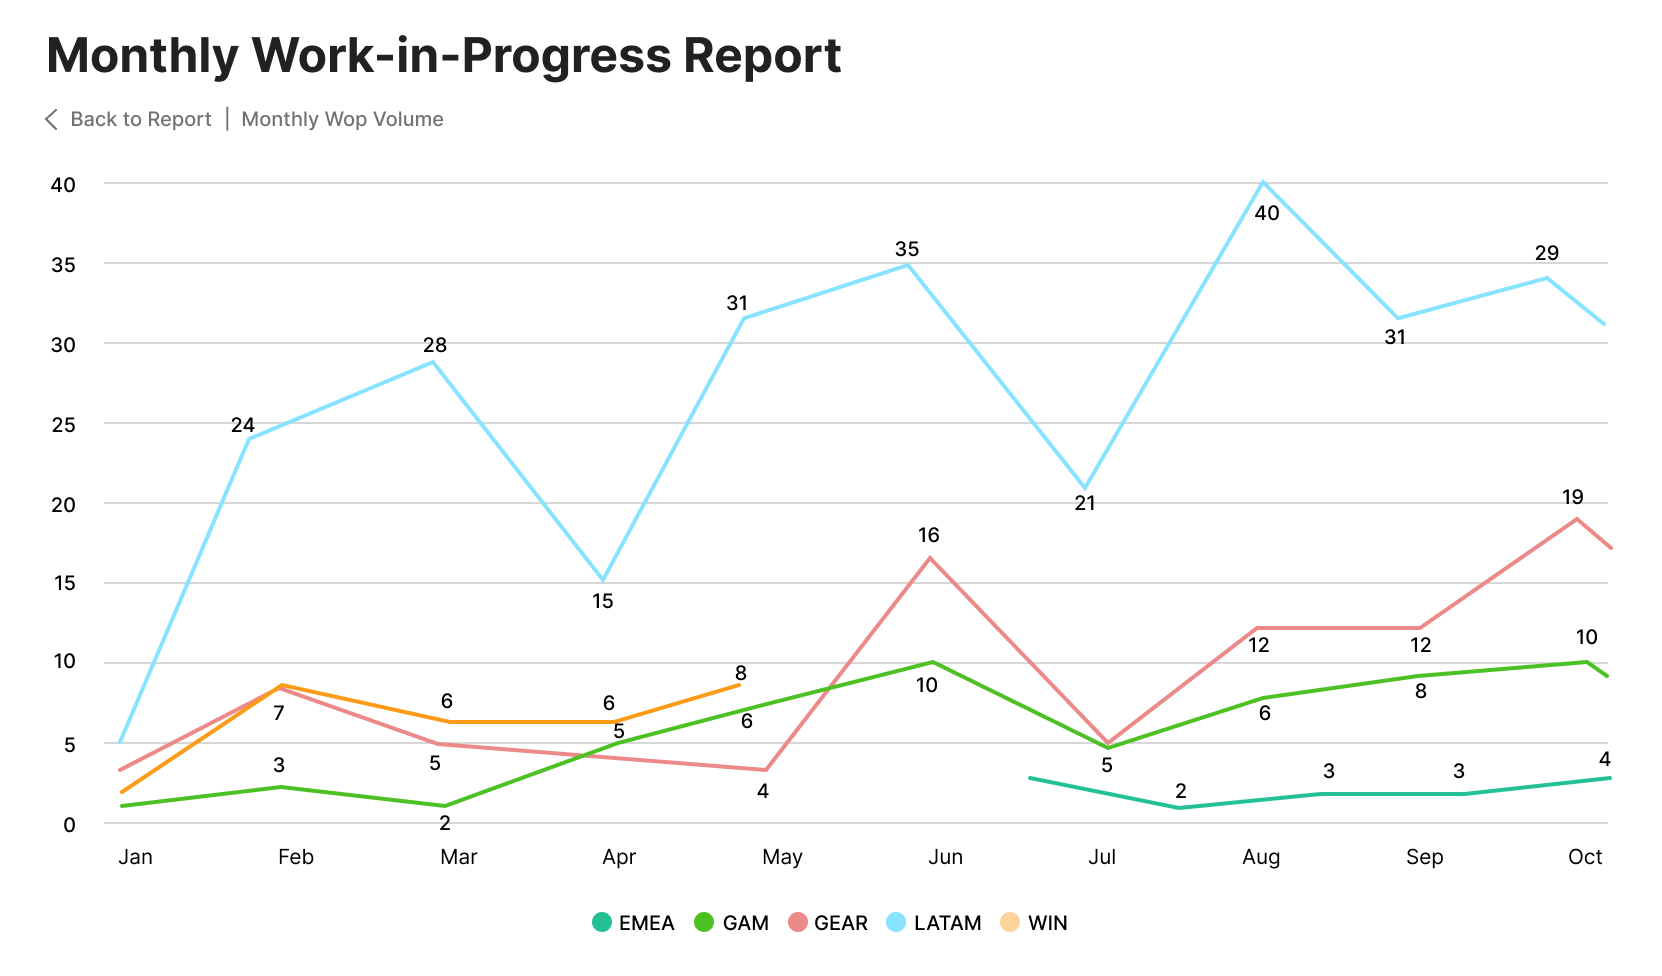
Work in progress (WIP)
Work in Progress (WIP) represents the value of work that has been completed and is billable but has not yet been invoiced to the client. High WIP can strain cash flow because it signifies a delay between doing the work and getting paid. Tracking WIP helps you ensure timely invoicing and accelerate revenue recognition.
Cost variance (CV) and schedule variance (SV)
Cost Variance (CV) and Schedule Variance (SV) are simple yet powerful metrics from Earned Value Management (EVM) that tell you if your project is on track.
- Cost Variance (CV): Measures if you are over or under budget. A negative CV means the project is costing more than planned for the work completed.
- Schedule Variance (SV): Measures if you are ahead of or behind schedule. A negative SV means the project is taking longer than planned.
Monitoring these variances in a PSA allows you to spot deviations from the plan early and investigate the cause before they escalate.
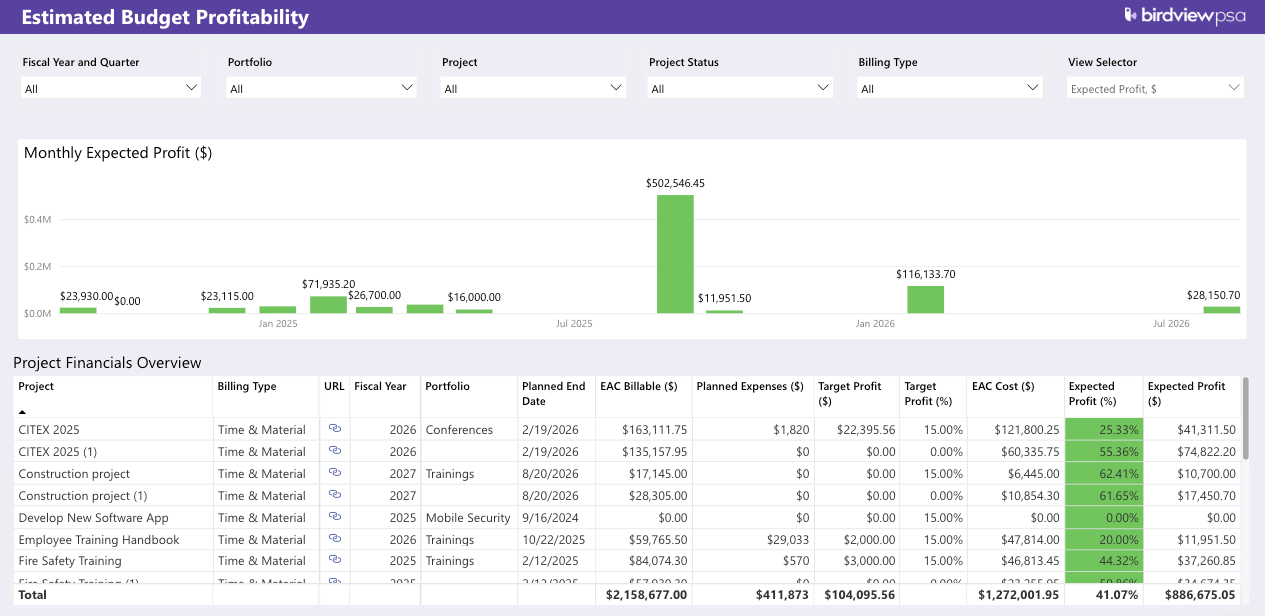
How to forecast profitability with EAC and ETC
Calculating current profitability is only half the battle. To truly manage a project‘s financial destiny, you need to look ahead. This is where forward-looking metrics like Estimate to Complete (ETC) and Estimate at Completion (EAC) become invaluable.
Understanding EAC and ETC
Estimate to Complete (ETC) and Estimate at Completion (EAC) help you forecast the final cost of a project based on its performance to date.
- Estimate to Complete (ETC): This is the forecasted cost required to finish all remaining project work. It answers the question, “How much more will we need to spend?”
- Estimate at Completion (EAC): This is the project’s new, revised total cost forecast. It is calculated by adding the actual costs to date to the ETC and answers the question, “What will the project’s final cost likely be?”
- EAC = Actual Costs to Date + ETC
How a PSA automates EAC/ETC calculations
Manually calculating EAC and ETC is complex and prone to errors. A key benefit of professional services automation software is its ability to automate these forecasts. By analyzing actual hours logged, the remaining scheduled work, and resource cost rates, a platform like Birdview PSA can generate an accurate EAC in real time.
This automated forecasting gives managers an early warning if a project is projected to go over budget, providing them with the crucial time needed to adjust the plan, manage scope, or communicate with the client.
Building a real-time project profitability dashboard in your PSA
A project profitability dashboard is a centralized, visual command center that consolidates all your key financial and operational metrics in one place. Instead of digging through multiple reports, you get an at-a-glance view of project health, enabling you to spot trends and make faster, more confident decisions.
What to include in your dashboard
An effective project profitability dashboard should act as a single source of truth for your service delivery operations. Key components to include are:
- Project Health Summary: A high-level view of all projects with color-coded indicators (e.g., red, yellow, green) for budget and schedule status.
- Budget vs. Actuals: A visual comparison of planned budget against actual costs and forecasted costs (EAC) for each project.
- Gross Profit Margin (%): A chart tracking the profitability of individual projects and the entire portfolio over time.
- Billable Utilization: A gauge showing team-wide and individual utilization rates against targets.
- Work in Progress (WIP): A clear metric displaying the total value of unbilled work to highlight potential cash flow bottlenecks.
- EAC vs. Original Budget: A variance report showing which projects are forecasted to exceed their original budgets.
How Birdview PSA provides this visibility
Birdview PSA empowers organizations to achieve this level of control with its powerful Business Intelligence Dashboards. These dashboards are fully customizable, allowing you to create role-specific views for project managers, executives, and finance teams.
By automatically pulling data from integrated time tracking, resource planning, and project accounting modules, Birdview provides a holistic, real-time view of your entire project portfolio. This unified approach eliminates data silos and connects every operational action to its financial impact, ensuring that you have the insights you need to drive profitability and deliver successful projects consistently.
Step-by-step: How to calculate project profitability with Birdview PSA
Birdview PSA simplifies and automates the entire process of tracking real time project margins. By unifying all project-related data, the platform provides a clear, step-by-step workflow for ensuring every project stays profitable.
- Set Up Project Financials: Start by defining your project’s budget, billing type (T&M or Fixed Fee), and cost rates within Birdview. Establishing these financial targets creates the baseline for all future tracking.
- Track Time and Expenses Accurately: Your team logs all billable and non-billable hours directly in Birdview. All project-related expenses are also captured, creating a complete and accurate record of all costs as they occur.
- Monitor the Project Profitability Dashboard: With data flowing in, your project profitability dashboard comes to life. Birdview automatically calculates revenue, costs, and profit margins in real time, giving you an immediate financial snapshot at any time.
- Review Forecasts (EAC/ETC): The platform continuously updates the project’s EAC based on performance. Regularly review this forecast to see if the project is on track to finish within its revised budget.
- Automate Invoicing: Use Birdview‘s built-in billing and invoicing features to generate accurate invoices directly from approved time and expense logs. This speeds up the billing cycle, reduces WIP, and improves your organization’s cash flow.
Take control of your project profitability
Waiting for month-end reports to understand project profitability is no longer a viable strategy for growing service firms. The key to protecting margins and scaling sustainably lies in real-time visibility. By unifying your projects, resources, and finances in a single PSA platform, you can move from reactive problem-solving to proactive financial management.
Birdview PSA provides the end-to-end visibility you need to calculate project profitability in real time, make data-driven decisions with confidence, and ensure every project contributes to your bottom line.
Ready to gain a bird’s-eye view of your project finances?
Frequently asked questions
H3: What is the best way to calculate project profitability?
The best way is to use an integrated system like a PSA platform that automatically calculates profitability in real time. This involves subtracting total project costs (including burdened labor costs and expenses) from total project revenue and tracking the resulting profit margin on a live dashboard.
H3: How can PSA software improve project margins?
PSA software improves margins by providing real-time visibility into costs, utilization, and budget variances. This allows managers to identify issues like scope creep or low billable utilization early and take corrective action before they impact profitability. It also improves the accuracy of future project cost estimations.
H3: What’s the difference between project accounting and regular accounting?
Regular accounting focuses on the overall financial health of the entire company (e.g., P&L statements, balance sheets) and typically operates on a monthly or quarterly cycle. Project accounting focuses on the financial performance of individual projects in real time, tracking specific budgets, costs, revenue, and profitability at a granular level.
H3: How do you track Work in Progress (WIP) for services?
In a PSA system, WIP is tracked automatically. As team members log billable hours and expenses against a project, the system calculates the value of that work based on established billing rates. This value is considered WIP until an invoice is generated for it, providing a real-time view of earned but unbilled revenue.
Further reading