For any professional services firm, project profitability is the ultimate measure of success. Yet, many organizations struggle to protect their margins from the slow erosion caused by budget overruns. You‘ve likely seen the consequences: what started as a profitable engagement ends up barely breaking even–or worse–because actual costs spiraled out of control. The problem often lies in a reactive approach, where financial issues are only discovered after it’s too late to fix them.
The solution is to shift from reactive damage control to proactive financial management. This requires more than just tracking numbers; it demands a system for comparing planned budgets against actual costs in real time, setting automated trouble indicators project budget overruns, and having clear workflows to get projects back on track. By embedding these financial controls directly into your project delivery process, you can safeguard profitability, improve forecasting accuracy, and make data-driven decisions with confidence.
What is budget vs actuals analysis in project management?
Budget vs actuals analysis is the process of comparing your planned project budget with the actual costs incurred during the project‘s lifecycle. This comparison, often called variance analysis, reveals whether a project is over, under, or on budget. For professional services firms, this is not just an accounting exercise–it is a critical practice for maintaining profitability and ensuring sustainable growth.
Consistently monitoring the budget vs actuals provides an early warning system for financial risks. It helps project managers identify issues like scope creep, resource inefficiencies, or inaccurate estimations before they escalate. Without this real-time visibility, teams often operate in the dark, relying on outdated spreadsheets and gut feelings. This leads to unpleasant surprises at the end of a project, strained client relationships, and unreliable financial forecasting for the entire organization.
The primary challenge is that the data needed for this analysis–timesheets, expenses, and project progress–is often scattered across disconnected systems. Finance teams work in accounting software while project managers use separate planning tools, creating information silos that delay insights. An effective solution requires a single source of truth that connects these functions.
How to effectively track budget vs actuals for projects
To effectively track budget vs actuals projects, you need a unified system that centralizes time tracking, expense management, and project planning data in real time. This replaces error-prone manual data entry and provides an accurate, up-to-the-minute view of a project’s financial health, enabling project managers to make timely, informed decisions.
Step 1: Establish a detailed project budget
A granular and realistic budget is the foundation of accurate tracking. Instead of a single top-line number, break down your budget into meaningful categories that align with how work is delivered.
- Labor Costs: Estimate the hours required for each role or team member and multiply by their cost or billing rate.
- Non-Labor Expenses: Include all other direct costs, such as software licenses, travel, and materials.
- Overhead: Allocate a portion of your firm‘s indirect costs (rent, utilities, administrative salaries) to understand the project‘s true profitability.
Link these budget items to specific project phases or milestones. This allows you to track spending against progress, not just time, giving you a much clearer picture of financial performance.
📚 Read more: How to improve budget planning in Professional Services with PSA software
Step 2: Implement real-time data capture
Your budget vs actuals analysis is only as good as the data feeding it. Lagging or inaccurate data creates a false sense of security. The key is to capture costs as they happen through integrated tools that are easy for your team to use.
This means replacing manual timesheets with a system where team members can log hours directly against assigned tasks and projects. Similarly, an integrated expense management tool allows employees to submit expenses for approval within the same platform they use for project work. When these functions are unified, the data flows automatically into your project‘s financial reports, eliminating delays and administrative overhead.
Step 3: Link cost tracking with project billing
To ensure accurate cost allocation and protect profitability, it is essential to create a seamless link between every tracked expense and the project billing process. When your team logs billable hours or submits project-related expenses, that data should flow directly into the invoicing system without manual re-entry. This closes the loop between work performed and revenue generated.
For time and materials projects, this ensures that every billable hour is captured and invoiced correctly. For fixed-fee projects, it provides a clear, real-time view of your profit margin as costs are incurred. A budget vs actual PSA tool like Birdview PSA automates this connection, allowing you to generate accurate invoices directly from project data. This not only improves cash flow by speeding up the billing cycle but also gives you a precise, real-time measure of each project’s profitability.
📚 Read more: Project cost estimation guide: methods and examples
Step 4: Automate budget vs actuals reporting
Manually exporting data from multiple sources to build budget vs actuals reports in a spreadsheet is time-consuming and prone to errors. By the time the report is ready, the information is already outdated. Modern PSA platforms automate this process entirely.
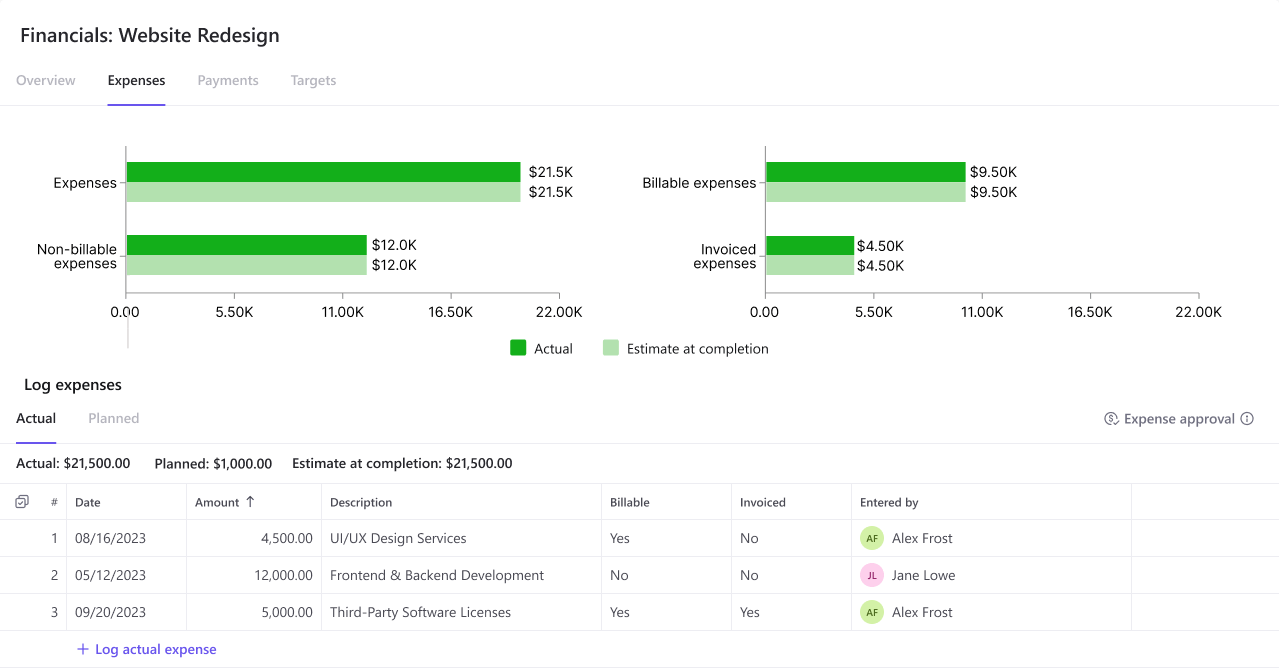
With an integrated system, you can build real-time dashboards that visualize budget vs actuals data automatically. These dashboards can display key metrics like budget variance, gross margin, and work in progress (WIP) at the project or portfolio level. This gives project managers, finance teams, and executives instant access to the financial insights they need to steer projects toward profitability.
Key financial metrics to monitor for project profitability
Beyond simple budget variance, project managers should monitor a handful of key financial metrics to get a complete and forward-looking picture of project health. These performance indicators (KPIs) help you understand not just where you are, but where you’re headed.
Cost Performance Index (CPI)
The Cost Performance Index (CPI) is a measure of the cost efficiency of a project. It is calculated by dividing the Earned Value (EV)–the budgeted cost of work performed–by the Actual Cost (AC).
- A CPI greater than 1 indicates the project is under budget.
- A CPI less than 1 indicates the project is over budget.
CPI is one of the most powerful leading indicators of financial performance because it measures budget efficiency relative to the work completed, not just the time that has passed.
Gross Profit Margin
While CPI tracks efficiency, Gross Profit Margin measures absolute profitability. It is calculated by subtracting the total cost of services from the total revenue and dividing that figure by the total revenue. Monitoring this metric in real time allows you to see how every decision–from resource assignments to approved expenses–impacts the project‘s bottom line.
Budget variance
Budget variance is the most straightforward financial metric, calculated as the difference between the planned budget and the actual costs. While simple, it remains a fundamental indicator of financial control. Tracking this metric at both the task and project level helps you pinpoint exactly where overruns are occurring so you can take targeted corrective action.
Resource utilization
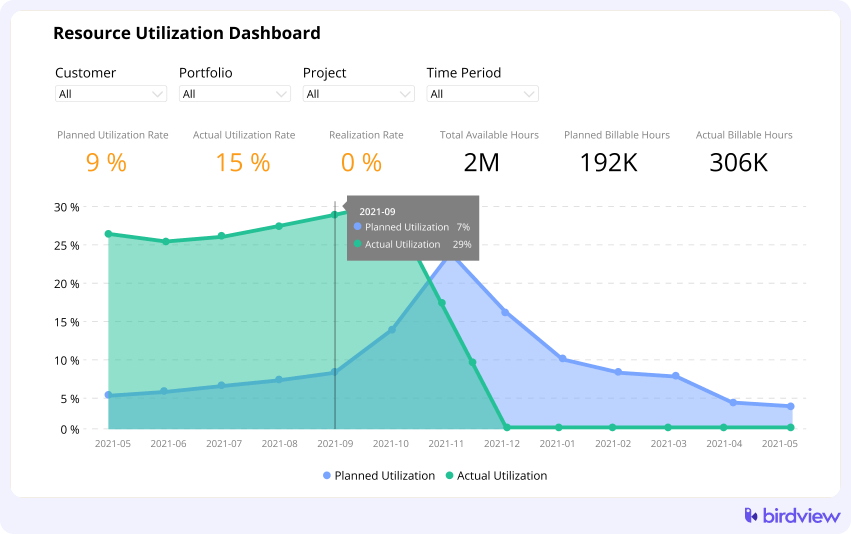
Labor is the largest cost on most professional services projects, making resource utilization a critical financial metric. High billable utilization ensures you are generating the maximum possible revenue from your team. Monitoring this metric helps you ensure that your most valuable–and expensive–resources are assigned to billable work and that teams aren’t spending excessive time on non-billable tasks that eat into project margins.
📚 Read more: Key financial metrics in project management
How to set trouble indicators to flag budget overruns
The key to preventing budget overruns is to catch deviations early. To do this, you must set up automated alerts and notifications within your project management system that trigger when key financial metrics cross predefined thresholds. This transforms budget monitoring from a manual, periodic task into an automated, real-time warning system.
Define your thresholds
Work with your finance and delivery teams to establish sensible thresholds for your trouble indicators project budget. These act as your early warning system. While they can vary by project type or client, some common starting points include:
- Budget Consumption: Set alerts to trigger when a project has consumed 50%, 80%, and 95% of its total budget. The 80% mark is particularly critical, as it signals that you have only 20% of your budget left to complete the remaining work.
- Cost Variance: Configure an alert if the actual costs for a specific task or the entire project exceed the planned budget by a certain percentage, such as 10% or 15%.
- Margin Erosion: For fixed-fee projects, set an alert if the projected profit margin drops below a predefined floor (e.g., 25%). This ensures you never unknowingly complete a project at a loss.
Configure automated alerts
Once your thresholds are defined, configure them in your PSA platform. Instead of requiring a project manager to manually check reports each day, the system will automatically send a notification to the relevant stakeholders–like the project manager and finance lead–the moment a threshold is breached. This allows your team to address issues proactively while there is still time and budget to make a meaningful course correction.
📍 Example: In Birdview PSA, you can set up Financial Targets for any project. If actual costs exceed a set percentage of the budget, the system automatically flags the project and can send an email alert, giving you an immediate signal to investigate.
Use visual indicators on dashboards
In addition to automated alerts, use dashboards with visual health indicators to communicate budget status at a glance. Most systems use a simple color-coding scheme (RAG status: Red, Amber, Green) to represent the financial health of projects.
- Green: The project is on or under budget.
- Amber: The project is approaching its budget threshold (e.g., over 80% consumed).
- Red: The project has exceeded its budget or a critical threshold.
These visual cues make it easy for project managers to monitor their own projects and for executives to get a quick, portfolio-level overview of financial health without digging into detailed reports.
Creating a remediation workflow to recover project margins
When a trouble indicator is triggered, you need a structured workflow to respond quickly and effectively. Having a predefined process ensures that issues are analyzed systematically and that corrective actions are implemented in a coordinated manner to recover project margins.
Step 1: Analyze the deviation
The first step is to dive into the data to understand the root cause of the budget variance. Was it caused by one factor or a combination of issues? A robust PSA tool provides the data you need to answer these questions. Investigate potential causes such as:
- Scope Creep: Did the team perform work that was outside the original statement of work without a change order?
- Inaccurate Estimation: Were the initial time or cost estimates for a specific phase unrealistic?
- Resource Inefficiency: Is a team member taking longer than expected to complete tasks, or was a more expensive resource assigned than originally planned?
- Unforeseen Expenses: Were there unexpected costs that weren’t accounted for in the budget?
Step 2: Communicate with stakeholders
Once you have identified the root cause, communicate transparently with both internal stakeholders and the client. Present the issue clearly, using data and reports from your PSA system to support your analysis. Hiding a budget overrun will only damage trust and lead to a more difficult conversation later. If the variance is due to scope creep, this is the time to initiate a change order discussion with the client to adjust the budget and timeline accordingly.
Step 3: Implement corrective actions
Based on your analysis, develop a plan with concrete actions to bring the project back on track. Depending on the cause of the overrun, your options may include:
- Revising the Project Plan: Adjust task assignments or timelines to improve efficiency.
- Reallocating Resources: Swap in a more cost-effective or efficient resource for remaining tasks.
- Negotiating a Change Order: Formally adjust the project scope and budget to account for new requirements.
- Reducing Scope: Work with the client to de-prioritize or remove non-essential deliverables to stay within the original budget.
Step 4: Monitor and adjust
Remediation is not a one-time event. After implementing corrective actions, you must continue to track budget vs actuals projects with increased vigilance. Use your real-time dashboards to monitor the impact of your changes and ensure the project’s financial trajectory is improving. Be prepared to make further adjustments as needed to protect your margins through to project completion.
How Birdview PSA provides real-time control over project financials
Birdview PSA unifies project management, resource planning, and financial tracking into a single source of truth, giving your organization the real-time visibility and controls needed to protect project margins. It replaces the chaos of disconnected spreadsheets with an integrated system designed for proactive financial control.
By connecting every timesheet entry, expense, and project task, Birdview PSA provides an always-accurate view of your budget vs actuals.
- Unified Data Platform: Birdview PSA automatically links time and expense tracking with project plans, eliminating manual data consolidation and providing a single source of truth for all project costs.
- Financial Targets and Alerts: You can configure custom thresholds to proactively flag deviations in budget consumption or cost variance, enabling your teams to address overruns before they impact profitability.
- Real-time BI Dashboards: Our Business Intelligence Dashboards provide at-a-glance visibility into budget vs actuals, project profitability, resource utilization, and other critical financial KPIs across your entire portfolio.
- Integrated Billing and Invoicing: Birdview PSA streamlines the entire quote-to-cash cycle by connecting project costs directly to client invoicing, which helps you ensure accurate cost allocation and accelerate cash flow.
Conclusion: Move from reactive fire-fighting to proactive profit management
Effectively managing project financials is about more than just tracking what you‘ve spent. It’s about having the foresight to see where you‘re headed and the agility to make course corrections along the way. Relying on manual spreadsheets and disconnected tools makes this nearly impossible, leaving your project margins vulnerable to scope creep, inefficiencies, and inaccurate estimates.
By implementing a system with automated trouble indicators and clear remediation workflows, you empower your project managers to become true guardians of profitability. A unified platform like Birdview PSA provides the real-time visibility and control needed to move from reactive fire-fighting to proactive financial governance, ensuring every project is delivered successfully and profitably.
Ready to gain real-time control over your project financials?
Frequently asked questions
What’s the best way to track budget vs actuals?
The best way to track budget vs actuals is by using an integrated Professional Services Automation (PSA) software. A budget vs actual PSA tool automates data collection from timesheets and expense reports, compares it to the planned budget in real time, and provides dashboards and alerts to help you manage variance proactively.
What is a common budget variance threshold?
A common practice is to set alerts for a 10-15% variance between budgeted and actual costs. Additionally, many firms set thresholds based on budget consumption, triggering notifications when a project has spent 80% of its total budget to ensure there are sufficient funds to complete the remaining work.
How does a PSA tool help improve budget forecasting?
A PSA tool improves budget forecasting by centralizing historical project data. By analyzing the actual costs and hours from past projects, you can create more accurate estimates for future engagements. This data-driven approach replaces guesswork with insights, leading to more realistic budgets and healthier profit margins.