Understanding the financial aspects is key to ensuring a project’s success and sustainability. The four core financial metrics that stand as the bedrock of project finance are Cost, Budget, Revenue, and Profit. Each metric serves as a lens through which the financial health and performance of a project can be assessed.
What are the key project finance metrics?
The four core financial metrics that stand as the bedrock of project finance are Cost, Budget, Revenue, and Profit. Each metric serves as a lens through which the financial health and performance of a project can be assessed.
Although these metrics are often discussed separately, they are closely connected. Understanding how they influence one another makes it much easier to evaluate a project’s financial health.
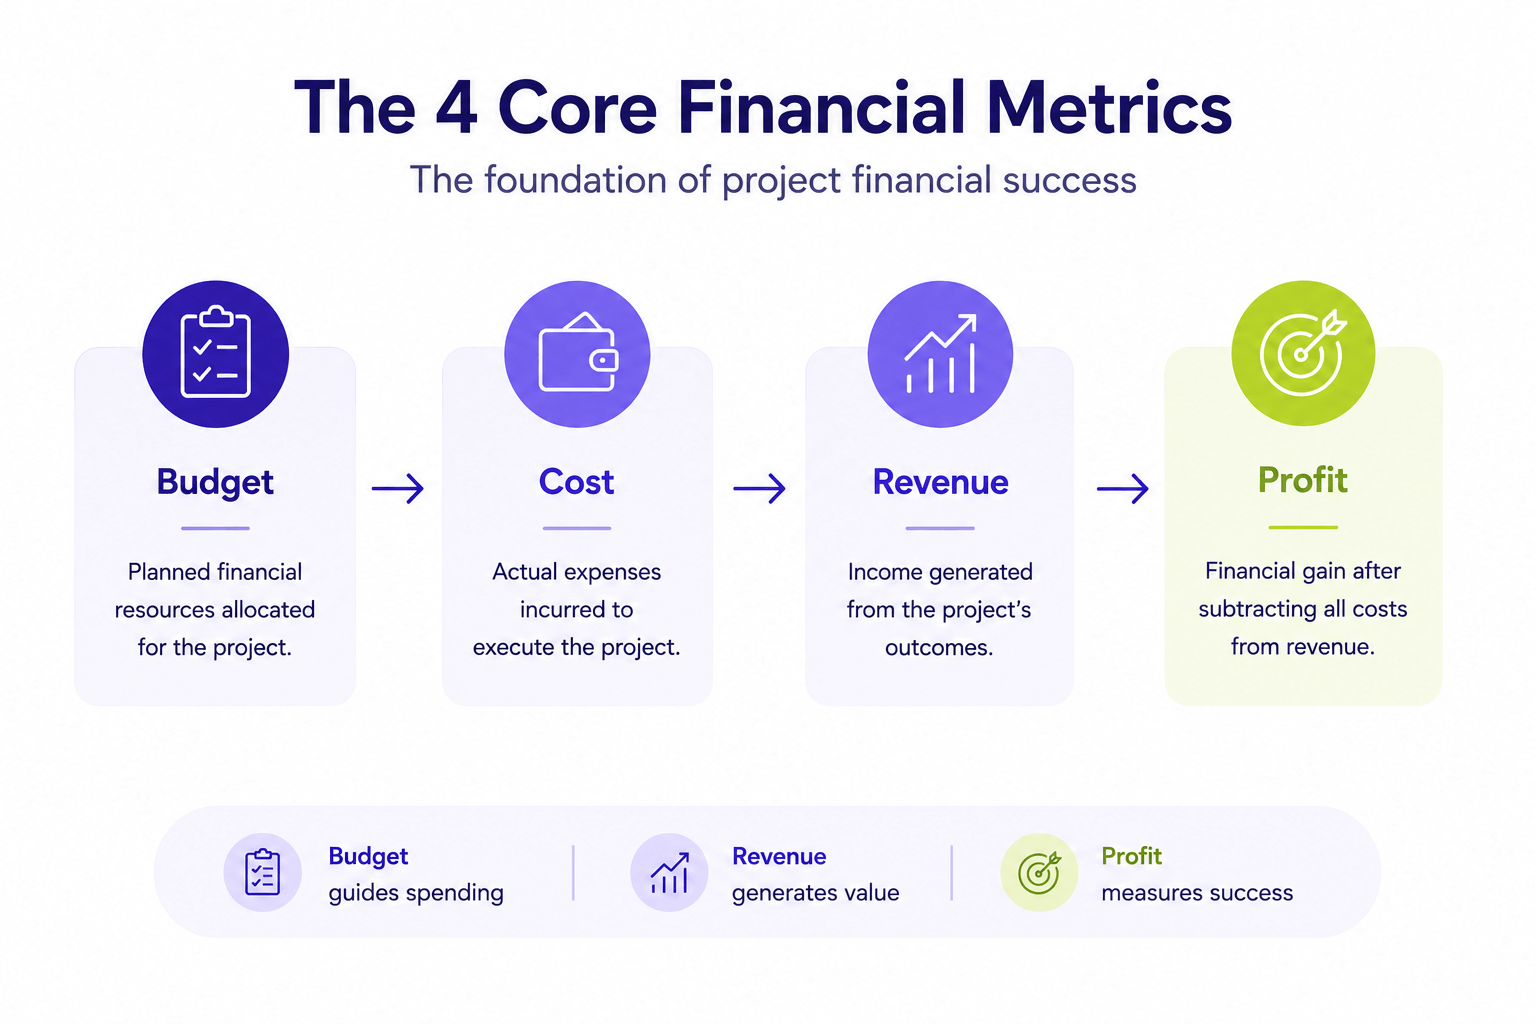 Figure 1. Budget, Cost, Revenue, and Profit work together to determine a project’s overall financial health.
Cost
Cost refers to the total expenses incurred during the execution of a project. This includes materials, labor, overheads, and any other expenses directly related to the project. Effective cost management is crucial for keeping the project within budget.
There’s no single formula for total Cost since it aggregates all expenses. However, tracking individual costs can be summarized as
Budget
The Budget represents the financial plan for the project, outlining the total money allocated for all aspects of the project. It serves as a financial blueprint, setting the limits for project expenditure.
Similar to Cost, the Budget is an aggregate figure rather than the result of a specific formula. It’s determined during the project planning phase based on estimated costs:
Revenue
Project revenue is the total income generated from the project. This can include sales, funding, or any other income streams related to the project’s outcomes. It’s a critical metric for understanding the project’s financial contribution to the organization.
Profit
Profit, or net profit, is the financial gain after subtracting all costs from the total revenue. It’s the ultimate indicator of the project’s financial success, showing the actual economic benefit derived from the project.
The 15 most important additional finance metrics in project management
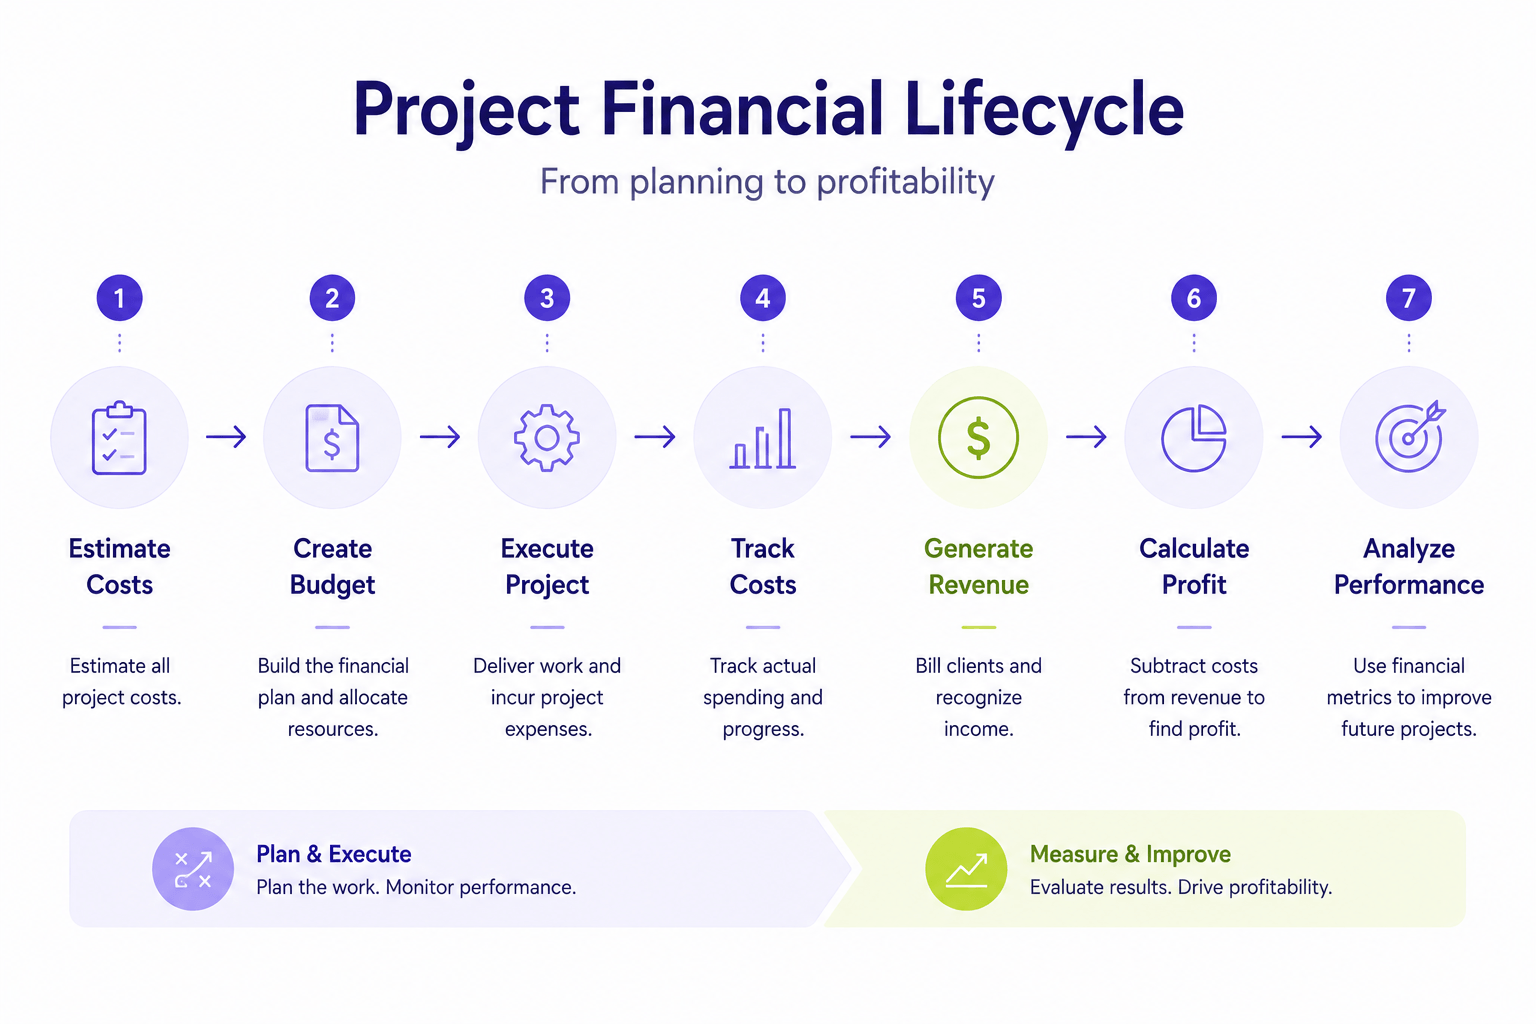 Figure 2. The project financial lifecycle from planning through financial analysis.
While Cost, Budget, Revenue, and Profit are the clearest, most popular, and critical figures for a project’s finances, below are 15 additional project financial metrics and formulas every project manager should be aware of, measure, and track.
Project financial metrics generally fall into six categories, each helping managers answer a different financial question, from staying on budget to forecasting profitability. These project metrics offer valuable insights into financial performance, ensuring that the project remains within budget and is completed in accordance with its financial constraints.
Cost Performance Index (CPI)
This project financial metric gauges how effectively the project manages its budget by comparing planned spending with actual expenditure. A CPI above 1 indicates the project is under budget, while a value below 1 indicates overspending.
Where:
- EV = Earned Value (budgeted cost of completed work)
- AC = Actual Cost (actual cost of completed work)
Schedule Performance Index (SPI)
This metric measures how efficiently a project is progressing compared to the planned schedule. An SPI greater than 1 indicates the project is ahead of schedule, while a value below 1 indicates delays.
Where:
- EV = Earned Value
- PV = Planned Value (budgeted cost of scheduled work)
Budget at Completion (BAC)
Budget at Completion represents the total approved budget allocated for the entire project. It serves as the financial baseline against which project performance is measured.
Estimate at Completion (EAC)
Estimate at Completion forecasts the project’s expected total cost based on current performance and remaining work.
Estimate to Complete (ETC)
Estimate to Complete calculates the additional cost required to finish the remaining project work.
Variance at Completion (VAC)
Variance at Completion estimates whether the project will finish over or under its original budget.
Return on Investment (ROI)
ROI measures how profitable a project is by comparing the net financial gain against the original investment.
Net Profit = Total Benefits − Total Costs
Net Present Value (NPV)
Net Present Value measures the current value of future project cash flows after accounting for the time value of money. Projects with a positive NPV are generally considered financially worthwhile.
Payback Period
The Payback Period measures how long it takes for a project to recover its initial investment through generated cash flow. Shorter payback periods generally represent lower investment risk.
Internal Rate of Return (IRR)
Internal Rate of Return is the discount rate that results in an NPV of zero. Higher IRR values generally indicate more attractive investment opportunities.
Work in Progress (WIP)
Work in Progress measures completed work that has not yet been billed to the client. It is particularly useful for milestone-based billing and helps project managers monitor available billable work while identifying potential revenue leakage.
Earned Value Analysis (EVA)
Earned Value Analysis combines project scope, schedule, and cost performance to evaluate overall project health. It helps forecast completion dates, final costs, and future project performance.
EVA primarily relies on two key performance indicators:
- Cost Performance Index (CPI) – measures budget performance.
- Schedule Performance Index (SPI) – measures schedule performance.
Projects where either CPI or SPI falls below 1 require attention. When both metrics are below 1, the project is typically both over budget and behind schedule.
Further Reading
Utilization Rate
Utilization Rate measures the percentage of available working time spent on billable work. It helps organizations understand how effectively resources are being used.
For example, if your team logs 800 billable hours out of 1,000 available hours, the utilization rate is 80%. Low utilization may indicate excess capacity or too much time spent on internal work.
Realization Rate
Realization Rate measures the percentage of available billable hours that are actually billed to clients, making it particularly valuable for professional services organizations.
For example, if consultants have 450 billable hours available but only 315 hours are billed, the realization rate equals 70%. Low realization often indicates lost revenue opportunities.
Realized Rate
Realized Rate combines billing rates with realization to show the effective revenue generated per hour.
For example, if a consultant bills at $120/hour with a realization rate of 75%, the realized rate equals $90/hour. This metric helps evaluate overall resource profitability and pricing effectiveness.
How utilization, realization, and realized rate work together
Utilization rate, realization rate, and realized rate are closely related, but they measure different aspects of resource profitability. Understanding how these metrics build on one another helps project managers identify whether profitability issues are caused by low resource utilization, unbilled work, or ineffective billing rates. The diagram below illustrates how these three metrics connect.
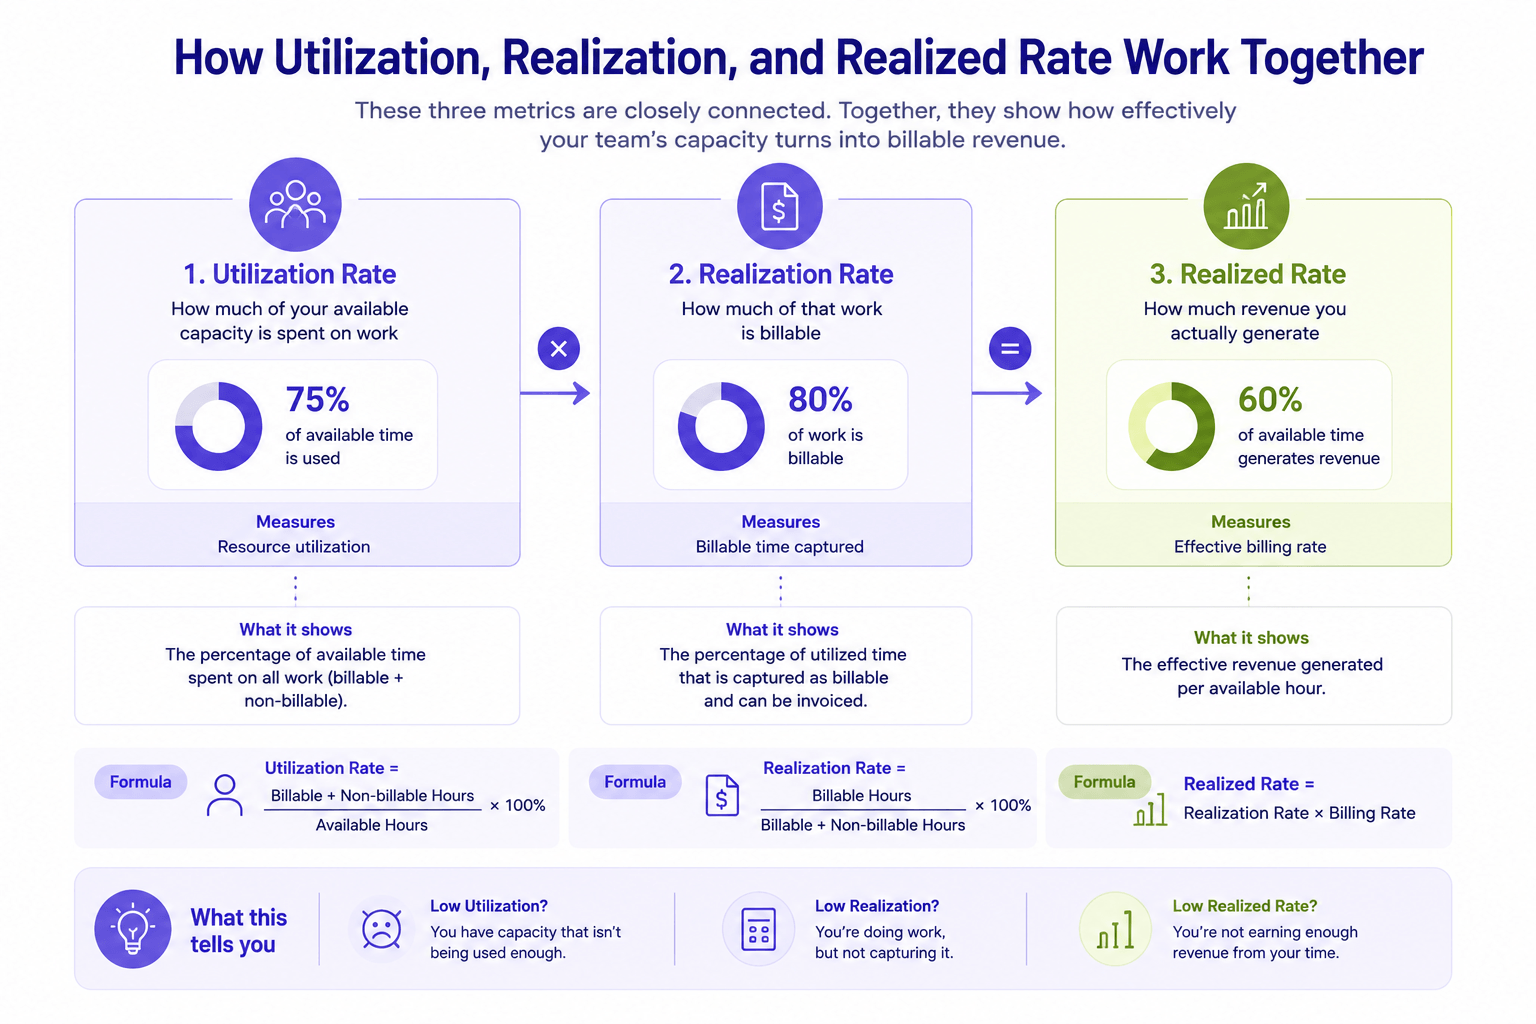 Figure 3. Utilization rate, realization rate, and realized rate measure different stages of resource profitability, from available capacity to billable work and ultimately revenue generation.
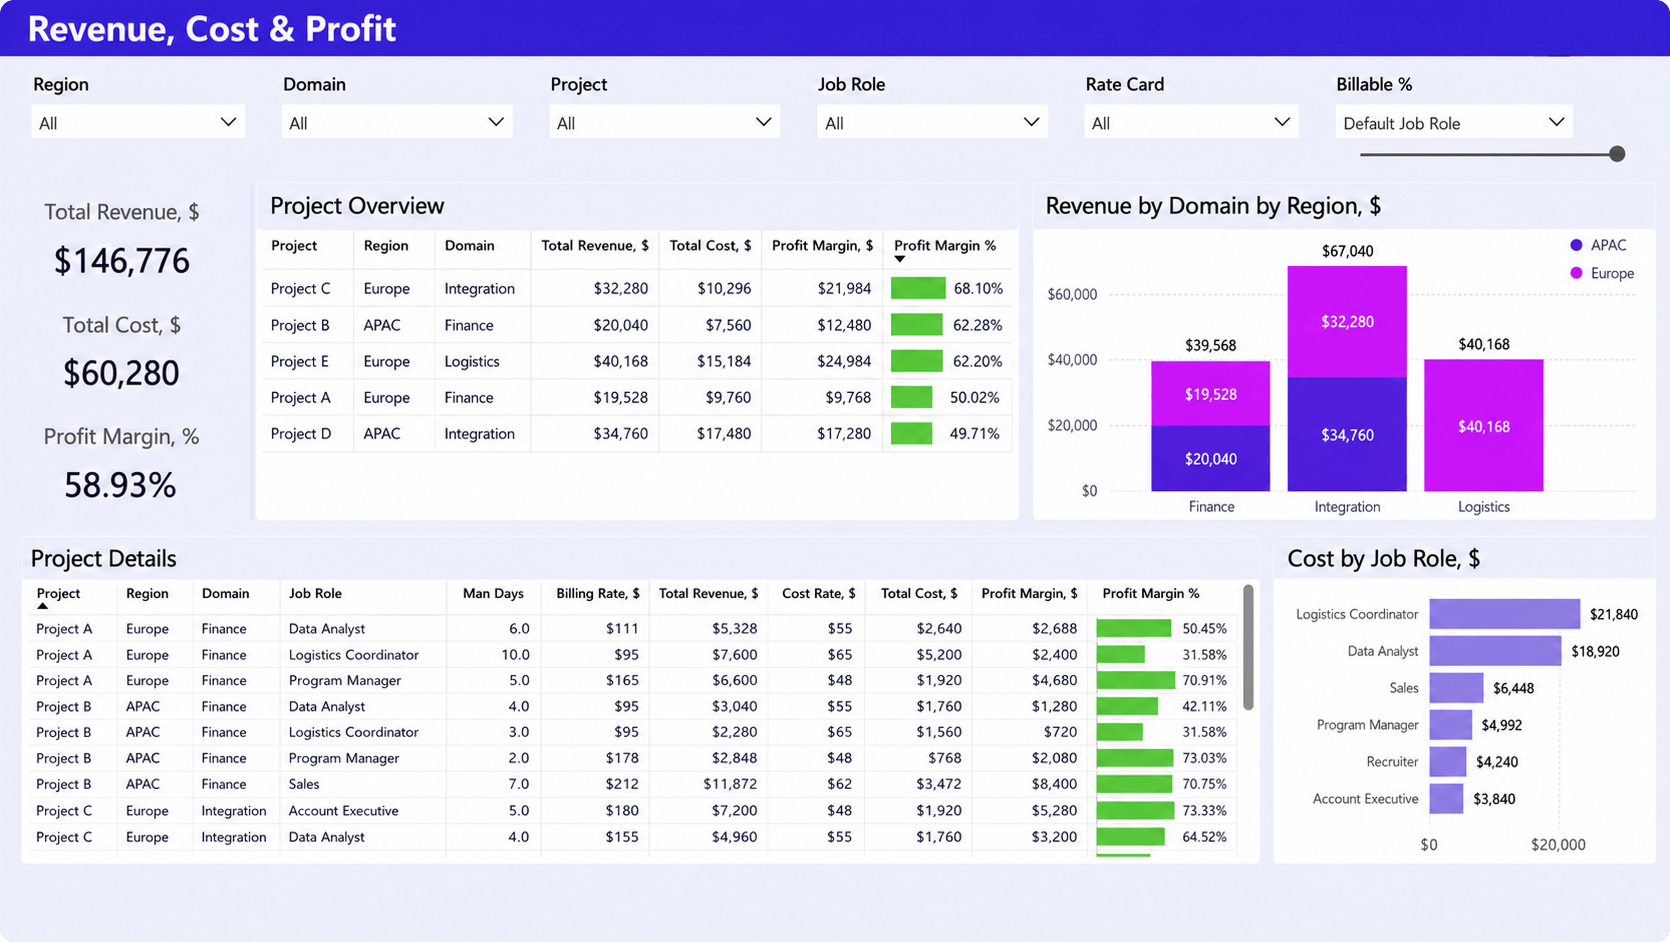
Monitor all your project financial metrics in one dashboard
Project financial metrics deliver the most value when they’re monitored continuously rather than calculated manually. A centralized financial dashboard gives project managers real-time visibility into budgets, costs, profitability, utilization, forecasts, and billing progress, helping teams identify financial risks early and keep projects on track.
Project financial metrics are most useful when they are tracked consistently and reviewed in context. By monitoring budget, cost, revenue, profit, utilization, billing, and forecasting metrics together, project managers can identify financial risks earlier and make better decisions before they affect project profitability.