Ksenia Kartamysheva
 - Improving project margins starts during project delivery, not after month-end. Weekly visibility into margin, budget burn, utilization, and realization allows consulting firms to identify risks while corrective action is still possible.
- The most common causes of margin erosion include unpriced scope changes, incorrect staffing levels, delayed subcontractor costs, stale reporting, and treating margin as a finance metric instead of a delivery metric.
- Services firms can improve profitability by applying seven operational levers, including weekly margin reviews, staffing based on target margin, disciplined change-order management, phase-level budget thresholds, faster time approvals, subcontractor cost reservations, and estimate-versus-actual reviews after project completion.
- Fixed-price and time-and-materials projects require different margin controls. Fixed-price work depends on strong scope management and accurate estimating, while time-and-materials engagements rely on realization tracking, timely billing, and effective rate management.
- As project portfolios become more complex, spreadsheets make it difficult to monitor live project margins. Professional Services Automation (PSA) software helps connect time tracking, project budgets, resource planning, and billing into a single operational workflow, providing earlier visibility into margin risks.
Project margin on a live engagement is revenue minus fully loaded delivery cost, expressed as a percentage of revenue. Fully loaded means labor at cost rate, approved expenses, and subcontractor commitments. Services firms that improve margins do not wait for the P&L close. SPI Research’s 2026 Professional Services Maturity Benchmark links Level 5 billable utilization of 81.2% to an
industry average of 66.4% [1]. SPI publishes no quartiles. That seven-point spread is a margin lever: under-utilized seniors still carry salary cost whether they bill or not.
This playbook is for COOs, CFOs, and delivery leaders at consulting and professional services firms. It covers margin moves during the engagement–not a post-mortem deck.
What project margin measures (and what it ignores)
Consulting firms usually track gross project margin first: (billable revenue − direct labor cost) ÷ revenue. Finance then asks for contribution margin after overhead allocation. If overhead hits monthly, the live number delivery sees is incomplete until books close.
Budget burn is the early warning signal: hours or dollars consumed versus sold. Catch overruns at 30% burn, not 90%. Realization rate (billed ÷ logged billable value) exposes write-offs on T&M work. Firm-wide utilization ties bench cost to margin–SPI 2023 links top-quartile firms above 75% utilization to a median near 68% [1].
| Metric | Formula (simplified) | Decision use |
|---|---|---|
| Gross project margin | (Revenue − direct labor cost) ÷ revenue | Engagement lead, weekly review |
| Budget burn | Hours consumed ÷ hours sold (or $ consumed ÷ $ sold) | Catch overruns at 30% burn, not 90% |
| Realization rate | Billed revenue ÷ logged billable value | Find write-offs and rate leakage |
| Utilization (firm) | Billable hours ÷ available hours | Portfolio staffing and bench cost |
Margin improvement starts when these four numbers share one data path–hours, rates, and budget on the same record. Birdview PSA knowledge-base cases from professional services firms show four to five hours per billing cycle lost. The cause: time and project financials lived in separate tools. That delay is margin risk: the overrun happened Tuesday; finance saw it next Monday.
Where margin erodes on active projects
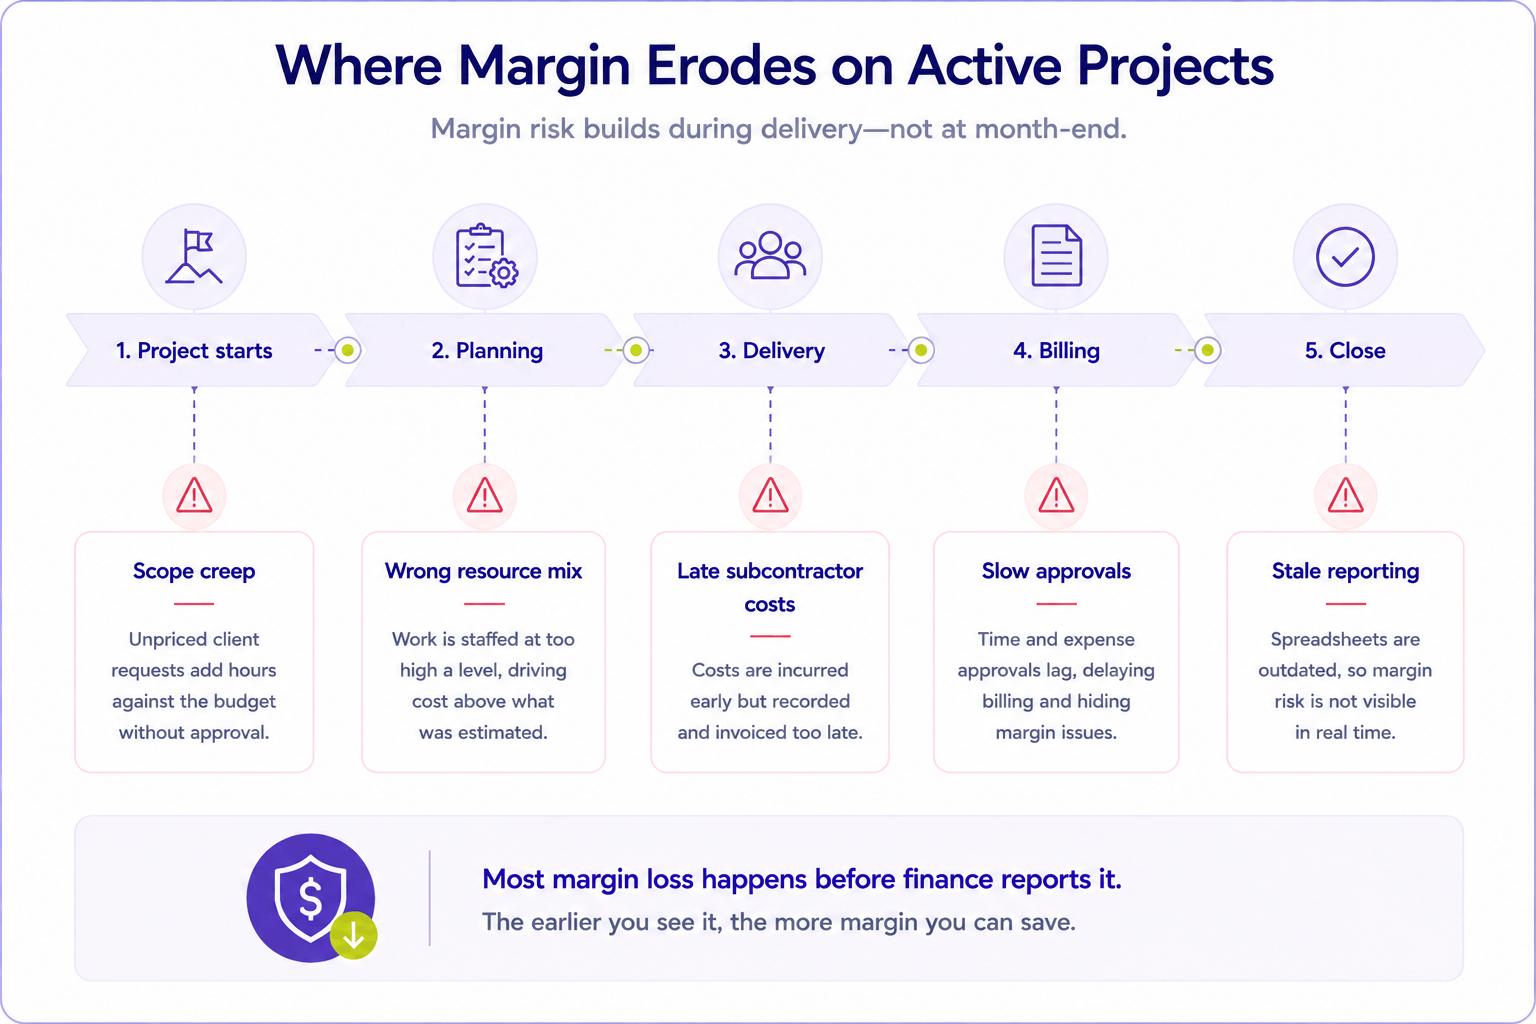
Four leak patterns show up before the engagement closes:
Scope absorbed without a change order. Informal client requests stack hours against a fixed fee. No line item moves; margin falls in silence.
Wrong seniority on the work. A partner-hour task staffed with a manager looks fine on utilization until cost rate exceeds the estimate.
Subcontractor cost arrives late. Work in week two; invoice in week six; client invoiced in week five. A 31-person professional services firm (Birdview PSA knowledge base) spent multi-hour cycles reconciling subcontractor and labor costs. Commitments were not reserved when work was approved.
Stale spreadsheet margin. The budget tracker was exported Friday; weekend hours and a rate change are not in the file. The cell stays green. The project does not.
Deltek’s 2022 Clarity report found 23% project overrun rates at firms without integrated PSA versus 11% where delivery and financials share a platform [2]. Half the overrun gap is visibility and intervention time–not pricing genius.
Where teams go wrong: they treat margin as a finance KPI instead of a delivery KPI. Project leads own schedule; margin sits in a spreadsheet finance refreshes monthly. By the time margin appears on the leadership deck, the staffing mix and scope decisions that caused the slip are already locked.
Seven levers to improve project margins
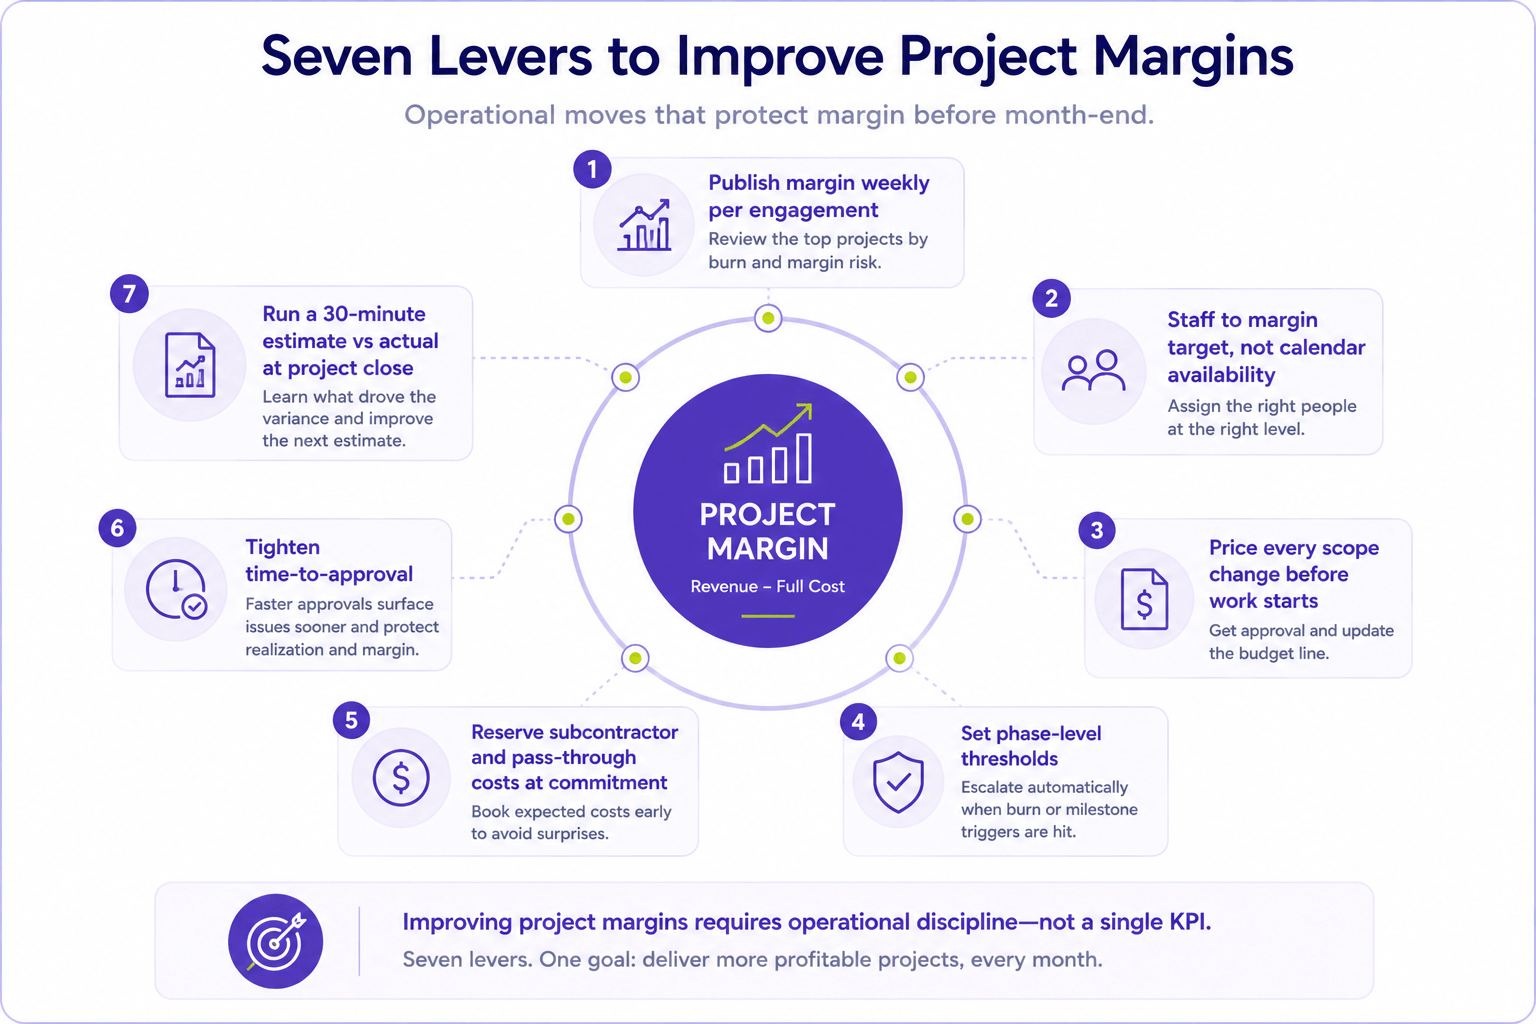
Use this as an operating checklist. Not every lever needs software on day one; all seven need an owner.
- Publish margin weekly per engagement. Same meeting as utilization. Cover the top five engagements by burn rate, plus any engagement under target margin with more than 40% budget consumed. No new meeting–replace status theater with economics.
- Staff to margin target, not calendar availability. Before kickoff, model cost mix: required skills at the lowest role that can deliver quality. Replace availability-first assignment with rate-card-first assignment.
- Price every scope change before work starts. Template: description, hours or fixed fee, client approval, budget line updated. Informal Slack requests do not count.
- Set phase-level thresholds. Example: if phase burn exceeds 85% while milestone completion is below 70%, escalation is automatic–not optional. Thresholds differ by practice; write them down.
- Reserve subcontractor and pass-through cost at commitment. When a subcontractor is engaged, book the expected cost to the project budget immediately. Finance matches invoice to reservation, not surprise.
- Tighten time-to-approval. SPI 2023 top-quartile firms review utilization weekly [1]. Firms at lower maturity take six to ten days to finalize a week of time [1]. Shrink that lag; margin alerts are useless on stale hours.
- Run a 30-minute estimate-vs-actual on close. Three fields: hours variance, rate mix variance, scope variance. Document which estimate assumption failed–hours, rates, or scope–not only that margin missed. Feed the next proposal. Margins improve when sales stops repeating the same under-estimate each quarter.
Full stop on buying new tools until lever 3 and 7 have owners. Process beats another dashboard. Related reading: how service delivery management works.
Weekly margin review: A 45-minute cadence
Monday margin standup (delivery + finance, 45 minutes max).
| Block | Time | Output |
|---|---|---|
| Portfolio heat map | 10 min | List engagements below target margin with >30% burn |
| Staffing moves | 15 min | Two swaps or descopes with named owners |
| Scope / CO queue | 10 min | Open change orders awaiting client sign-off |
| Utilization outliers | 10 min | Under-70% roles with billable expectation |
One firm in the Birdview PSA knowledge base caught a senior consultant double-booked at a client kickoff. The spreadsheet lagged live assignments by three days. Weekly margin review only works when assignment and hours data is current–not exported.
Close each standup with one action per at-risk engagement: descope, re-staff, or issue a change order. If the action has no owner and date, the meeting was reporting–not margin management.
Fixed price vs time and materials: Different margin rules
| Contract type | Margin risk | Protection habit |
|---|---|---|
| Fixed price | Scope creep, under-estimated hours | Aggressive change-order discipline; phase thresholds; senior review before discounting |
| Time and materials | Rate leakage, write-offs, slow billing | Realization tracking; cap hours without client notice; bill weekly where contracts allow |
| Retainer / subscription | Scope expansion inside flat fee | Define included hours; meter overage monthly |
What is the margin difference between fixed price and T&M in practice? Fixed-fee engagements concentrate risk in the estimate. One bad assumption erodes the whole fee. T&M shifts risk to the client hour-by-hour but exposes realization: not every logged hour becomes billed revenue. Firms above ~30 billable staff typically run both; margin improvement means different controls per type, not one policy.
When live margin requires PSA (not another spreadsheet)
Spreadsheets work for a single engagement post-mortem. They fail as a portfolio margin system past roughly 20–30 billable staff or when more than two contract types run in parallel.
PSA (Professional Services Automation) ties time entry, rate cards, budget burn, and invoicing to one engagement record. Lever 1 (weekly margin) then needs no Friday export ritual. Mid-market firms often adopt Birdview PSA when margin reviews still mean merging Harvest or Toggl exports with a master budget sheet. Enterprise stacks (Kantata, Certinia on Salesforce) fit the same problem at larger program scale.
Pilot one live engagement for two weeks. Track three signals: does margin variance show up within 48 hours of a staffing change? Do change orders update budget lines before work starts? Does finance agree the PSA margin matches the ledger after invoice? If all three improve, the infrastructure bet pays for itself faster than another pricing training.
That is an infrastructure decision. The seven levers above are not.
FAQ
How to calculate project profitability for a professional services firm? Profitability at engagement level is revenue minus fully loaded cost. That cost includes direct labor at cost rate, expenses, and subcontractor. Firm profitability adds overhead and sales cost. For live decisions, track gross project margin and budget burn weekly on each active engagement.
How do consulting firms calculate project margin in practice? Delivery leads compare billed or forecast revenue to labor cost at internal cost rates–not bill rates. Finance may later apply overhead. The practical margin number is: (revenue − direct cost) ÷ revenue, updated when approved hours and expenses post.
What formulas do consulting firms use to track project profitability? Common set: gross margin %, budget burn, realization, and utilization. Budget burn is hours or dollars consumed ÷ sold; realization is billed ÷ billable value; utilization is billable ÷ available hours. SPI 2023 ties top-quartile performance to weekly utilization discipline [1].
How to protect project margin in a consulting engagement? Price scope changes before work, staff to the rate card, and reserve subcontractor cost at commitment. Review margin when phase burn crosses thresholds–not at invoice. Change orders are the main fixed-fee control; realization tracking is the main T&M control.
What is the margin difference between fixed price and time and materials contracts? Fixed price caps client spend. The firm carries the overrun risk if scope grows. T&M bills actual effort but requires strict realization so non-billable and write-off hours do not silently erode margin. Mixed portfolios need separate playbooks.
How to improve project margins in a services firm? Run weekly margin reviews on live data and enforce priced change orders. Staff to margin, not availability. Reserve pass-through costs early, then close each project with estimate-vs-actual feedback into the next bid. Utilization above firm median (SPI top quartile 75% vs 68% median [1]) supports margin but does not replace scope control.
What causes margin erosion on active consulting projects? Unpriced scope creep, seniority mismatch on tasks, late subcontractor invoices, stale reporting, and slow time approval. Deltek 2022 data shows roughly twice the overrun rate (23% vs 11%) when delivery and financial systems are not integrated [2].
Bottom line
Improving project margins in a services firm is an operating rhythm, not a pricing workshop once a year. Make margin visible weekly, protect it with scope and staffing rules, and close the loop from estimate to actual. Firms that only measure margin after the client signs off are optimizing history.
Start with lever 1 and lever 3 this month–weekly margin visibility and priced scope changes. Add the rest in order. No new software required until both habits stick on your team.
Sources
[1] SPI Research – 2026 Professional Services Maturity Benchmark – https://spiresearch.com/psmaturitymodel/
[2] Deltek – 2022 Clarity Professional Services Industry Report (project overrun rates: integrated PSA vs non-integrated) – https://www.deltek.com/en/clarity