Ksenia Kartamysheva
 - Most PS firms can recover 10–20% of delivery capacity without hiring; a two-week capacity audit establishes the baseline and locates the leaks.
- Automating reporting and invoicing pays back fastest (~0.17 FTE of ops capacity) because it requires no behavior change.
- Fixing misallocation returns 0.5–1.0 FTE of senior capacity, the scarcest resource a firm has.
- Templates, handoff checklists, and change-order capture recover another 0.5–1.0 FTE from process waste.
- Consolidating tools and forecasting demand 6–8 weeks out only work after the first three levers make the data trustworthy.
- Hire after recovery, not instead of it, so new hires land in a system that doesn’t leak their hours.
Most professional services firms can recover 10–20% of delivery capacity without hiring by working five levers: automating admin work like reporting and invoicing, fixing resource misallocation, cutting process waste from blank-page planning and rework, reducing coordination overhead across tools, and smoothing demand peaks with forecasting. Each lever returns paid hours that currently never reach client work.
The COO’s version of this problem usually sounds like a contradiction. Demand is up, the board wants operating leverage before headcount, and the delivery team swears it is maxed out. In my experience, “we’re at capacity” is usually wrong by one or two FTEs. The hours exist. They are being spent on manual reporting, invoicing rituals, status chasing, rework from bad handoffs, and scope changes nobody priced.
Add those hours up across a 60-person consultancy and you find a phantom team the firm pays for but never sees. Across 40+ professional services firms we have interviewed since early 2025, the same leak pattern repeats regardless of vertical: consulting, engineering, agencies, IT services.
One thing this article is not: a squeeze-the-team play. Every lever below removes work people already resent doing. That is why these changes tend to raise morale rather than burn it.
The five levers, ordered by speed to value: admin automation, allocation fixes, process waste, coordination overhead, and demand smoothing. Throughout, we use a standard example firm: 60 people, 25 billable staff, a $150 blended bill rate, and roughly 1,800 paid hours per person per year.
First, find out where the hours actually go
Before pulling any lever, run a two-week capacity audit: track where paid hours land across client work, internal admin, reporting, coordination, and rework. Most firms have never seen this number. Around 80% of the firms we talk to plan resources in spreadsheets, where non-billable drag is invisible by design. A spreadsheet shows who is assigned to what. It does not show the four hours a PM spent assembling a status report from five systems.
The audit needs no new tooling. Add four or five categories to your existing time entries (client delivery, internal admin, reporting, coordination, rework) and ask everyone to use them for two weeks. Pair it with a one-question survey: “What eats your time that shouldn’t?” Expect the survey answers to identify the levers before the time data confirms them. People know where their week goes. Nobody has asked them.
The output is your firm’s own hidden-team number, stated in hours per month. That becomes the baseline every lever gets measured against at day 90. Without a baseline, capacity recovery is a feeling, not a result. The same discipline applies here as in building the business case for consolidating delivery tools: measure before you change anything.
Industry context makes the audit more urgent, not less. The 2026 SPI Professional Services Maturity Benchmark, covering 509 organizations, put median billable utilization at 66.4%, with Level 3 maturity firms at 72.5% and Level 5 at 81.2%. The gap between those numbers is where the phantom team lives.
Lever 1: automate the admin drag (fastest payback)
Reporting and billing rituals are the cheapest hours to recover because no behavior change is required. The work simply stops being manual. Nobody has to adopt a new habit; a machine takes over a chore.
Two rituals dominate. The first is the monthly reporting cycle: export time logs to Excel, clean them, build the utilization and budget views, format, distribute. About 70% of the firms in our interviews run some version of it. One operations lead at an energy consulting firm put it plainly: “I’m just thinking of all the time logs I’ve exported from Excel and all the analysis.” The second is invoicing day. Roughly half the firms we speak with describe it the way an operations lead at a civil engineering firm did: “Invoicing takes an entire day every month.”
The math for the example firm, kept conservative:
- Reporting: 20 hours per month across ops and PMs
- Invoicing: 6 hours per month
- Total: 26 hours per month, about 312 hours per year, or roughly 0.17 FTE
Small in FTE terms. But those hours land on exactly the people who run everything else: the operations lead, the office manager, the delivery director. Freeing them first is what makes levers 2 through 5 possible, which is why this one goes first despite the modest number. In Birdview, for example, the mechanism is that dashboards read directly from tracked time and invoices generate from the same records, so the export-assemble-format cycle disappears rather than gets faster.
Lever 2: put the right people on the right work
The most expensive leak in a services firm is senior people doing work billable at half their rate, or not billable at all, while others sit near the bench. This is a matching problem, not a capacity problem, and it does not show up in headcount math.
Four misallocation patterns come up constantly in our interviews:
- Seniors absorbed by admin. Principal-level people chasing status updates and assembling reports instead of delivering or selling.
- Double-booked key people. One engineering director at a defense contractor described his planning tool this way: “It’ll let you double book people. I could load somebody up with 400% of work.” The overloaded person becomes a queue. Work stalls behind them while generalists idle.
- Staffing by hallway negotiation. Assignments go to whoever’s name comes to mind first, not whoever has the right skills and actual availability.
- Late staffing after kickoff. Roles get filled after the project has already started, not before. Early milestones absorb the delay, and the client’s first impression of the engagement is a team still assembling itself.
The fix requires one thing most firms lack: a live, skills-aware view of who is doing what and who is free. Around 80% of the firms we interview run this in spreadsheets or in one person’s head. A director of professional services at an IT consulting firm described the result: “I see 10 opportunities. I don’t know who’s available.”
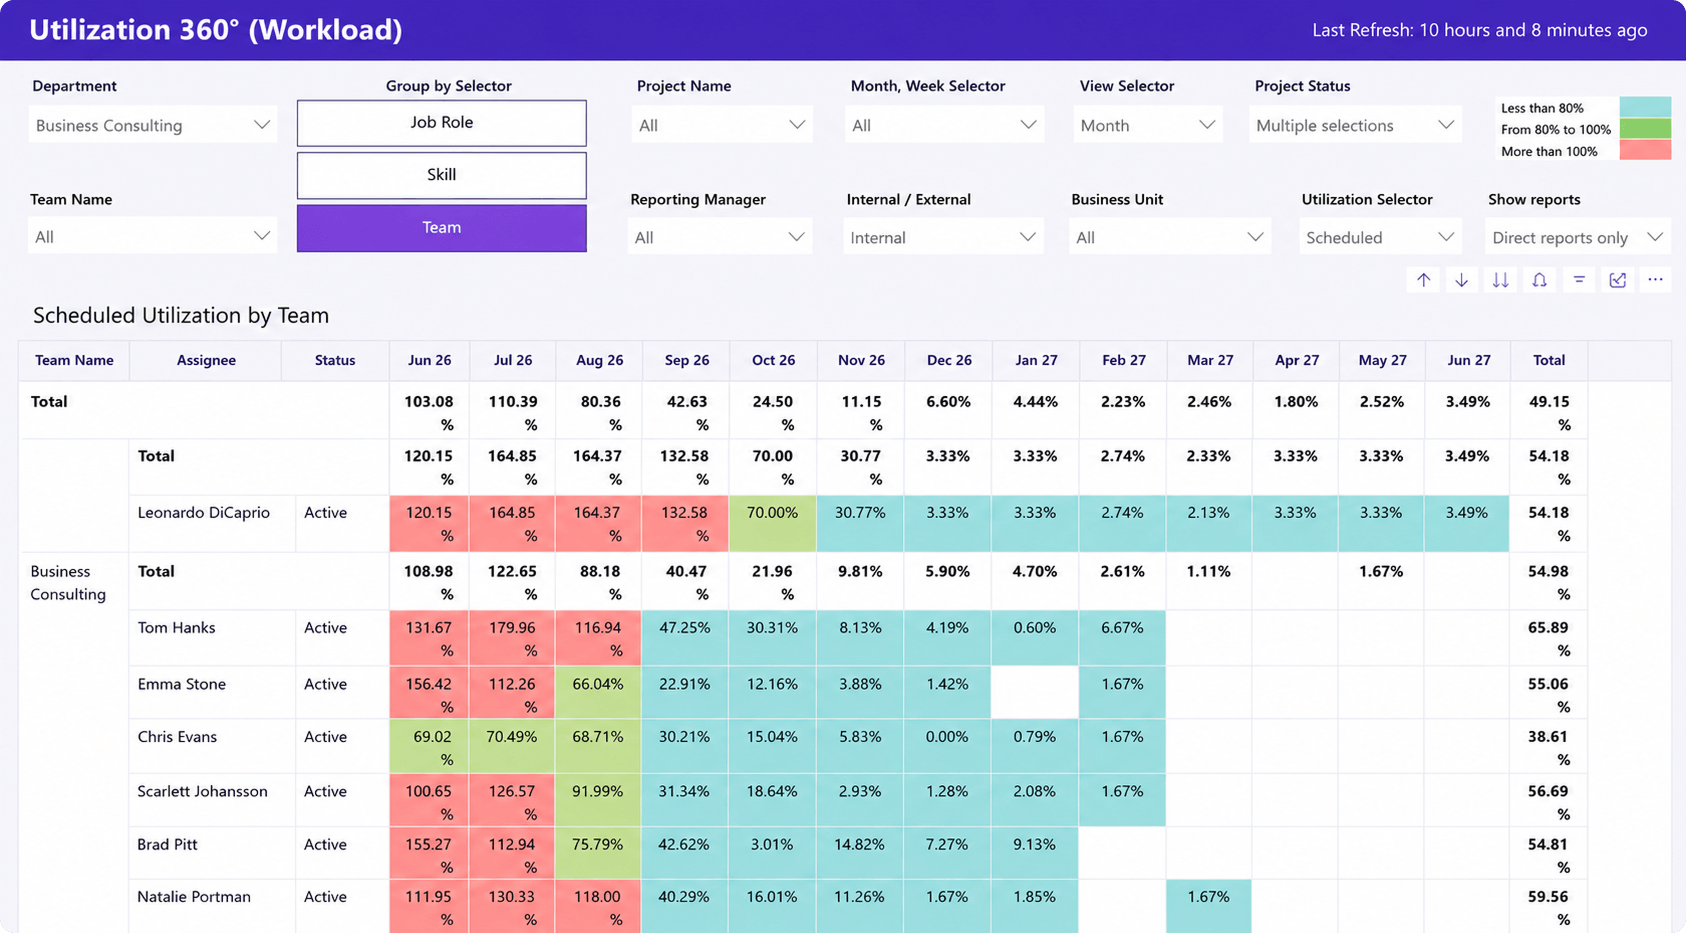
Worked math for the example firm, using visible assumptions. Say 8 senior people each shift 2 hours a week of admin and status work onto the ops capacity recovered in lever 1. That is 736 hours a year at 46 working weeks. Correcting one chronic double-booking typically frees another 300 to 900 hours of queued and idle time combined. Total: 0.5 to 1.0 FTE of senior delivery capacity, the scarcest kind a firm has. If even half of it converts to billable work at $150, that is $55,000 to $130,000 a year.
Part of that recovery comes from treating bench time as planned capacity instead of dead time. Unplanned bench becomes idle time and quiet attrition risk; planned bench is a buffer you can point at the next staffing gap:
| Bench window | Useful work | Delivery payoff |
|---|---|---|
| 1–3 days | Template cleanup, estimate calibration, QA checklists | Faster next kickoff |
| 1–2 weeks | Shadow on a stretch skill, internal training pack | Broader staffing options |
| Between deals | Pre-build for a sold start date | Day-one readiness, no late-staffing gap |
Capacity planning as a discipline goes deeper than one section can carry; our resource management guide covers demand modeling and skills matrices. Here the point is narrower: fix the allocation decisions you are already making blind.
Lever 3: cut process waste in delivery itself
Three delivery-process leaks compound quietly: blank-page planning, handoff rework, and silently absorbed scope. Each looks small per engagement. Multiplied across a year of projects, they add up to a real fraction of a person.
Blank-page planning. Every engagement re-invented from scratch costs planning hours and produces inconsistent quality. Moving standard engagement types onto templates (a core practice in our professional services operations guide) typically saves a full planning day per kickoff.
Handoff rework. About 35% of firms in our interviews report a broken sales-to-delivery handoff: deals arrive mis-scoped or mispriced, and delivery discovers it mid-project. Each discovery forces a replanning cycle. A one-page handoff checklist, completed before kickoff, is the cheapest insurance in the operations playbook.
Absorbed scope. An unpriced yes is unpaid work by definition. When a client asks for “one small addition” and the team absorbs it, capacity leaks with no revenue attached. Capturing those requests as change orders converts each one into either revenue or a declined request. Both outcomes are capacity wins. That only works if someone actually has standing to decline or re-sequence the request without waiting for a partner email chain; name that person before the next unpriced yes happens. Tracking change orders alongside project financial KPIs like budget variance is what keeps this honest.
Worked math at 30 engagements per year: one recovered planning day per engagement is 240 hours. One avoided rework cycle (three person-days) on a third of engagements is another 240 hours. If each billable person absorbs even one unpaid scope hour a week, capture converts about 1,100 more hours into revenue or refusal. Stated conservatively, this lever lands in the 0.5 to 1.0 FTE range.
Lever 4: reduce coordination overhead
Fragmented tooling taxes every hour that survives the other leaks. Around 75% of the firms we interview run delivery across disconnected systems: tasks in one tool, time in another, budgets in a spreadsheet, client communication in email. Answering “where does this project stand?” means visiting all of them.
The tax comes in two forms. The first is tool-hopping and the refocusing cost that follows each switch. Research by Gloria Mark at UC Irvine measured an average of 23 minutes to fully return to an interrupted task; prospects in our calls self-report about 15 minutes to, as one head of delivery put it, “get back in the flow.” The second is status chasing: PMs interrupting delivery staff to ask for updates a system of record should already hold, which multiplies those interruptions.
Honest sizing: this lever is real but the hardest to measure precisely, because the cost is distributed across everyone in small increments. Resist the universal claim. Use your own audit data from the first section, and frame the recovery as a range. For most 50 to 100 person firms we see, consolidating to one system of record recovers somewhere between 0.3 and 0.7 FTE, with the wider benefit showing up as faster answers rather than a line item.
Choosing that system is its own decision with its own trade-offs, covered in the mid-market PSA buyer’s guide.
Lever 5: smooth the peaks before they arrive
A firm staffed for average demand drowns at peaks and idles in valleys, and the drowning weeks are where quality, margin, and morale all leak at once. Forecasting converts the same total capacity into more delivered work by making collisions visible 6 to 8 weeks out, while there is still time to act.

Operationally, smoothing looks like three habits. Maintain a pipeline-weighted view of demand against capacity, so probable deals cast a shadow on the schedule before they close. Shift project start dates before committing them to clients, not after. And pre-book contractors for known peaks at standard rates instead of panic-subcontracting at rush premiums, which in our experience run 30 to 50% above planned contractor cost.
This lever is last for a reason: it only works after levers 1 through 4 make the underlying data trustworthy. Forecasting on top of spreadsheet allocations and untracked scope produces confident fiction. It is also the lever that compounds. Every quarter of forecast-versus-actual data makes the next quarter’s forecast better.
Keep the math honest here: one avoided rush-subcontract per quarter (say 200 hours at a 40% premium) plus one prevented delivery delay is worth $12,000 to $25,000 a year for the example firm, plus schedule reliability that does not fit in a spreadsheet cell.
The recovery scorecard: proving it worked
Re-run the two-week audit at day 90 and compare it against your baseline. Report the difference in FTE-equivalents and margin, because those are the units the board reads.
| Lever | Typical recovery (example firm) | Speed to value | Prerequisite |
| 1. Automate admin drag | ~0.17 FTE (ops capacity) | 2–4 weeks | Time tracking in place |
| 2. Fix misallocation | 0.5–1.0 FTE (senior capacity) | 1–2 months | Live availability view |
| 3. Cut process waste | 0.5–1.0 FTE (delivery capacity) | 1–3 months | Templates, handoff checklist, change orders |
| 4. Reduce coordination overhead | 0.3–0.7 FTE (distributed) | 2–4 months | Consolidated system of record |
| 5. Smooth demand peaks | $12K–$25K/yr + reliability | 3–6 months | Levers 1–4, trustworthy data |
Ranges reflect what we observe across firms we work with, under conservative assumptions. The levers also stack: recovered senior hours (lever 2) get planned better (lever 5) with less overhead (lever 4). The total observed band is 10 to 20% of delivery capacity, and the worked example above deliberately lands near the low end. Anything higher promised in print would be marketing.
When hiring is the answer. Sometimes it is, and the audit tells you when. Hire when utilization stays above healthy bands even after recovery, when a skill gap exists that no reallocation can close, or when a strategic bet needs muscle the current team does not have. The levers do not replace hiring. They make sure the next hire lands in a system that does not leak a third of their hours on arrival.
What to do next
Run the two-week audit first. Work the five levers in payback order, re-measure at day 90, and hire into a tight system if demand still exceeds capacity. That sequence is defensible in a board deck; “we hired because everyone felt busy” is not.
If you want to instrument the scorecard, our guide to building a PSA performance dashboard covers the metrics each lever moves. And if your audit surfaces the allocation problem, a Birdview demo can walk through the who-is-doing-what view the audit needs, using your own project structure.
FAQ
How can a consulting firm increase capacity without hiring?
Audit where paid hours actually go, then work five levers: automate reporting and invoicing, reassign senior people away from admin, template repeat engagements and capture scope changes, consolidate delivery into one system of record, and forecast demand 6 to 8 weeks ahead. Firms we work with typically recover 10 to 20% of delivery capacity this way.
How much non-billable time is normal in professional services?
The 2026 SPI benchmark put median billable utilization at 66.4% across 509 organizations, with Level 3 maturity firms at 72.5%, so a third of paid hours going non-billable is common. What matters is composition: training and sales time are investments, while manual reporting, status chasing, and rework are recoverable waste. A two-week category audit separates the two.
What is operating leverage in a services business?
Operating leverage is growing revenue faster than headcount, so each added person produces more margin than the last. In services, the first source of leverage is recovery, not hiring: returning paid hours lost to admin, misallocation, and rework. Hiring into a leaky delivery system adds cost at the same leak rate.
When should a services firm hire instead of optimizing?
Hire when the numbers say recovery is exhausted: utilization holds above healthy bands after the five levers, a genuine skill gap blocks work no reallocation can cover, or a strategic bet requires capability the team lacks. Run the recovery cycle first, so the new hire’s hours land on client work instead of inherited waste.
Sources
- SPI Research, 2026 Professional Services Maturity Benchmark (19th annual edition, 509 firms): https://spiresearch.com/reports/2026-ps-maturity-benchmark/
- Gloria Mark, Daniela Gudith, and Ulrich Klocke, The Cost of Interrupted Work: More Speed and Stress, CHI 2008, University of California, Irvine: https://www.ics.uci.edu/~gmark/chi08-mark.pdf