Ksenia Kartamysheva
 A professional services operations team runs the machine underneath every billable project. It turns sold work into staffed work, tracks time and cost, makes sure invoices match the effort, and tells leadership whether the firm is actually making money. Project managers deliver one engagement. Operations makes every engagement possible to deliver by managing the people, hours, budget, and attention they all compete for.
The team sits on a fault line. Sales wants to say yes to every opportunity. Delivery has a fixed number of hours in the week. When those two realities drift apart, the operations team is the one that has to find who is available, how much margin is left, and what to do next.
This guide covers what the team does day to day, the six functions it owns, the maturity stages firms move through, and the metrics that show whether operations is working. For a closer look at the handoff from sales to delivery, see our guide to sales to delivery handoff.
What is professional services operations?
Professional services operations is the management system behind billable work. It is the processes, roles, data, and tools a firm uses to staff projects, deliver them, track time and money, invoice clients, and report on the whole book of business [1].
The scope covers five things:
- Delivery: how work gets set up and run
- Staffing: who gets assigned to it
- Capture: how time and cost are recorded
- Billing: how clients get invoiced
- Visibility: how leadership sees the state of the business
PS operations sits next to three other functions. Sales operations owns the pipeline up to the signed contract. HR owns hiring and compensation. Accounting owns the general ledger. PS operations owns the seams between them, and the seams are where most of the money leaks.
You will also hear this called services operations, delivery operations, or PS ops. They all describe the same discipline.
How is PS operations different from project management?
Project management delivers one project on time and on budget. Professional services operations makes every project possible to deliver by managing what all projects compete for: people, hours, budget, and leadership attention.
A firm can have excellent project managers and still lose money, because no individual PM can see that the firm is 30% overcommitted next quarter or that the blended realization rate has slipped. When a PM escalates that they cannot get the resources they were promised, they are reporting an operations failure, not a project one.
The operations team also owns the repeatables that make projects faster: standard delivery templates, capacity planning, time-capture rules, and monthly portfolio review. A PM owns the client outcome. Operations owns the system that supports every PM.
What processes sit inside professional services operations day to day?
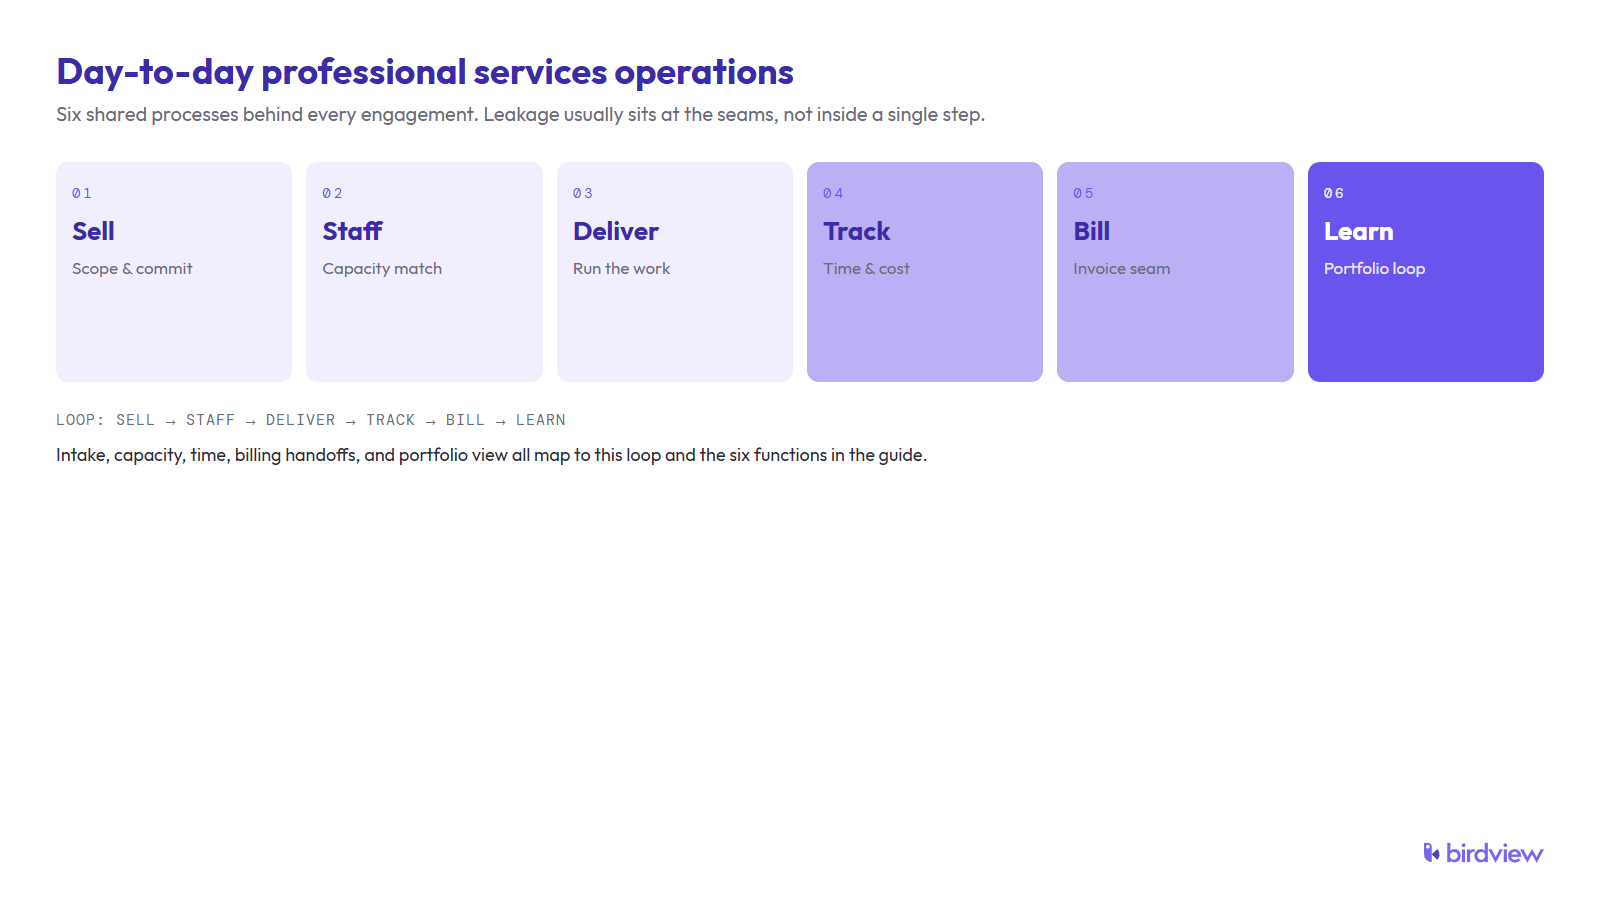
Day to day, professional services operations runs the shared work behind every engagement: intake and staffing, capacity checks, time and cost tracking, billing handoffs, and the portfolio view leaders use to decide what gets done next. Those processes map to the six-node loop (sell → staff → deliver → track → bill → learn) and to the six functions below; the point of naming them together is that most leakage happens when one process stops at a seam.
What does the PS operations loop look like?
Every services firm runs the same six-step loop, whether it is written down or not:
- Sell: a deal is signed and scoped.
- Staff: a named team is assigned with start dates.
- Deliver: the work is performed.
- Track: time and cost are captured against the project.
- Bill: approved time and expenses become invoices.
- Learn: the firm updates forecasts, templates, and pricing.
Most operational pain lives at the seams, not inside the steps. A deal gets sold with a start date that does not match anyone’s availability. Time gets tracked but never billed. A project finishes, but the lessons do not reach the next proposal. Operations teams exist to close those seams.
What are the six functions of professional services operations?
The loop maps to six functions. Each one is a job that someone has to own as the firm grows.
1. Service delivery management
This is how work moves from sold to closed. It includes project setup, delivery standards, milestone tracking, scope control, and client communication. Without a repeatable setup process, every project starts from a blank page and the same questions get answered again and again.
2. Resource planning and capacity management
Resource planning answers the question that sits at the center of every services firm: who is available, and are they the right person for this work? It covers role mapping, skill matching, availability checks, and bench forecasting. For a deeper look at this, see our resource planning guide.
3. Financial operations
This covers budgets, project margin, billing, revenue recognition, and cash collection. Financial operations makes sure the firm knows whether it is profitable before the final invoice goes out.
4. Portfolio and program management
Portfolio management decides what to run, what to stop, and what to delay. Program management coordinates related projects so they do not compete for the same resources or contradict each other’s timelines. PMI frames portfolio governance as an end-to-end process from ideation through delivery [3].
5. Reporting and analytics
Reporting turns the data from the other functions into numbers leadership can act on. The point is not more dashboards; it is fewer, more trusted numbers reviewed on a fixed cadence.
6. Systems and tooling
Operations runs on data, and data needs a home. A PSA (professional services automation) system connects projects, resources, time, billing, and reporting in one record [2]. To understand how this category fits, see our professional services automation guide.
Can PSA software run professional services operations end to end?
PSA software can cover professional services operations end to end when one shared dataset connects projects, resources, time, billing, and reporting: the loop closes without re-keying between tools. It does not replace the discipline; if intake, approvals, and budgets are undefined, a PSA will accelerate the same mess. Use PSA as the system of record for the five delivery functions plus the billing seam, keep HR compensation and the general ledger where they belong, and integrate rather than duplicate. End-to-end here means operational end-to-end (sell-to-cash visibility for delivery), not “one vendor owns the entire company stack.”
Why does operations determine whether growth is profitable?
Revenue growth and profit growth are not the same thing in services. A firm can add clients and headcount while margin shrinks, because every leak in the system scales with the growth:
- unbilled hours that never make it onto an invoice
- idle bench time nobody planned for
- underscoped projects sold below their real cost
- slow invoicing that stretches cash collection
The SPI Research 2026 Professional Services Maturity Benchmark, covering 509 organizations and about $63 billion in PS revenue, found that billable utilization fell to 66.4% in 2025 and only 17.2% of firms hit 100% of their annual margin target [1]. The data shows that selling more does not automatically mean using people better.
What is the PS operations maturity model?
Operational maturity has four stages. The stage a firm sits in determines how fast it can answer three questions: who is available, are we profitable, and what is next.
| Stage | What it looks like | What it can answer |
|---|---|---|
| Improvised | Heroic work, spreadsheets, ad hoc decisions | Very little, and slowly |
| Coordinated | Repeatable templates, defined handoffs, basic reporting | Some questions, but not in real time |
| Integrated | PSA, real-time capacity, connected time and billing | Most questions on demand |
| Predictive | Forecasting, scenario modeling, proactive staffing | What is likely to happen before it does |
Most small firms start at Improvised. The jump to Integrated is the growth project: it is where staffing, time, billing, and reporting live in one system. The move from Integrated to Predictive is where the firm starts using historical data to plan the next quarter, not just report the last one.
Which metrics matter most in PS operations?
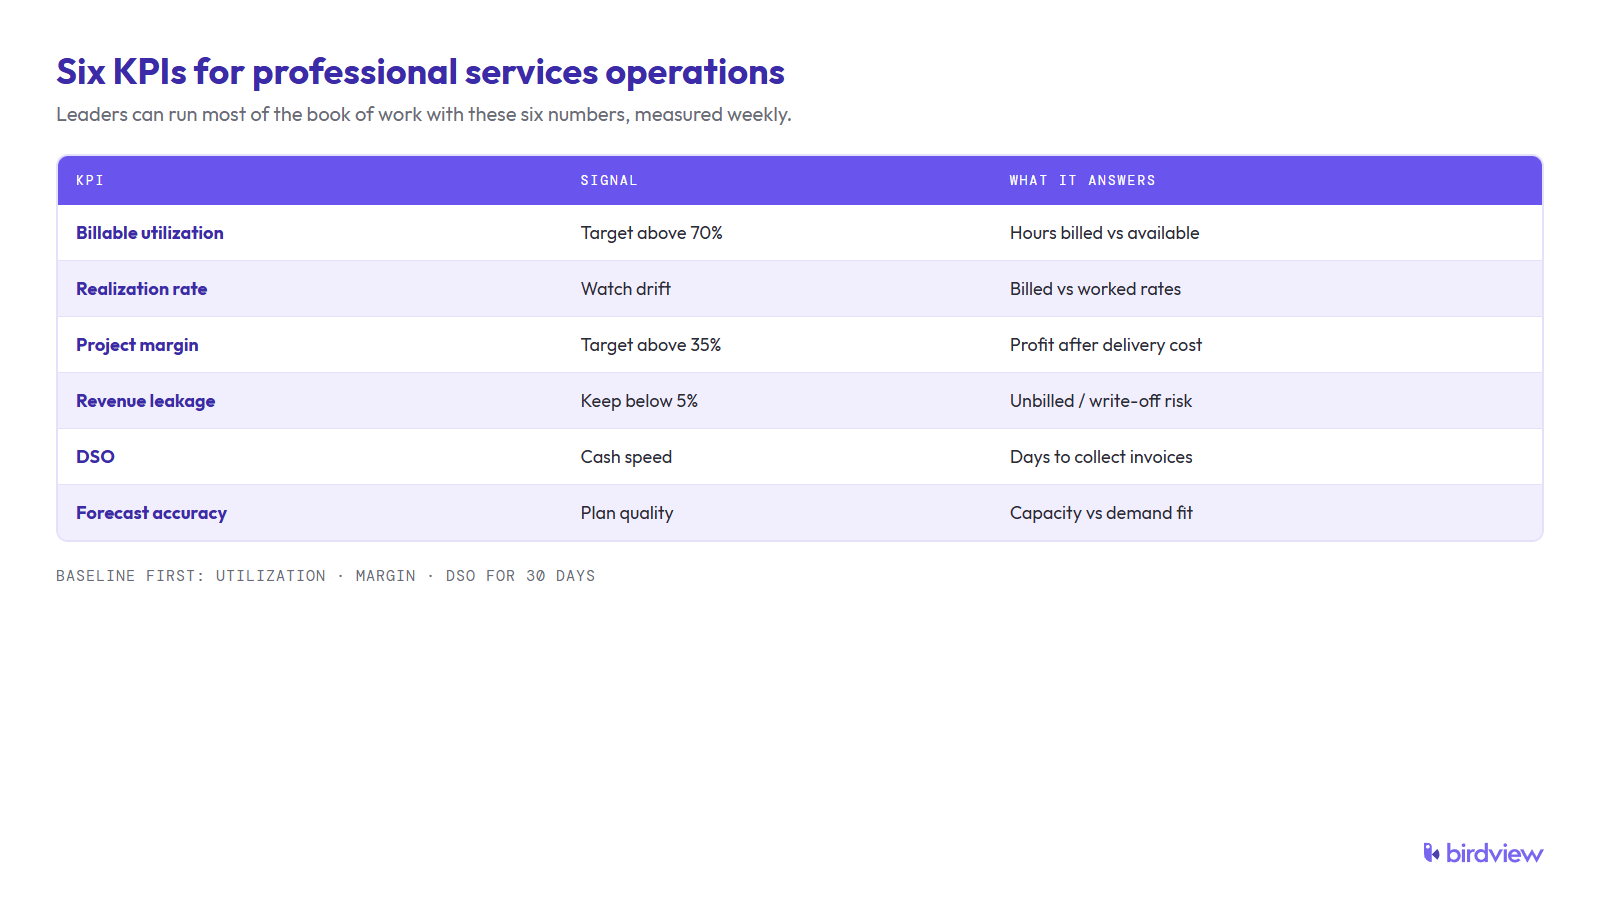
Six metrics cover most operational needs. They answer whether people are productively deployed, whether work turns into cash, and whether plans can be trusted.
| Metric | What it answers | Target |
|---|---|---|
| Billable utilization | Are available hours being billed? | Above 70% |
| Realization rate | Are billed hours being paid? | As high as possible |
| Project margin | Is the project making money? | Above 35% |
| Revenue leakage | Is billable work being missed? | Below 5% |
| DSO | How fast do invoices turn into cash? | As low as possible |
| Forecast accuracy | Are plans matching reality? | Within 10% |
Track a small set consistently rather than a large set sporadically, and review them on a fixed monthly cadence.
Who owns professional services operations?
At small firms, the owner or COO runs PS operations by default. At 30 to 50 people, or the moment resource planning stops fitting in one person’s head, whichever comes first, the firm usually needs a dedicated lead.
Common titles include Director of Professional Services, VP of Operations, or Head of Delivery. The role is part process design, part data management, and part cross-functional negotiation. The owner has to be close enough to projects to see what is breaking and senior enough to stop the loudest project from eating all the resources.
What breaks when PS operations runs on spreadsheets?
Capacity and cost stop being trustworthy. Double-booking hides until it hurts, invoice data gets re-typed, and reporting turns into a multi-day assembly job. The firm then sells and staffs against a plan that is already stale.
Spreadsheets work when the firm is small and one person can hold the whole picture. They break when multiple people need to update the same data, when a change in one project affects others, and when leadership wants the numbers this morning, not next week.
Common failure patterns (and what they cost)
Four failure patterns showed up in our interviews often enough to treat as defaults. Each one has a specific, nameable cost:
- Spreadsheet resource planning (~80% of firms). Costs: invisible double-booking, version conflicts, and a plan that decays within days (nine signs your firm has outgrown Excel). The downstream cost is worse: sales commits against capacity that does not exist.
- A fragmented tool stack (~75% of firms). One co-founder described the end state: “we cannot have one person doing it in Notion, one in HubSpot, and the other in a G-sheet.” Costs: no shared truth, manual re-entry between systems, and a context-switching tax. One head of delivery estimated 15 minutes to get back into flow after each tool jump; at five jumps a day, that is over an hour per person, daily. We quantified this pattern in the real cost of disconnected tools.
- A broken sales-to-delivery handoff (~35% of firms). Costs: projects staffed in panic mode, scope sold that delivery never reviewed, and margin lost before the kickoff meeting. A handoff checklist is the cheapest fix on this list.
- Knowledge held in heads, not systems (~20% of firms). Costs: every departure of a senior PM or the one person who “knows the spreadsheet” becomes an operational incident.
Where should a COO start with a professional services operations guide?
A COO should start by measuring three numbers and mapping one loop, not by buying software. Pick utilization, project margin, and DSO (or your closest equivalents), measure them for 30 days with whatever tools you already have, and draw the six-node loop with every handoff that still moves by spreadsheet or chat. That baseline turns this guide into a decision tool: name your maturity stage, pick the seam with the fastest cash payback (often Track → Bill), and only then evaluate PSA against a defined process. The 90-day sequence below is the same path written as a calendar; use it as the COO’s first-quarter operating plan for delivery.
How can a firm improve PS operations in 90 days?
A 90-day starting sequence gives the team focus without trying to fix everything at once:
- Week 1–2: map the current loop from sold to billed. Mark the seams where work stops.
- Week 3–4: define the small set of metrics and the monthly review cadence.
- Week 5–8: fix the highest-leakage handoff, usually from time tracking to invoicing or from sales to staffing.
- Week 9–12: document the new process and repeat it before adding more tooling.
Fix process before tooling. Buying a PSA to automate a process that is not defined usually wastes the tool and the implementation budget. The goal is a system that the team actually uses, not a system the vendor demoed.
The loop, not a department
Professional services operations is not a department; it is the loop your firm runs whether anyone manages it or not: sell, staff, deliver, track, bill, learn. Maturity is measured by how fast you can answer three questions with numbers instead of instinct: who is available, are we profitable, what is next. The 2026 industry data says most firms cannot, which is also the opportunity, because the gap between average and high-performing firms is operational, not strategic.
FAQ
What is the difference between professional services operations and PSA?
Professional services operations is the discipline: the processes, roles, and metrics for running billable work. PSA is a software category that supports the discipline by putting projects, resources, time, and billing in one system. A firm can run operations without a PSA, and owning a PSA does not by itself produce good operations.
How is professional services operations different from project management?
Project management delivers one project on time and on budget. Professional services operations makes every project possible to deliver by managing the shared resources, hours, and budgets that projects compete for.
What does a professional services operations manager do?
They own the system all projects share: the resource plan, delivery standards and templates, time and billing processes, and management reporting. Day to day, they resolve staffing conflicts, watch utilization, and run the monthly portfolio review.
What is a good utilization rate for a professional services firm?
There is no single target, because it varies by role and business model. SPI Research uses above 70% as a common reference point for healthy professional services utilization [1].
What KPIs should a professional services firm track?
Start with billable utilization, realization rate, project margin, revenue leakage, DSO, and forecast accuracy. Track fewer consistently rather than more occasionally.
What does a complete professional services operations guide cover?
A complete guide covers the definition of PS operations, how it differs from project management, the day-to-day loop and six functions, maturity stages, the KPIs leaders watch, ownership by firm size, common failure patterns (including spreadsheets), where PSA fits across the full delivery loop, and a practical 90-day starting sequence for a COO or head of delivery.
What breaks when professional services operations run on spreadsheets?
Capacity and cost stop being trustworthy. Double-booking, re-typed invoice data, and stale reports are the usual symptoms.
Can PSA software run professional services operations from start to finish?
Yes for the delivery loop, when one system of record connects projects, resources, time, billing, and reporting. No if “the whole company” means skipping process design, or forcing HR and the general ledger into the PSA.
Where should a COO start with a professional services operations guide?
Start with a 30-day baseline of three metrics and a map of the sell-to-learn loop, then fix one seam before tooling. The guide’s maturity model and 90-day sequence are the COO’s agenda, not a feature checklist for vendors.
How do you build professional services operations for a growing services firm?
Build the loop on purpose as headcount grows: standardize delivery templates, make capacity visible across every project, connect time entry to invoices, and add portfolio prioritization before politics staffs the loudest project.
When should a services firm hire a dedicated operations lead?
The common trigger is 30 to 50 people, or the moment resource planning stops fitting in one person’s head, whichever comes first. Warning signs: double-bookings after the fact, invoicing that takes days, and nobody able to say which projects are profitable.
Sources
- SPI Research, 2026 Professional Services Maturity Benchmark (19th annual edition, 509 firms), 2026. https://spiresearch.com/reports/2026-ps-maturity-benchmark/
- The RevOps Guide, “Professional Services Operations – Arm 6,” 2025. https://therevopsguide.com/professional-services/
- Project Management Institute, “Governance of Innovation,” PMI.org. https://www.pmi.org/learning/library/governance-innovation-projects-programs-portfolios-11796