Ksenia Kartamysheva
 - Many consulting firms discover project profitability issues only after a project closes because time entries, indirect costs, and financial data are not updated in real time.
- Billing-cycle delays, batch cost allocation, subcontractor invoices, and spreadsheet-based reporting create a profitability blind spot that hides margin erosion during project delivery.
- Improving profitability visibility starts with operational changes such as same-day time entry, committed-cost tracking, and regular margin reviews–not necessarily replacing every existing tool.
- As consulting firms grow, connecting project management, resource planning, time tracking, and financial data becomes essential for identifying budget overruns before they impact project profitability.
- Real-time project financial visibility enables project managers and finance teams to make proactive decisions, reduce revenue leakage, and protect project margins throughout the delivery lifecycle.
Real-time project financial visibility means margin and cost data that updates as work is logged – not after invoices close. Most professional services firms simply don’t have it, so they steer by numbers that are days or weeks out of date. That gap between work performed and financial awareness is not a minor inconvenience. It is the mechanism by which profitable-looking projects quietly become money-losers.
Consider a 12-person strategy consulting team running a 10-week engagement. The project felt on track throughout. Scope conversations were manageable, the client was happy, and no one raised a red flag. Then the invoice went out. Post-close reconciliation revealed that senior consultants had logged far more hours than the original budget allowed. Those hours were never flagged, never discussed with the client, and never recovered. The margin that looked healthy at week six had already collapsed at week three. No one knew because no one could see it in time.
Project margin visibility is the ability to read gross margin at the task or phase level before a project closes – not as a post-mortem. Without it, budget overruns compound silently across every active engagement.
This article explains exactly why that happens – and what it costs when it keeps happening. SPI Research’s 2026 Professional Services Maturity Benchmark, covering 509 organizations and about $63 billion in PS revenue, found that only 17.2% of professional services firms hit 100% of their annual margin target, and industry-wide project overrun sat at 10.7% in 2025 [1].
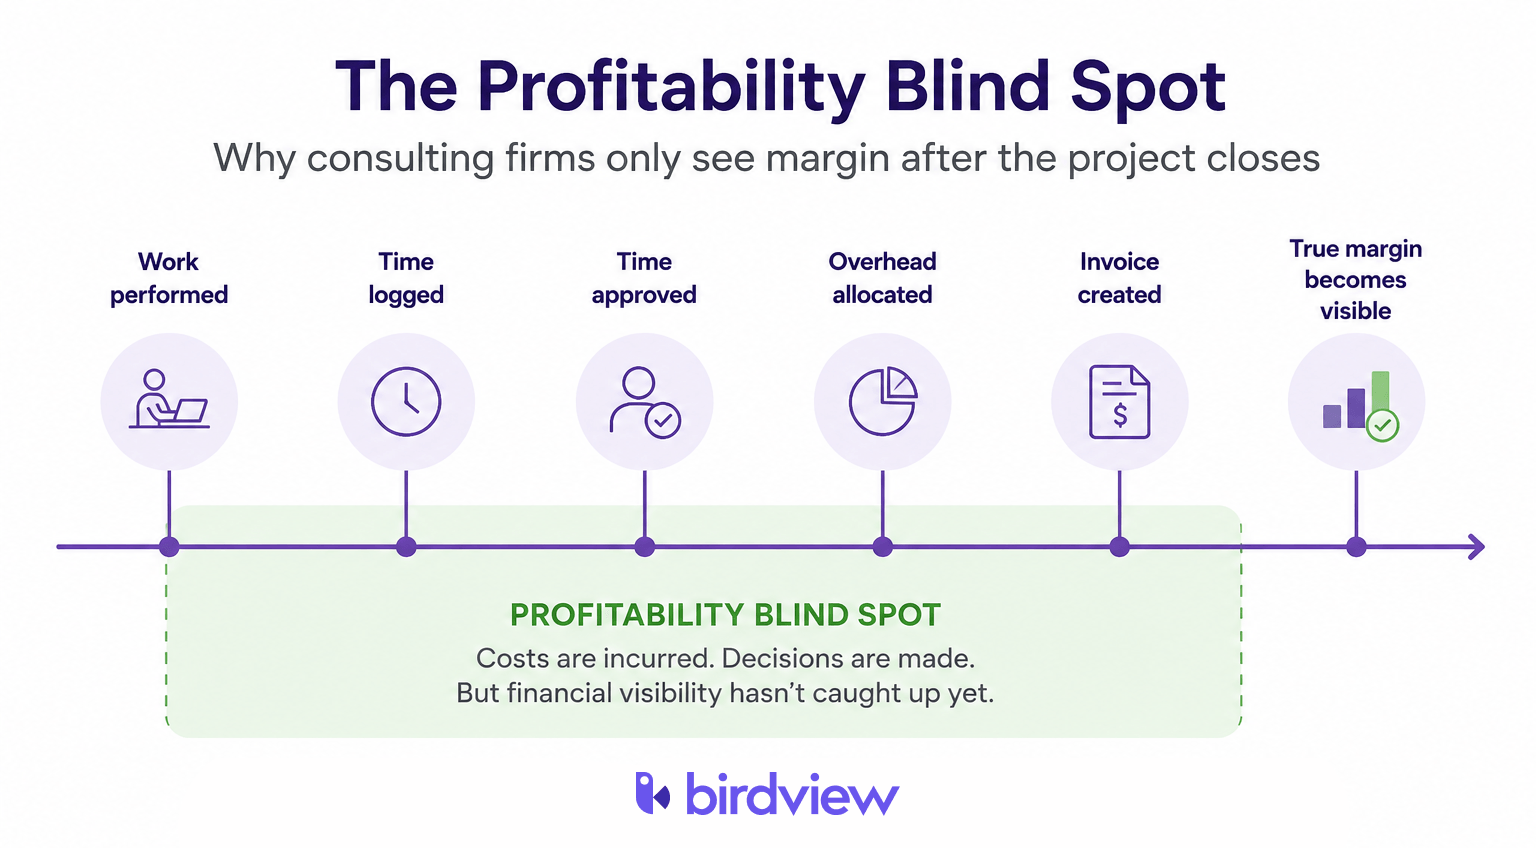
The billing-cycle lag: How time entries arrive too late to act on
The first failure point is not that consultants fail to log time. It is that logged time takes too long to reach the people who need to act on it. Firms at lower maturity levels routinely finalize time entries several business days after a work week closes, rather than same-day. By the time a project manager sees a senior consultant burned 22 hours on a task budgeted for 12, next week’s work is already underway.
The tool stack makes this worse. A typical 20-to-80-person consulting firm runs on three disconnected systems. Harvest or Toggl Track captures time entries. A project manager exports that data into Google Sheets to compare against the budget. QuickBooks handles invoicing and cost recording. Each handoff between those three systems is manual. Each manual step introduces delay.
Harvest stores time data in its own silo, disconnected from the project budget it is supposed to inform. Toggl Track has no native cost-allocation layer – it reports hours, not margin. Google Sheets becomes the de facto financial dashboard, rebuilt from scratch each week by whoever holds the most recent export.
The result: a project manager reviewing a budget tracker on Thursday is looking at data from the previous Tuesday. That data has been filtered through a manual export and entered into a spreadsheet that may not reflect the latest scope change. That is not visibility. That is archaeology.
Where firms go wrong. The billing cycle runs weekly at best. Time-entry finalization lags by several business days on average. On a 10-week engagement, that leaves at most eight meaningful checkpoints – and several arrive too late to redirect spending.
Billing-cycle lag is the gap between when billable work is performed and when it appears as a finalized cost in the project’s budget tracker. In most mid-market consulting firms, this lag runs several business days. If you are building this from scratch, start with how services operations are run.
Batch cost allocation: Why overhead hits projects weeks after the work happens
Time entry lag is only half the problem. The other half is indirect costs – overhead, shared services, facilities, benefits – which are not allocated to projects in real time. With monthly allocation, a project closing in week eight of a ten-week engagement is still waiting on its overhead batch. The accurate fully-loaded cost per project arrives only after the final invoice.
Batch allocation is applying indirect costs to projects in periodic lump sums rather than as costs accrue. Overhead reservation is committing overhead against a project budget at the time work begins, not at month-end.
Why this matters for live margin: overhead arriving as a month-end batch leaves the direct-labor budget number structurally incomplete. A project showing 22% gross margin in week six can land at 14% fully loaded once that batch runs. That is an 8-point swing – below most firms’ minimum threshold. The window to renegotiate scope, cut hours, or flag the client closes before the data arrives.
The subcontractor invoice lag compounds this problem. A consulting firm engages a subcontractor – a freelance researcher, a specialist, a design partner – who invoices on Net-30 terms. The work happens in week two. The invoice arrives in week six. The cost hits the project’s books in week seven, after the firm has already invoiced the client. On a $180,000 project, a $40,000 subcontractor engagement shifts margin from 18% to under 4%. The project team had no mechanism to see that shift coming. The cost was never reserved against the project budget at the point of engagement.
Where firms go wrong: They treat subcontractor costs as accounts-payable events rather than budget commitments. The fix is a policy change, not a software purchase. Firms that reserve subcontractor costs at the point of commitment – not at invoice receipt – eliminate this failure mode entirely. The cost is visible from day one of the engagement, and the margin number reflects reality throughout the project lifecycle.
Spreadsheet reporting: Where margin numbers get rebuilt by hand
Even when time data and cost data eventually arrive, the reporting layer introduces its own errors. Spreadsheet-risk research collected by the European Spreadsheet Risks Interest Group, building on Raymond Panko’s audit studies, finds errors in the majority (>90%) of spreadsheets [2]. In project reporting, those errors cluster around the manual steps. Copy-paste from a time tool export. Formula references that break when rows are added. Conditional formatting that marks a budget cell green from a formula that stopped updating two weeks ago.
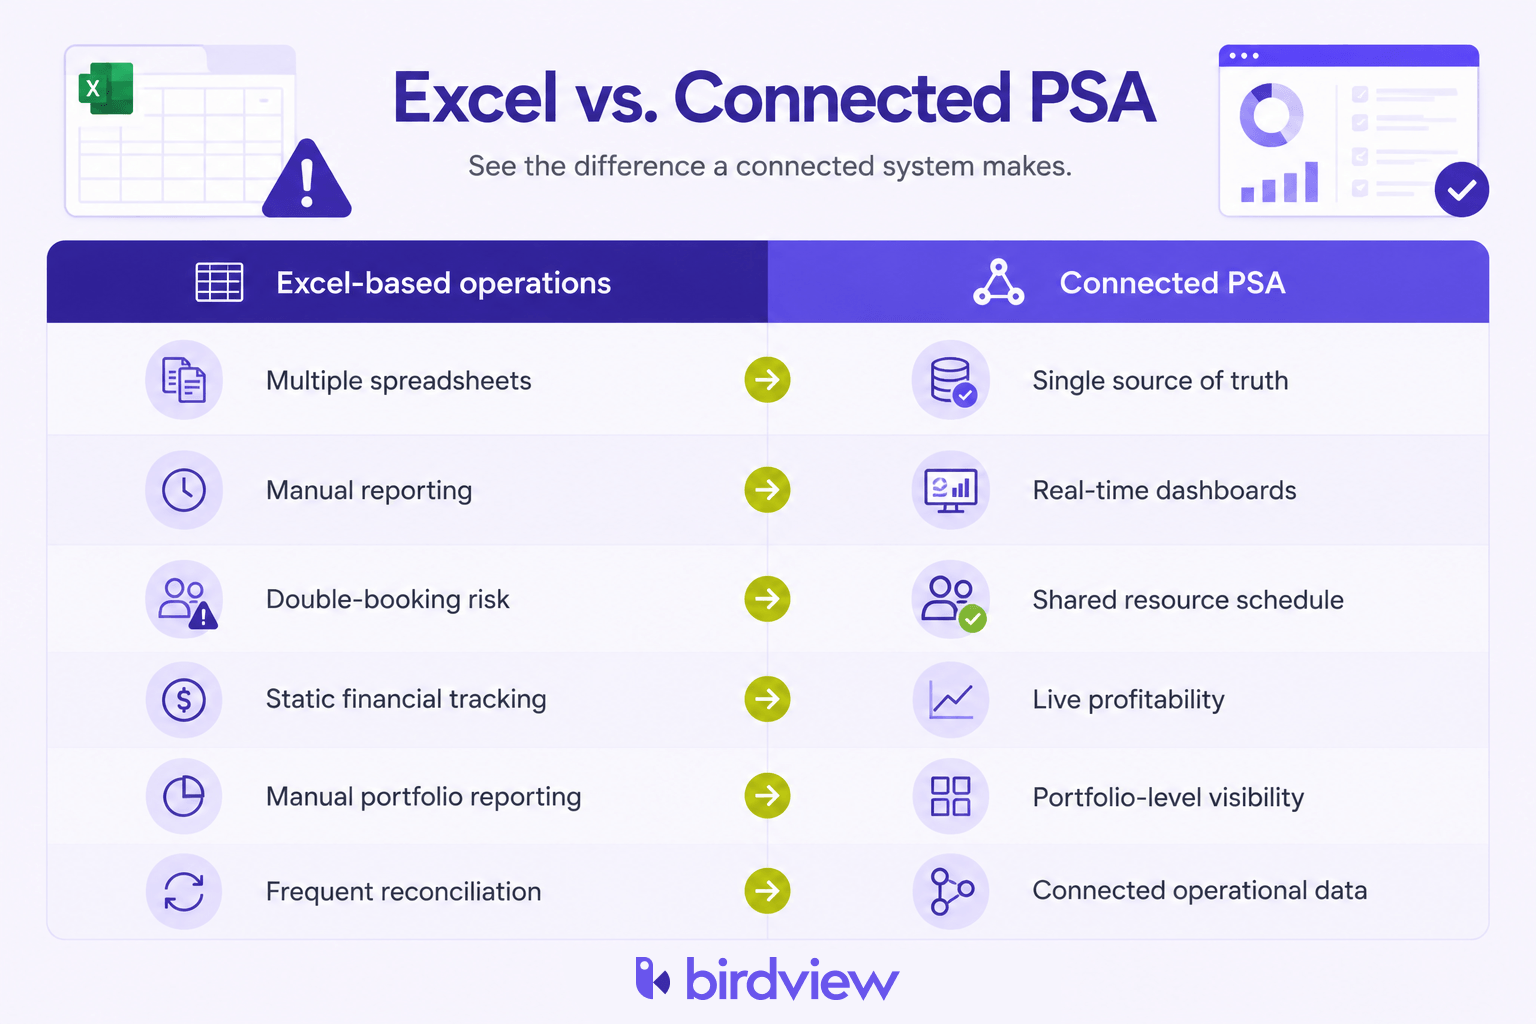
Spreadsheet reporting is the practice of rebuilding financial data by hand across disconnected systems – exporting, pasting, mapping, reconciling. The alternative is reading it from a live source. That distinction matters: each manual step is a point where margin data can silently diverge from reality.
The typical workflow at a mid-market consulting firm looks like this. A project manager exports a CSV from Toggl Track or Harvest and pastes it into a master budget tracker in Google Sheets. They manually map labor categories to budget line items, then share a screenshot or PDF with the finance director. The finance director then reconciles that against QuickBooks at month-end. The gap between those two data sets – the spreadsheet version and the accounting version – is where margin goes missing.
The green cell problem. Ask any delivery lead who has run a Friday reconciliation: the tracker earns trust because it has been right before. A cell showing 68% budget consumed at week five of a ten-week project reads as healthy. What the cell does not show: the formula pulling hours from the export tab has not refreshed since Tuesday. Two senior consultants logged weekend hours that are not exported yet. A $15,000 subcontractor cost is missing because the invoice has not arrived. The cell is green. The project is not.
Where firms go wrong. The error is structural, not individual. Rebuilding financial data by hand across Harvest, Google Sheets, and QuickBooks creates three separate versions of the truth. Each is accurate at a different point in time. By the time all three align at month-end, the window to act on a margin problem has closed. The spreadsheet is not a live instrument. It is a snapshot that ages the moment it is saved.
What changes when margin becomes a live number
One factor separates firms that catch overruns early from those that discover them post-invoice: whether cost data flows automatically or manually. Deltek’s 2026 PSO Benchmark, drawing on SPI’s maturity research, found industry-wide project overrun improved slightly to 10.7% in 2025. The same report found firms running a project-based ERP that unifies delivery with core financials see 20% faster year-over-year revenue growth and 10.2% EBITDA, against 8.6% for firms without one – and only 38.7% of firms have made that jump [3].
What is a PSA platform? It is an integrated system connecting time entry, resource planning, cost allocation, and financial reporting in one data model. It eliminates the manual handoffs that delay margin visibility.
Birdview PSA, built for mid-market professional services firms in the 20–200 user range, applies overhead rates and project budgets as hours are logged. A delivery lead opening the dashboard on Thursday morning sees Thursday morning’s numbers – not last week’s export. Kantata serves a similar role for larger enterprise PSA buyers. Its implementation curve is longer, and most sub-100-person firms cannot absorb it.
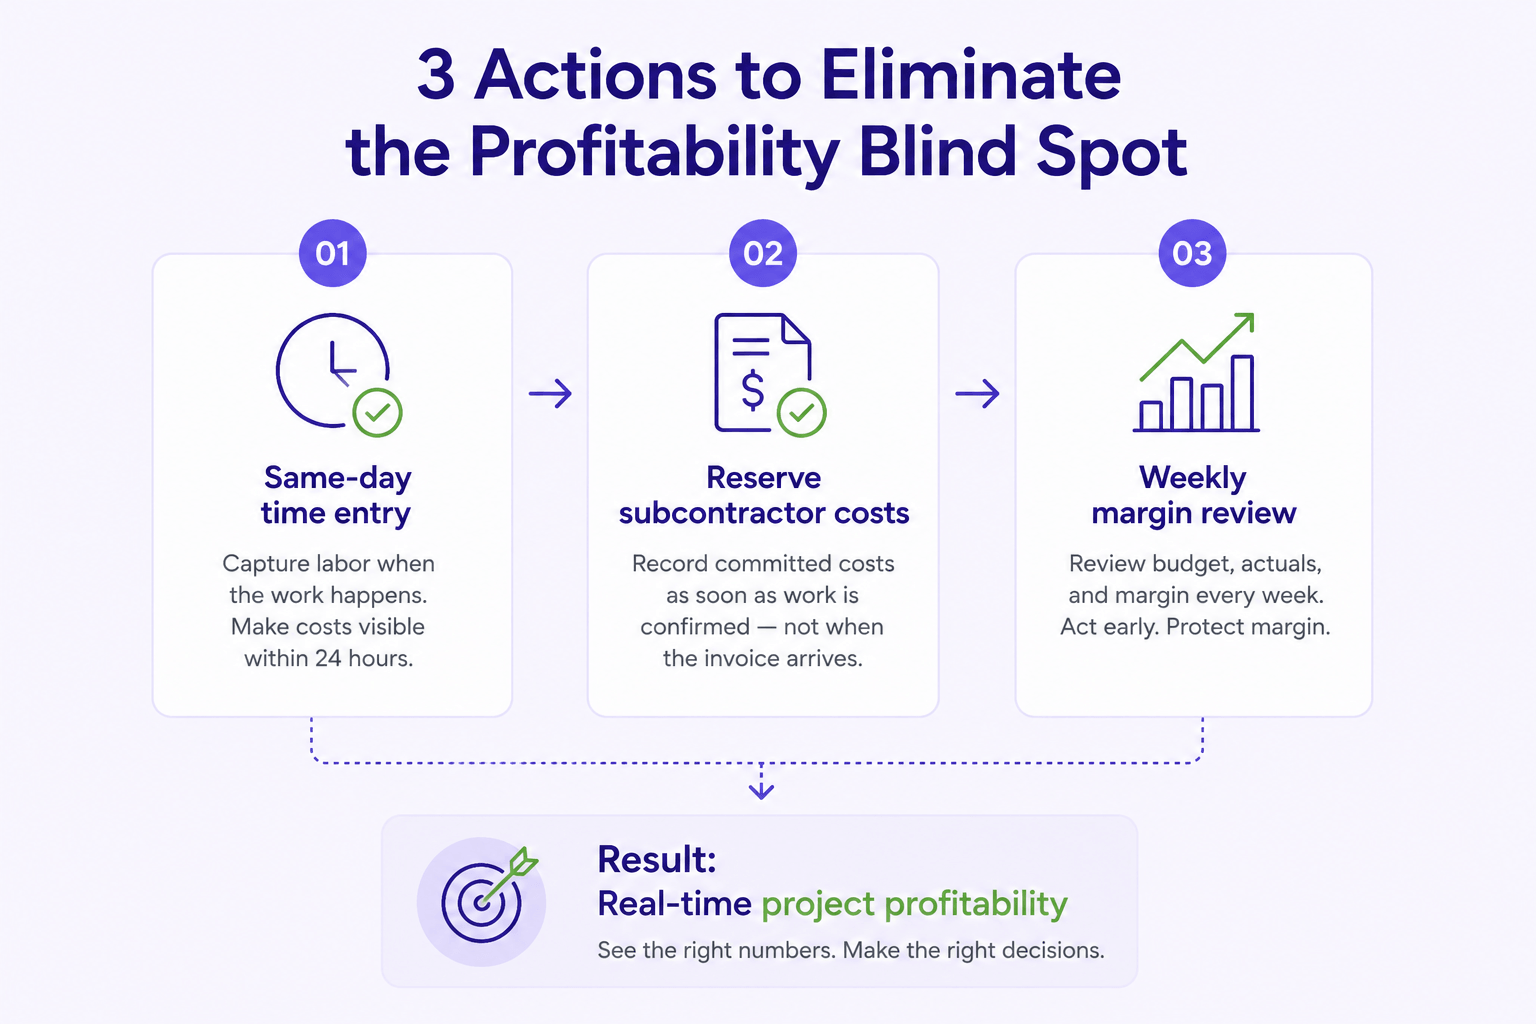
Three operational interventions that do not require replacing every tool:
- Weekly margin review cadence. Schedule a 30-minute review every Friday. The project lead, finance contact, and delivery lead examine actual-vs-budget on hours and costs. This forces time entry to be current before the meeting.
- Reserved subcontractor costs at commitment. When a subcontractor is engaged, enter the expected cost against the project immediately – before the invoice arrives. The project budget then reflects an accurate cost picture from day one of the subcontractor’s work.
- Same-day time entry policy. Require consultants to log hours the day the work occurs, not at week-end. Firms at higher maturity levels treat same-day or next-day entry as standard operating procedure, which cuts the finalization lag from several business days to under 24 hours.
None of these interventions require a six-figure software implementation. They require a decision: real-time margin visibility is an operational priority, not a secondary concern.
Why this works
Each intervention targets a specific delay in the cost data chain. Same-day time entry eliminates the logging lag. Committed subcontractor costs close the invoice-arrival gap. Weekly margin reviews create a forcing function – data must be current or the meeting has no value. Together, the three close the window between when cost is incurred and when leadership sees it. That window is where overruns hide.
FAQ
Why do profitable firms still miss project-level margin until close?
Firm-level and project-level profitability are measured on different schedules. A firm can be profitable overall – strong projects offset weak ones – while individual project margins stay invisible until post-close reconciliation. Overhead allocation, subcontractor invoices, and time entry finalization each run on separate cycles. None of those cycles align with the project’s delivery timeline. Profitable firms miss project-level margin because their financial systems were designed to report on the firm, not on individual engagements.
How fast should a consulting firm see project costs after work is logged?
The target is 24 hours or less for direct labor costs. When a consultant logs time, that entry should appear in the project’s cost ledger by the next business morning. Overhead allocation can run weekly rather than monthly without a system overhaul – most accounting platforms support weekly allocation runs. Subcontractor costs should appear as committed expenses the day the engagement is confirmed. The actual invoice is then reconciled against that reservation when it arrives.
Does better time tracking alone fix profitability visibility?
No. Time tracking tools – Harvest and Toggl Track are common examples – solve the data-capture problem. They do not solve the cost-allocation problem or the reporting-integration problem. A firm can have 100% time entry compliance and still have zero real-time margin visibility. That happens when logged hours are not connected to a cost rate, an overhead allocation, and a project budget inside the same system. Time tracking is a necessary input, not a sufficient solution.
When is a PSA worth it versus spreadsheets plus a PM tool?
Many firms begin experiencing these challenges between 20 and 50 billable staff, although the real tipping point depends more on project complexity and the number of concurrent engagements than headcount alone. Below that threshold, a disciplined spreadsheet process – weekly reconciliation, same-day time entry – can approximate real-time visibility at low cost. Above it, manual reconciliation grows faster than headcount. Each new project adds another export, another tab, another opportunity for the green cell problem to hide a margin issue. At that scale, an integrated PSA pays for itself by narrowing that overrun gap [3].
What is a profitability blind spot?
It is the window between the moment costs are incurred on a project and the moment those costs become visible in margin reporting. Inside that window a project can drift from profitable to loss-making without anyone noticing. The blind spot is created by billing-cycle lag, batch overhead allocation, delayed subcontractor invoices, and manually rebuilt dashboards rather than by any single tool.
What should a firm fix first to shorten the blind spot?
Direct labor is the highest-leverage fix. Getting logged time to land in the project cost ledger within 24 hours removes the largest and most volatile share of the lag. Weekly overhead allocation and committed-cost entries for subcontractors come next. Most firms can shrink the blind spot from weeks to days before making any platform decision.
The cost of waiting until close
The profitability blind spot is not a strategy problem. Firms that lose margin on projects are not failing to set the right rates or hire the right people. They are failing to see cost data fast enough to act on it. That is a data-latency and systems-integration problem with specific, addressable causes. The metrics that matter – gross margin by phase, overrun rate, unbilled-hours leakage – already exist inside the firm’s own tools. They just arrive too late to act on.
The billing-cycle lag, the batch overhead allocation, the subcontractor invoice timing, and the hand-rebuilt spreadsheet dashboard are each manageable in isolation. Together, they create a reporting environment where true project margin is unknowable until after the invoice goes out and the client relationship has moved on.
The commercial stakes are concrete. Consider a 40-person consulting firm billing $6 million annually and targeting a 20% margin. SPI Research’s 2026 benchmark found just 17.2% of professional services firms hit 100% of their annual margin target [1]. A five-point miss against that target, the kind that hides inside the delay stack described above, is $300,000 in profit that never shows up – on a firm that looks busy and well-reviewed the entire time. That is not a rounding error. It is a hiring decision, a technology investment, or two years of profit growth, sitting in time and cost data that arrived too late to act on.
The fix is structural: real-time margin visibility for consulting firms.
Where firms go wrong: they treat margin as a reporting output rather than an operational input. Margin calculated on the last day of the month cannot change decisions made on day three of a six-week engagement. Margin visible on Wednesday can.
The fix is a systems decision, not a staffing one. Firms that close this gap connect time-tracking, project accounting, and overhead allocation into a single data flow. Project managers then see live cost exposure, not last month’s summary. That shift turns margin from a post-mortem number into a management tool.
Sources
[1] SPI Research, 2026 Professional Services Maturity Benchmark (19th annual edition, 509 organizations, ~$63B in PS revenue) – https://www.rocketlane.com/blogs/professional-services-maturity-index-2026
[2] EuSpRIG – European Spreadsheet Risks Interest Group, spreadsheet error research (Panko error-rate studies) – https://eusprig.org/research-info/research-and-best-practice/
[3] Deltek, 2026 PSO Benchmarks: Insights from the SPI Maturity Benchmark Report (project overrun, ERP integration, revenue and EBITDA figures) – https://www.deltek.com/resources/articles/professional-services-benchmarks/