Ksenia Kartamysheva
 - Revenue forecasts in professional services miss for four structural reasons: pipeline counted as revenue, invisible capacity constraints, stale project data, and disconnected systems.
- A forecast miss falls almost entirely on profit because payroll is fixed. At a 10% margin, a 15% revenue miss turns a profitable month into a loss.
- Only 17.2% of firms hit 100% of their annual margin target, and billable utilization fell to a historic low of 66.4% (2026 SPI Research and Rocketlane benchmark).
- Capacity is the most commonly skipped forecast input. Checking role-level availability at deal close prevents more misses than any modeling change.
- Accuracy improves fastest by shortening the update cycle: weekly input reviews and a capacity gate beat a more complex model.
Revenue forecasting in professional services means estimating future revenue from four connected inputs: pipeline, active projects, team capacity, and billing terms. Most forecasts miss not because of bad math, but because these inputs live in separate systems. In services, revenue follows delivery, not sales. A firm can close every deal in its pipeline and still miss the quarter if projects slip or the team is overbooked.
This article focuses on accuracy: what makes revenue forecasts miss, what a miss actually costs a consulting firm, and how to build a forecast that holds. For forecasting models and cash flow mechanics, see our guide to financial forecasting for service businesses.
What causes inaccurate revenue forecasts in consulting firms?
Revenue forecasts miss for four recurring reasons: pipeline treated as revenue, invisible capacity constraints, stale project data, and disconnected systems. In discovery calls Birdview ran with more than 40 professional services firms between March 2025 and March 2026, about 80% still planned resources in spreadsheets, and roughly 60% said they could not forecast resource demand at all.
Pipeline is treated as revenue. A signed deal is demand, not revenue. Work still needs to be staffed, delivered, approved, and billed. Forecasts built only on CRM data assume revenue lands shortly after close. In practice, kickoff delays and approval cycles push it out by weeks.
Capacity constraints are invisible. If the one senior architect a project needs is already at 95% utilization, that project starts late no matter what the CRM says. “I see 10 opportunities. I don’t know who’s available,” is how a director of professional services at an IT consulting firm described it to us. When the forecast never checks staffing, misses are built in at deal close.
Project data goes stale. T&M revenue depends on time entries. Fixed-fee revenue depends on milestone dates. When timesheets land a week late and project plans are updated monthly, the forecast describes last month, not next month. An engineering director at a defense contractor summed up his spreadsheet forecast: “By the time you’re done with it, it’s changed four times.”
Systems don’t talk to each other. Pipeline sits in the CRM, delivery in a project tool, actuals in accounting. Each shows a different version of the truth, and the forecast becomes a manual reconciliation exercise. The output is outdated the day it is distributed.
How much does an inaccurate revenue forecast cost?
An inaccurate forecast costs a services firm in three ways: margin erosion from fixed payroll, expired billable hours, and bad hiring decisions. Because delivery costs are mostly salaries, a revenue miss falls almost entirely on profit.
The math is unforgiving. A firm forecasting $500K in monthly revenue at a 10% margin plans for $50K profit. A 15% revenue miss is a $75K gap. Payroll does not shrink with the miss, so the month swings from $50K profit to a $25K loss. The forecast error did not just reduce profit. It erased it and kept going.
Idle capacity compounds this, because billable hours expire. One consultant benched for a month at a $150 rate and 120 planned billable hours is $18,000 of revenue that cannot be recovered later. The industry backdrop makes this risk worse: the 2026 Professional Services Maturity Benchmark from SPI Research and Rocketlane (509 firms surveyed) found billable utilization fell to 66.4% in 2025, the lowest level in the benchmark’s history.
The same benchmark shows how rare accuracy is: only 17.2% of firms hit 100% of their annual margin target. Firms that miss forecasts repeatedly also make slower, worse structural decisions. They hire too late and burn out the team, or hire too early and carry bench costs. Both outcomes trace back to not trusting the forward numbers.
How to build a revenue forecast that holds
An accurate forecast is built in five passes: weighted pipeline, time-phased projects, a capacity check, billing terms, and confidence tiers. The order matters, because each pass corrects the errors of the previous one.
Step 1: Weight the pipeline
Pull open deals from the CRM with value, probability, close date, and expected start date. Weight each deal by probability, so an 80% deal contributes 80% of its value. Leave deals below 30% out of the base forecast. Add a realistic start lag between signature and kickoff, because almost no project starts the week the contract is signed.
Step 2: Spread project revenue over time
Convert deals and active projects into monthly revenue lines based on delivery plans, not contract totals. T&M spreads by planned hours times rates. Fixed fee follows milestones. Retainers spread evenly.
| Project | Total value | Duration | Monthly revenue |
|---|---|---|---|
| Client A (T&M) | $60,000 | 4 months | $15,000/month |
| Client B (fixed fee) | $90,000 | 3 months | $30,000 at M2 and M3 milestones |
| Client C (retainer) | $24,000 | 12 months | $2,000/month |
| Total, month 1 | $17,000 | ||
| Total, month 2 | $47,000 | ||
| Total, month 3 | $47,000 |
Project-level mapping also exposes concentration risk. If one engagement carries 40% of next quarter’s forecast, a single delay changes the whole outlook.
Step 3: Check capacity before committing
Compare the hours each forecasted project needs, by role, against real availability. If a project needs 120 hours a month from a consultant already at 90% utilization, the revenue line is fiction until staffing changes. In our discovery-call corpus, resource constraints were the single most common reason firms named for missed forecasts.
Step 4: Apply billing terms
Revenue timing follows billing terms, not contract value. A project finishing in March with net 60 terms produces cash in May. Decide whether you are forecasting recognized revenue or cash, and apply the matching rules. For the cash flow side, the financial forecasting guide covers this in depth.
Step 5: Tag every line with a confidence level
Signed and staffed work is high confidence. Late-stage deals are medium. Early pipeline stays in a separate view. This gives leadership two numbers, an expected forecast and a risk-adjusted one, and makes the gap between them a visible management signal instead of a surprise.
How to fix forecast accuracy in 90 days
Forecast accuracy improves fastest by shortening the update cycle and adding a capacity gate, not by building a more complex model. A practical 90-day sequence for an operations or delivery leader:
Weeks 1 to 4: fix the inputs. Enforce a weekly timesheet deadline with approval. Update every active project’s remaining work and milestone dates once. Clean CRM close dates and probabilities. Bad inputs are the most common cause of misses, and this step alone usually exposes where the current forecast is wrong.
Weeks 5 to 8: add the capacity gate. Before any deal is committed to a start date, check role-level availability. Track billable utilization weekly. Most firms target 70% to 80%; if you are planning staffing at 100%, the deficit is built into the plan.
Weeks 9 to 12: move to a weekly rolling review. Replace the monthly rebuild with a 30-minute weekly review of changed deals, slipped milestones, and utilization. Compare last month’s forecast to actuals and record the variance. Firms that measure their own forecast error are the ones that reduce it.
Where PSA software fits
A PSA platform improves forecast accuracy by holding pipeline, projects, capacity, and billing in one system, so the forecast updates from live delivery data instead of exports. The mechanism matters more than the label. In Birdview, for example, expected revenue combines active backlog with probability-weighted pipeline, and the planning view flags a resource who passes 100% allocation before the project is committed. Time entries and milestones feed the same revenue lines the forecast reads.
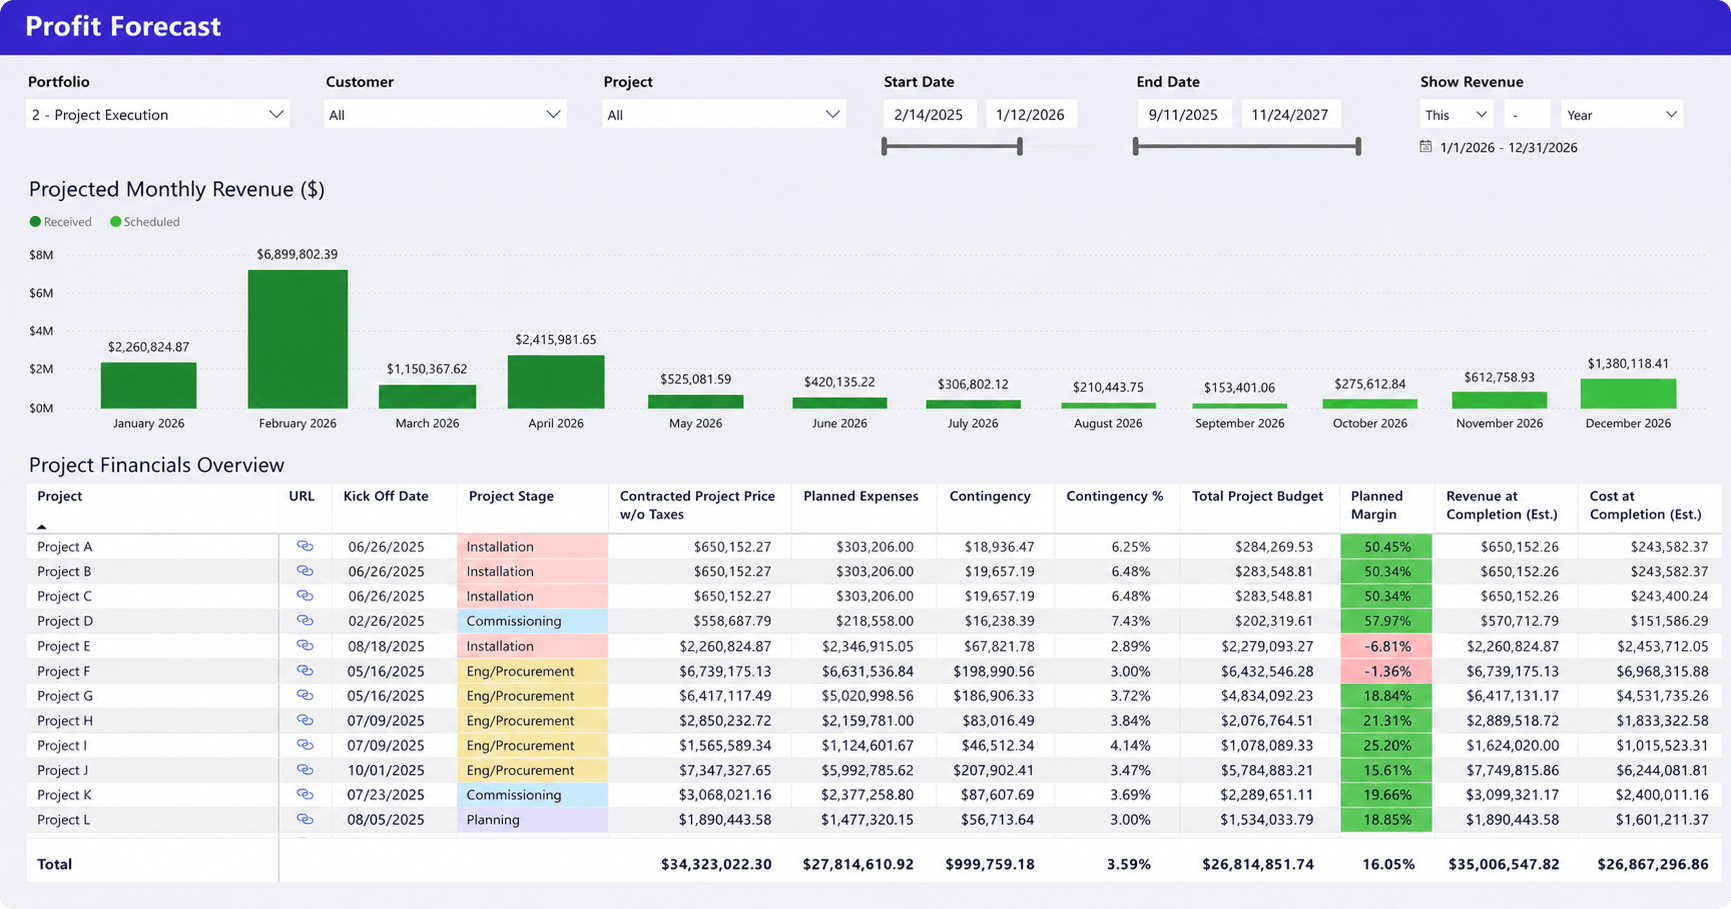
The before and after pattern is consistent across implementations we run. One composite example from a 60-person IT consulting firm running 15 to 20 concurrent projects:
| Before | After | |
|---|---|---|
| Forecast source | Manual Excel from exports | Live data in one system |
| Update frequency | Monthly, when someone had time | Weekly, without rebuilding |
| Capacity check | After project start | At deal close |
| Prep time | 3 days per month | A few hours |
The forecast numbers did not change much at first. Confidence in them did, and hiring and commitment decisions started happening weeks earlier.
FAQ
Why do our quarterly revenue forecasts keep missing by 15 to 20%?
Recurring misses of that size usually come from structural gaps, not one-off events. The most common are pipeline counted as revenue without a start lag, no capacity check before commitments, and project data updated monthly instead of weekly. Comparing forecast to actuals for two or three past quarters typically shows which of the three dominates.
How much does inaccurate forecasting cost a mid-sized consulting firm?
The cost scales with payroll rigidity. At a 10% margin, a revenue miss larger than the margin turns the period unprofitable, since salaries do not flex with the miss. Add expired billable hours (a benched consultant at a $150 rate loses roughly $18K per idle month) and delayed hiring decisions, and repeated misses compound quickly.
What data do you need for an accurate revenue forecast?
Four inputs: pipeline with probabilities, close dates, and start dates; project budgets, milestones, and remaining work; capacity and utilization by role; and billing terms per project. If any one input is missing, the forecast inherits that blind spot. Capacity is the input most often skipped.
How is revenue forecasting different from financial forecasting?
Revenue forecasting predicts the top line: what the firm will earn and when. Financial forecasting is broader and adds costs, margins, and cash timing. In services, the two connect through capacity, since the same hours drive both revenue and labor cost. Our financial forecasting guide covers the full picture.
How often should a revenue forecast be updated?
Weekly for operational inputs (deals, milestones, utilization), because monthly cycles let errors accumulate for 30 days before anyone sees them. A full financial rollup can stay monthly. The test is simple: if a slipped project takes more than a week to show up in the forecast, the cycle is too slow.
Sources
- SPI Research and Rocketlane, 2026 Professional Services Maturity Benchmark (509 firms, published February 2026): https://www.rocketlane.com/blogs/professional-services-maturity-index-2026
- SPI Research, 2025 Professional Services Maturity Benchmark (utilization and margin trend context): https://spiresearch.com/reports/2025-ps-maturity-benchmark/