Financial forecasting in service businesses is different because your inventory is time. Every unused hour expires and takes potential revenue with it. That‘s why forecasts can‘t live in a static spreadsheet. They must reflect real capacity, utilization, and project timelines, and connect the sales pipeline directly to what your team can actually deliver.
In this article, you‘ll learn how to build a forecast that stays tied to operational reality: which inputs matter most, how to forecast revenue step by step, how to translate pipeline into capacity by role, and how to include cash timing so you don‘t look profitable on paper while running out of money in real life.
Why forecasting is different in service businesses (time is inventory)
Financial forecasting in professional services relies on accurate operational data regarding resources and timelines rather than static budget allocations. In this environment, the numbers on a spreadsheet are only as accurate as the operational reality on the ground. A forecast is not just a financial target; it is a reflection of how well your team can execute the work you have sold.
Shift from spreadsheet guesswork to operational reality
Forecasting often fails when it relies on disconnected spreadsheets that do not reflect the daily reality of project delays or scope creep. When you rely on static data, you are essentially driving while looking in the rearview mirror. You might see what you billed last month, but you miss the project manager’s note that the big implementation project is paused for two weeks.
PSA financial forecasting connects the dots between what was sold, what is being delivered, and when the cash will actually land. By the time variance reports are generated at the end of the month, it is usually too late to course-correct.
📚 Read more: Utilization, profitability, and forecasting dashboards
Revenue is variable, not fixed
Revenue depends entirely on people and project progress, making it volatile and dependent on accurate operational inputs rather than just sales targets. If a project stalls due to delayed client approval, your revenue forecast for the month needs to shift immediately.
In a subscription business, revenue is predictable; in a service business, revenue must be earned hour by hour. A flu wave hitting your engineering team directly impacts your top line for the quarter.
Forecasting is a team sport
Accurate forecasting requires input from the delivery and operations teams, as they possess the ground truth about project status. It cannot sit solely with the finance department. When delivery leads and project managers are involved in the process, the numbers reflect reality rather than wishful thinking. Without regular communication between these groups, the forecast becomes a theoretical exercise that creates surprises during board meetings.
Why forecasts fail in professional services (spreadsheets, data lag, scope creep)
Poor forecasting costs businesses significantly through unexpected cash flow gaps, misalignment between hiring and demand, and reactive decision-making that erodes margins. When leaders cannot see what is coming, they make expensive decisions based on gut feeling rather than data. The cost is rarely just a missed number; it manifests in stress, rushed work, and lost credibility with stakeholders.
- The cash-flow trap
Forecasts that focus on invoiced revenue instead of cash timing can create liquidity gaps. Service firms often pay employees long before clients pay invoices. When cash collection timing is ignored, a business can appear profitable on paper while struggling to meet short-term obligations.
📚 Read more: Accelerate the quote-to-cash process with PSA software
- Resource misalignment
Without reliable forecasts, teams swing between idle capacity and burnout. Hiring too early increases bench costs, while hiring too late leads to missed revenue or expensive short-term contractors. Both scenarios reduce margins and strain delivery teams.
📚 Read more: Capacity planning and resource planning: what is the difference?
- The cost of reactivity
Poor visibility forces leaders into reactive decisions that damage long-term performance. According to the 2025 Professional Services Maturity Benchmark by SPI Research, there is a clear link between visibility and profit. Organizations with limited forecasting saw their EBITDA margins fall to a five-year low of 9.8%. In contrast, firms using real-time PSA tools achieved significantly higher margins. Constant firefighting leaves little room for strategic growth.
Pro-tip: the 10% margin rule
Many managers think a 10% delay only costs 10% more time. In fixed-fee projects, this is a dangerous mistake. If your planned profit margin is 10%, a 10% delay in delivery will wipe out 100% of your profit. At that point, you are working for free. Always monitor your “Estimate at Completion” to protect your bottom line.
4 forecasting models used in professional services
Service firms usually forecast revenue with four models. The best approach is not to choose one model. It‘s combining them, because each one fails in a different way.
1. Pipeline (probability-weighted) model
This model forecasts revenue from open deals in your CRM. You assign probabilities and expected start dates, then estimate what might close and when it could begin. It‘s useful for planning growth, but it falls apart when sales stages are optimistic or start dates slip.
2. Backlog (committed work) model
Backlog forecasting starts with signed contracts and active projects. It estimates revenue based on delivery plans, milestones, and expected billable work. It‘s more reliable than a pipeline, but only if project plans and estimates are kept current as scope and timelines change.
3. Resource-driven (capacity-based) model
This model starts with delivery capacity by role, applies realistic utilization targets, and converts available billable hours into revenue using rates. It‘s the best protection against fantasy forecasts, because capacity is the hard limit in services. It fails when teams ignore ramp-up time, non-billable work, or rate mix.
4. Historical (run-rate) model
Historical forecasting uses past performance to project the future, often with seasonality or trend assumptions. It‘s fast and useful as a baseline, but it breaks during growth, churn, pricing changes, or major delivery shifts.
How to combine the models
Use backlog for near-term reality, pipeline for upside, resource-driven to validate feasibility, and historical as a sanity check. When the models disagree, that‘s not a problem. That‘s an early warning.
How to forecast revenue for service businesses (step-by-step)
Service business financial forecasting works by systematically layering data from sales, delivery, and finance to weigh potential sales against actual team availability. You cannot accurately predict revenue if you do not know if you have the people to earn it. The following steps outline how to connect your pipeline to delivery reality.
Step 1: Forecast expected revenue using probability
Separate committed work from pipeline opportunities to get a clear picture of your financial health. Start by looking at your backlog of signed contracts, as this is your safest revenue. Then, layer in your pipeline opportunities using probability ranges. Forecasting revenue in professional services requires applying different weights to deals in “contract negotiation” versus “initial discovery.” Avoid best-case assumptions where every deal closes and starts on time. Instead, apply a realistic “start lag” to account for the inevitable delay between contract signature and project kickoff.
Example: Birdview PSA shows expected revenue by combining active backlog with a probability-weighted pipeline, so you can apply consistent probabilities and account for start lag.
Step 2: Translate revenue into delivery demand
Convert your revenue targets into hours by role to understand the demand required to achieve those targets. Check whether the team can realistically deliver the work. If your forecast requires 500 hours of senior architecture time next month but you only have 300 hours of capacity, your revenue forecast is wrong. Identifying these gaps early helps you avoid overpromising to clients or scrambling to hire expensive contractors at the last minute.
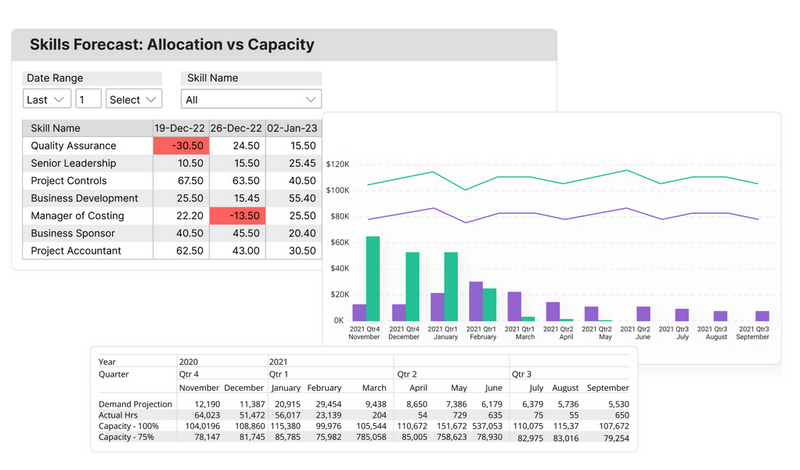
Example: Birdview PSA converts revenue targets into hours by role and compares them to real capacity, so you spot delivery gaps before you overpromise.
Step 3: Factor in utilization and billable mix
Set healthy utilization targets between 70% and 80% for delivery staff and adjust your revenue forecasts based on this real capacity. 100% billable utilization is unrealistic and unsustainable. because even your most productive earners need time for administrative tasks and training. If you model your revenue based on 100% utilization, you are building a deficit into your budget from day one.
Example: Birdview PSA links time tracking and utilization to forecasting, so a drop in billable utilization becomes an early warning, not a month-end surprise.
Step 4: Account for costs and margin
Calculate labor costs based on actual cost rates, including overhead and benefits, to ensure project financial forecasting reflects true profitability. You must also account for non-billable and internal work that eats into capacity without generating revenue. Understand how small delivery overruns affect profit; a fixed-fee project that goes 10% over budget comes directly out of your margin.
Example: Birdview PSA updates costs and margins as time and expenses are logged, so overruns hit the forecast immediately, not after reconciliation.
Step 5: Forecast cash flow, not just revenue
Map out your invoicing schedules for every active project to improve your cash flow forecasting. Revenue recognition does not pay the bills; cash collections do. Factor in payment terms and typical client delays. A profitable project with “Net 60” terms can create a cash crisis if you have to fund three months of payroll before seeing a dime.
Example: Birdview PSA ties billing schedules to project progress, helping you forecast cash timing and detect collection risk early.
Concrete workflows for better forecasting
Reliable forecasting workflows involve a structured cycle of data hygiene, EAC updates, pipeline reviews, and financial rollups to turn chaotic data into actionable insights. It is not a one-off event but a weekly rhythm that keeps Operations and Finance aligned.
- Data hygiene and time validation
Ensure time and expense data is accurate before forecasting. Set a weekly deadline for timesheet submission and approval. Missing or misallocated time directly undermines forecast accuracy.
- Estimate at completion (EAC) updates
Update forecasts based on remaining work, not the original budget. EAC reflects the current project reality. If spending outpaces progress, the forecast should change immediately.
- Sales pipeline and demand review
Review pipeline changes weekly to adjust resource plans. When deals stall or accelerate, release or reassign capacity right away to avoid staffing mismatches.
- Operational-to-financial rollup
Roll validated project data into a financial view on a weekly or bi-weekly cadence. Combining actuals with updated forecasts ensures Finance is working with current, reliable inputs.
Short-term vs long-term financial forecasting
Forecasting across time horizons requires adjusting data granularity to focus on cash flow for the short term, resource utilization for the mid-term, and strategic growth for the long term. Different decisions require different views of the future. Trying to use a single forecast for next week’s payroll and next year’s strategy will result in failure on both counts.
| Forecasting horizon | Primary focus | What to track | Why it matters |
| Short-term (30 days) | Cash flow and billing | Approved timesheets, milestone completions, invoice aging | Protects liquidity. Accuracy here determines how quickly you can invoice, collect cash, and meet near-term obligations. |
| Mid-term (60–90 days) | Capacity and hiring | Utilization trends, upcoming demand, contractor vs. full-time needs | This is the most actionable window for staffing decisions. According to the Project Management Institute (PMI), proactive resource management in this period reduces project failure caused by resource shortages. |
| Long-term (annual) | Strategy and margins | Service mix, margin trends, aggregate financial performance | Supports strategic planning by revealing margin trends and guiding pricing and service mix decisions for the next fiscal year. |
Utilization-based revenue forecasting
Utilization-based revenue forecasting improves forecast reliability by providing the ground truth of utilization rates and project progress. These are the leading indicators of future revenue. Financial spreadsheets are often a lagging indicator of what happened weeks ago in operations, whereas utilization data tells you what is happening right now.
Key principles include:
- Utilization as a leading indicator
Changes in billable utilization today directly impact revenue in the coming weeks. A dip in utilization signals an upcoming revenue gap, giving teams time to investigate blocked work or demand issues before the impact is felt financially.
- Real-time data over lagging reports
Waiting for end-of-month reports is costly in fast-moving service organizations. Real-time dashboards help managers identify unused capacity early and reassign work before billable time is lost.
- Revenue tracking at the right level of detail
Forecasting by project phase prevents revenue from being averaged unrealistically across months. According to benchmarks from SPI Research, organizations with more granular visibility achieve higher forecast accuracy, especially when billing milestones are unevenly distributed.
📚 Read more: What is the utilization rate? How to track & calculate
How PSA software supports forecasting (Birdview example)
Birdview PSA supports financial forecasting by replacing disconnected spreadsheets with a centralized system grounded in operational reality. By acting as a single source of truth, it keeps delivery data and financial outcomes fully aligned.
Financial data tied to real project activity
Birdview connects financial management directly to live project data, so forecasts reflect what is actually happening on the ground.
This includes the ability to:
- Set and manage billing rates
- Track costs and margins in real time
- Update project financials automatically as time and expenses are logged
This eliminates reliance on delayed, end-of-month reconciliation.
Forward-looking revenue visibility
Birdview provides Expected Revenue reports that combine:
- Active project backlog
- Probability-weighted pipeline opportunities
This creates a forward-looking view of where revenue is expected to come from in the coming months, making it easier to identify gaps early and take corrective action.
Connected time, utilization, and billing
Financial forecasting is most effective when time tracking, utilization, and billing are tightly linked. In Birdview, these modules work together, allowing teams to see how staffing and delivery decisions affect financial outcomes.
With this setup, you can:
- Understand the financial impact of utilization changes
- See how staffing adjustments affect margins
- Use scenario views to test “what if” decisions, such as hiring or delaying a project start
By keeping all critical data in one place, Birdview PSA helps teams move from reactive reporting to proactive financial planning.
FAQs
Q: How often should we update our financial forecast?
A: You should update operational metrics like utilization weekly to catch issues early. Rolling financial forecasts are typically updated monthly to reflect the latest billing data and pipeline changes.
Q: What is the difference between a budget and a forecast?
A: A budget is the plan you set at the start of the year, which represents what you want to happen. A forecast is the updated reality based on actual performance, which represents what is likely to happen given current conditions.
Q: How do we forecast revenue for time and materials vs fixed-fee projects?
A: For T&M projects, forecast revenue based on scheduled resource hours multiplied by billable rates. For fixed-fee projects, forecast based on the estimated completion dates of billing milestones or percentage of completion (POC) revenue recognition rules.
Q: Who should own the forecasting process?
A: Finance typically owns the final output and reporting. However, Delivery and Operations leaders must own the inputs regarding resourcing, project status, and estimates to ensure the data is accurate.