Utilization, realization, and profitability explain why busy teams still lose profit. A team can be fully booked, deliver projects on time, and still underperform financially if part of the work is not billed, costs are too high, or delivery is inefficient.
These three metrics describe the full path from work performed to financial outcome. Utilization shows how much capacity is used. Realization shows how much of that work turns into revenue. Profitability shows whether the work actually creates value.
If you track them separately, the numbers often look fine. When you connect them, the gaps become visible. That is where most service firms lose profit.
Utilization vs realization vs profitability
Utilization measures how much of your team‘s time is billable, realization measures how much of that time is actually billed and collected, and profitability reflects the financial outcome after costs.
Each metric answers a different question:
- Utilization → capacity usage
- Realization → revenue capture
- Profitability → financial result
| Metric | What it shows | Main question |
| Utilization | How much available time is used for billable work | Are people working on revenue-generating activities? |
| Realization | How much billable value turns into invoiced revenue | Are we capturing the revenue we earned? |
| Profitability | Revenue left after project costs | Is the work financially worth doing? |
Utilization and realization are efficiency metrics expressed as percentages. Profitability reflects the final financial result, either as profit or margin.
A team can have high utilization and realization but still lose money if costs are too high or projects are priced incorrectly.
Why these metrics are often misunderstood
These metrics are often misunderstood because they are tracked in separate systems and reviewed by different teams. That creates a fragmented view of performance.
Finance looks at margins. Operations looks at utilization. Project managers track delivery metrics. The numbers do not always match, and the conclusions can conflict.
The result is a set of predictable mistakes:
- High utilization is seen as success, even when projects are unprofitable
- Revenue gaps are ignored because realization is not tracked closely
- Decisions are made in isolation, without understanding trade-offs
The result is confusion. Teams work harder, but outcomes do not improve.
What is the utilization rate?
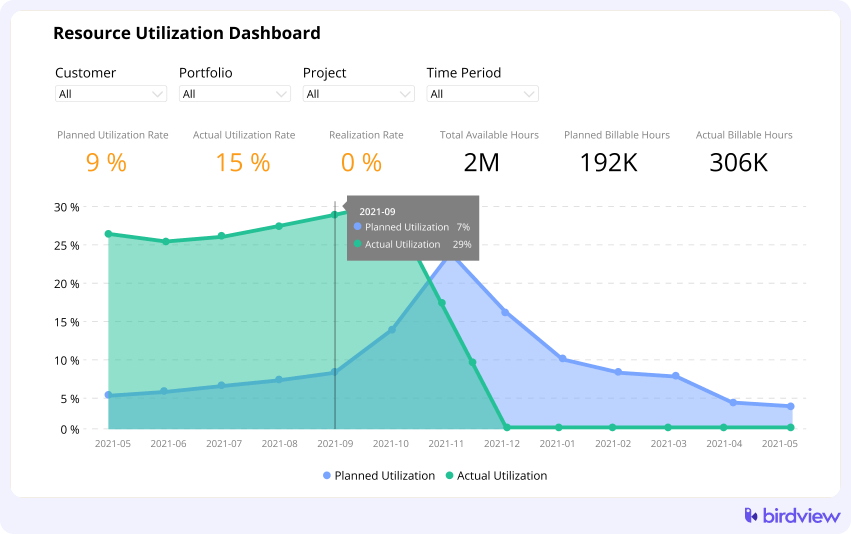
Utilization rate measures how much of your team‘s available time is spent on billable work.
It shows how effectively your team‘s capacity is used.
A simple example: if a consultant works 40 hours and 30 are billable, the utilization is 75%.
Why it matters
Utilization is a leading indicator of productivity. It tells you whether your team is working on revenue-generating activities.
Low utilization often means too much internal work, poor planning, or gaps between projects.
Common mistakes
The most common mistake is optimizing for utilization alone.
A fully booked team is not always a healthy sign. If people are overloaded or working on low-value projects, high utilization can hide deeper problems.
📚 Read more: Billable utilization: Increase profits with the right strategy & tools
What is the realization rate?
Realization rate measures how much billable work turns into invoiced revenue after discounts, write-offs, or billing adjustments.
If you want to track whether invoices are paid, that is usually a collections or cash flow metric, not realization.
Realization rate connects delivery to revenue. If your team logs 100 billable hours but only 85 are invoiced or approved, realization is 85 percent.
Why it matters
Realization shows how much of your work turns into revenue. It highlights revenue leakage.
Even small gaps in realization can have a large impact across multiple projects.
Common issues
Realization drops when:
- Time entries are missing or late
- Discounts or write-offs are applied
- Scope is unclear or expands without billing
- Billing processes are delayed
Many firms focus on delivery but lose revenue between time tracking and invoicing.
What is project profitability?
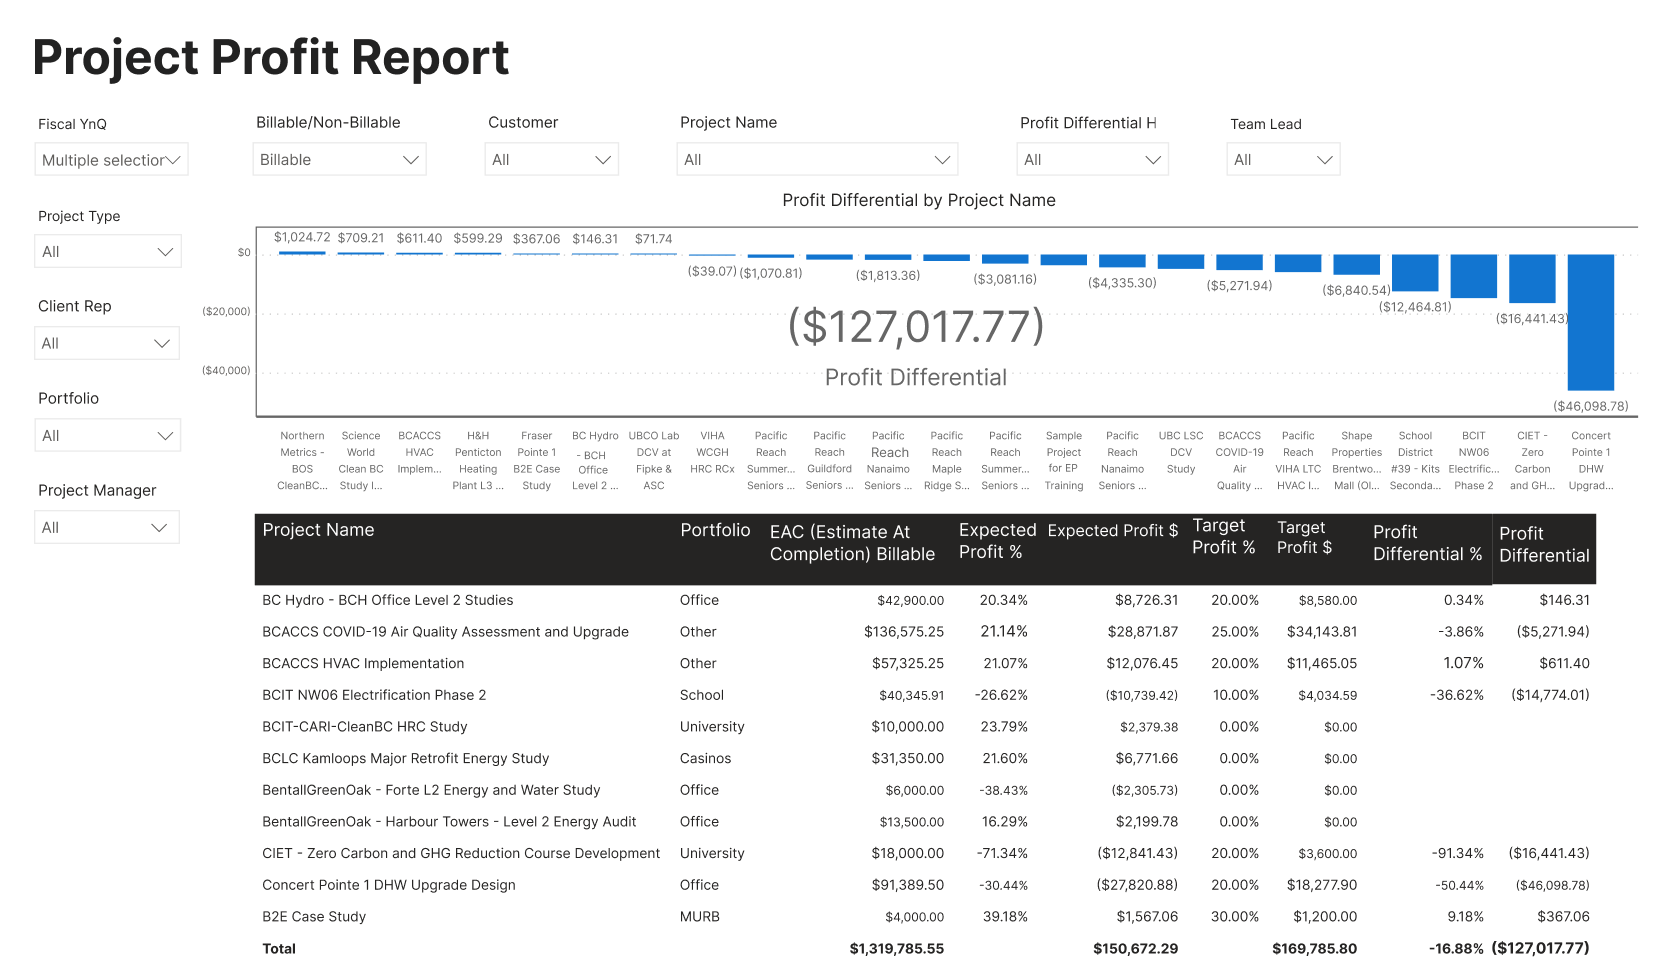
Project profitability shows the financial outcome of a project by comparing revenue to total costs.
It reflects the final financial outcome of a project.
Unlike utilization and realization, profitability is not a percentage of activity. It is the result of all decisions combined.
Why it matters
Profitability tells you whether your work creates value for the business.
A project can have strong utilization and realization but still underperform financially if costs are too high.
Key components
Project profitability depends on three factors:
- Billing, how much revenue is generated
- Costs, including salaries, overhead, and external expenses
- Efficiency, how much effort is required to deliver
Understanding these together is critical for pricing, staffing, and planning.
How utilization, realization, and profitability work together
Utilization, realization, and profitability work together as a flow from work performed to financial outcome.
Work → billable time → billed revenue → profit
Each metric measures a step in that flow.
High utilization + low realization = lost revenue
This is one of the most common issues in service firms. The team is busy, work is completed, but not all of it is billed.
The gap usually comes from poor time tracking, unclear scope, or write-offs. Over time, this leads to significant revenue loss.
High realization + low utilization = underused capacity
Here, most of the work done is billed correctly, but the team is not fully utilized. You will typically see this when there are gaps between projects or weak pipeline planning.
Revenue per project may look good, but total revenue stays below potential.
High utilization + high realization does not guarantee high profitability
Even when both metrics are strong, profitability can still suffer.
This typically points to cost issues, such as senior resources doing junior-level work, inefficient delivery processes, or projects that were underestimated from the start.
Profitability depends on how efficiently revenue is generated, not just how much work is billed.
Profitability depends on all three
Strong performance comes from balancing all three.
- utilization ensures capacity is used
- realization ensures work is billed
- profitability ensures the work makes financial sense
Optimizing one metric without the others leads to distortions.
Common scenarios in service firms
Common scenarios in service firms show how utilization, realization, and profitability behave in real situations.
Busy team, low revenue
The team works at full capacity, but revenue does not match effort. In most cases, this indicates low realization. The work is done, but not fully billed.
Strong billing, low margins
Revenue looks solid, but profits are weak. A common cause is high costs or underpriced projects.
High utilization but burnout risk
Teams are fully booked for long periods.
Short-term output increases, but long-term delivery quality drops. This can reduce both realization and profitability over time.
Profitable but inefficient operations
Some firms achieve good profitability despite inefficiencies.
This can happen with high pricing or niche expertise. However, inefficiency limits scalability and creates risk.
How to measure these metrics correctly
These metrics are simple to calculate, but accuracy depends on using consistent data across teams. What matters is consistency and accuracy.
Tracking utilization
Utilization is calculated as:
Utilization rate (%) = (Billable hours ÷ Available hours) × 100
- Billable hours = time recorded on client work
- Available hours = total working hours minus holidays, PTO, and internal non-working time
Example: If a consultant has 160 available hours in a month and logs 120 billable hours: Utilization = (120 ÷ 160) × 100 = 75%
The key is defining “available hours” correctly. Include realistic working time, not theoretical capacity.
Tracking realization
There are two common ways to calculate realization.
Time-based realization rate (%) = (Billed hours ÷ Billable hours) × 100
- Billable hours = time recorded as billable
- Billed hours = time actually invoiced
Revenue-based realization rate (%) = (Billed revenue ÷ Billable value) × 100
- Billable value = billable hours × standard billing rate
- Billed revenue = actual invoiced amount after discounts or write-offs
You can track it in hours or revenue. Revenue-based realization is usually more accurate for financial analysis.
Example: If 100 billable hours at $100/hour = $10,000 potential revenue, but only $8,500 is invoiced: Realization = (8,500 ÷ 10,000) × 100 = 85%
Calculating profitability
Profitability is calculated as:
Project profitability = Project revenue − Total project costs
Costs should include:
- salaries or cost rates
- overhead allocation
- external expenses
To go deeper, you can calculate margin:
Profit margin (%) = (Profit ÷ Revenue) × 100
Where:
- Project revenue = total invoiced amount
- Total project costs =
- labor cost (hours × cost rate)
- external expenses
- allocated overhead (if included)
Example: Revenue = $50,000; Costs = $35,000; Profit = $15,000; Profit margin = (15,000 ÷ 50,000) × 100 = 30%.
Incomplete cost tracking leads to misleading results.
Why disconnected systems create confusion
Disconnected systems create confusion because time tracking, billing, and finance are often managed in separate tools.
Each system shows part of the picture, but not the full flow from work to profit.
The impact shows up in several ways:
- Inconsistent data between teams
- Delays in reporting
- Manual reconciliation
- Lack of real-time visibility
For example, time may be tracked in one tool, invoices created in another, and financial results analyzed in a third system. By the time reports are aligned, decisions are already outdated.
This is where integrated systems make a clear difference. Tools like Birdview PSA connect resource planning, time tracking, project financials, and reporting in one system. This helps teams see whether capacity is being used, whether billable work is being captured, and whether projects are producing healthy margins.
How to improve utilization, realization, and profitability
Improving utilization, realization, and profitability requires fixing the full delivery-to-revenue flow, not optimizing a single metric.
Improve resource planning
Better planning increases utilization without overloading teams.
Focus on:
- realistic capacity planning
- aligning skills with project needs
- reducing idle time between projects
Reduce unbilled time
Improving realization often has the fastest impact on revenue.
Practical steps include:
- enforcing timely time entry
- simplifying approval workflows
- reducing manual billing gaps
📚 Read more: Unbilled time in service firms: Where revenue gets stuck and how to fix it
Align billing and delivery
Projects should be structured so that delivery and billing match.
Clear scope, defined milestones, and consistent billing rules reduce write-offs and disputes.
Increase visibility into financials
Teams need to see how their actions affect outcomes.
Project managers should understand cost impact, not just timelines. Finance teams should see delivery data, not just invoices.
What to look for in tools that track these metrics
Tracking utilization, realization, and profitability effectively requires more than reporting. It requires connected data across delivery, billing, resource planning, and finance.
| Capability | Why it matters |
| Integrated time tracking and billing | Ensures all billable work is captured and invoiced |
| Real-time reporting | Helps teams act before problems grow |
| Project-level financial visibility | Connects delivery decisions to profitability |
Without these capabilities, metrics remain disconnected and difficult to act on.
FAQ: utilization, realization, and profitability
Why is high utilization not enough to ensure profitability?
High utilization only shows that your team is busy. It does not guarantee that the work is billed correctly or delivered efficiently. If realization is low or costs are high, profitability will still suffer.
What causes low realization in professional services firms?
Low realization usually comes from missing or delayed time entries, scope creep, write-offs, or billing delays. In many cases, the issue is not delivery but the gap between work done and work billed.
How do utilization and realization affect each other?
Utilization drives how much billable work is created, while realization determines how much of that work turns into revenue. If utilization is high but realization is low, the firm is working but not earning what it should.
Which metric should leaders prioritize?
No single metric should be prioritized in isolation. Profitability is the final goal, but it depends on both utilization and realization. Strong performance comes from balancing all three.
Why do finance and operations teams often see different numbers?
This usually happens because utilization, billing, and financial data are tracked in separate systems. Without a shared data source, teams rely on different inputs, which leads to conflicting reports.
How often should these metrics be reviewed?
Utilization and realization should be reviewed weekly for active teams. Profitability is typically reviewed at the project level and monthly at the portfolio level to support financial decisions.