Ksenia Kartamysheva
 - A CFO dashboard helps professional services firms connect financial reporting with project delivery, resource planning, and operational performance.
- Strong CFO dashboards connect profitability, utilization, forecasting, labor costs, backlog, and resource capacity into one operational reporting layer.
- Many professional services firms struggle with fragmented reporting across accounting systems, project tools, and spreadsheets, leading to slower decisions, unreliable forecasts, and inconsistent profitability reporting.
- A project profitability dashboard helps identify margin erosion caused by underpriced projects, missed time entries, scope expansion, inefficient staffing, or excessive non-billable work.
- A resource utilization dashboard helps firms monitor workload balance, billable capacity, overtime, and future staffing risks before delivery issues affect margins or project timelines.
- Real-time dashboards reduce manual reporting work and improve visibility into delivery risks, utilization gaps, budget overruns, and forecast changes.
- Forecasting becomes more reliable when finance teams can evaluate delivery capacity, staffing demand, and project workload alongside pipeline and revenue projections.
- Executive dashboards are most effective when they prioritize operational clarity, financial visibility, and actionable reporting instead of excessive visualization complexity.
- Strong reporting environments require a single source of truth for project financials, utilization, labor costs, and forecasting assumptions.
- Many professional services firms move from spreadsheets to centralized PSA and BI reporting systems once manual reporting, utilization forecasting, and profitability tracking become difficult to scale.
A CFO dashboard helps professional services firms track profitability, utilization, forecasting, and delivery performance in one place. Many firms already collect this data, but it remains fragmented across accounting systems, project tools, and spreadsheets. Strong dashboards connect financial and operational reporting into one real-time executive view.
What a CFO dashboard should actually show
A CFO dashboard should provide real-time visibility into profitability, revenue, utilization, costs, and delivery performance. In professional services, financial reporting alone is not enough because project delivery directly affects margins.
The best dashboards help executives answer operational questions quickly:
- Are projects profitable?
- Do we have enough delivery capacity?
- Which teams are underutilized?
- Where are margins declining?
- Can forecasted work realistically be delivered?
Good dashboards prioritize clarity over volume and focus on metrics tied directly to financial outcomes. This is where many spreadsheet-based reporting processes fail. Teams spend time consolidating exports instead of identifying risks early.
Why CFO dashboards matter in professional services
Professional services firms depend heavily on labor utilization, project delivery, and staffing efficiency. That makes operational visibility just as important as accounting visibility.
Lack of visibility into project profitability
Many firms track company revenue accurately but struggle to measure profitability at the project or client level.
This often creates hidden margin erosion caused by excessive non-billable work, underpriced projects, missed time entries, scope expansion, or inefficient staffing allocation.
Without centralized reporting, leadership teams usually discover margin problems too late.
Disconnected financial and delivery data
One of the biggest reporting problems in service firms is fragmented operational data.
Finance teams work in accounting systems. PMOs use project management tools. Resource managers rely on spreadsheets. Executives receive reports assembled manually from several systems.
This disconnect creates conflicting numbers and weak forecasting accuracy.
Manual reporting delays decisions
Manual reporting slows executive decision-making. Many firms still export utilization reports, financial reports, and project updates into Excel before leadership meetings. By the time reports are finalized, project conditions have already changed.
In many firms, this also delays invoicing approvals, creates staffing conflicts between teams, and increases month-end reconciliation work for finance departments.
As organizations scale, manual reporting becomes increasingly difficult to maintain consistently.
No forecasting capability
CFO dashboards should help firms understand future delivery and financial risks, not just historical performance.
Without forecasting visibility, firms struggle to answer practical business questions:
- Will utilization decline next quarter?
- Do we need to hire?
- Which projects create future capacity risks?
- Can the organization support projected pipeline growth?
This often leads to reactive operational decisions instead of proactive planning.
CFO dashboard examples
CFO dashboards help professional services firms connect financial reporting with operational performance. Instead of reviewing disconnected spreadsheets and accounting exports, leadership teams can monitor profitability, utilization, delivery costs, and forecasting in real time.
Project profitability dashboards
Project profitability dashboards help firms monitor margins, delivery costs, and financial performance at the project level.
Project Score Card
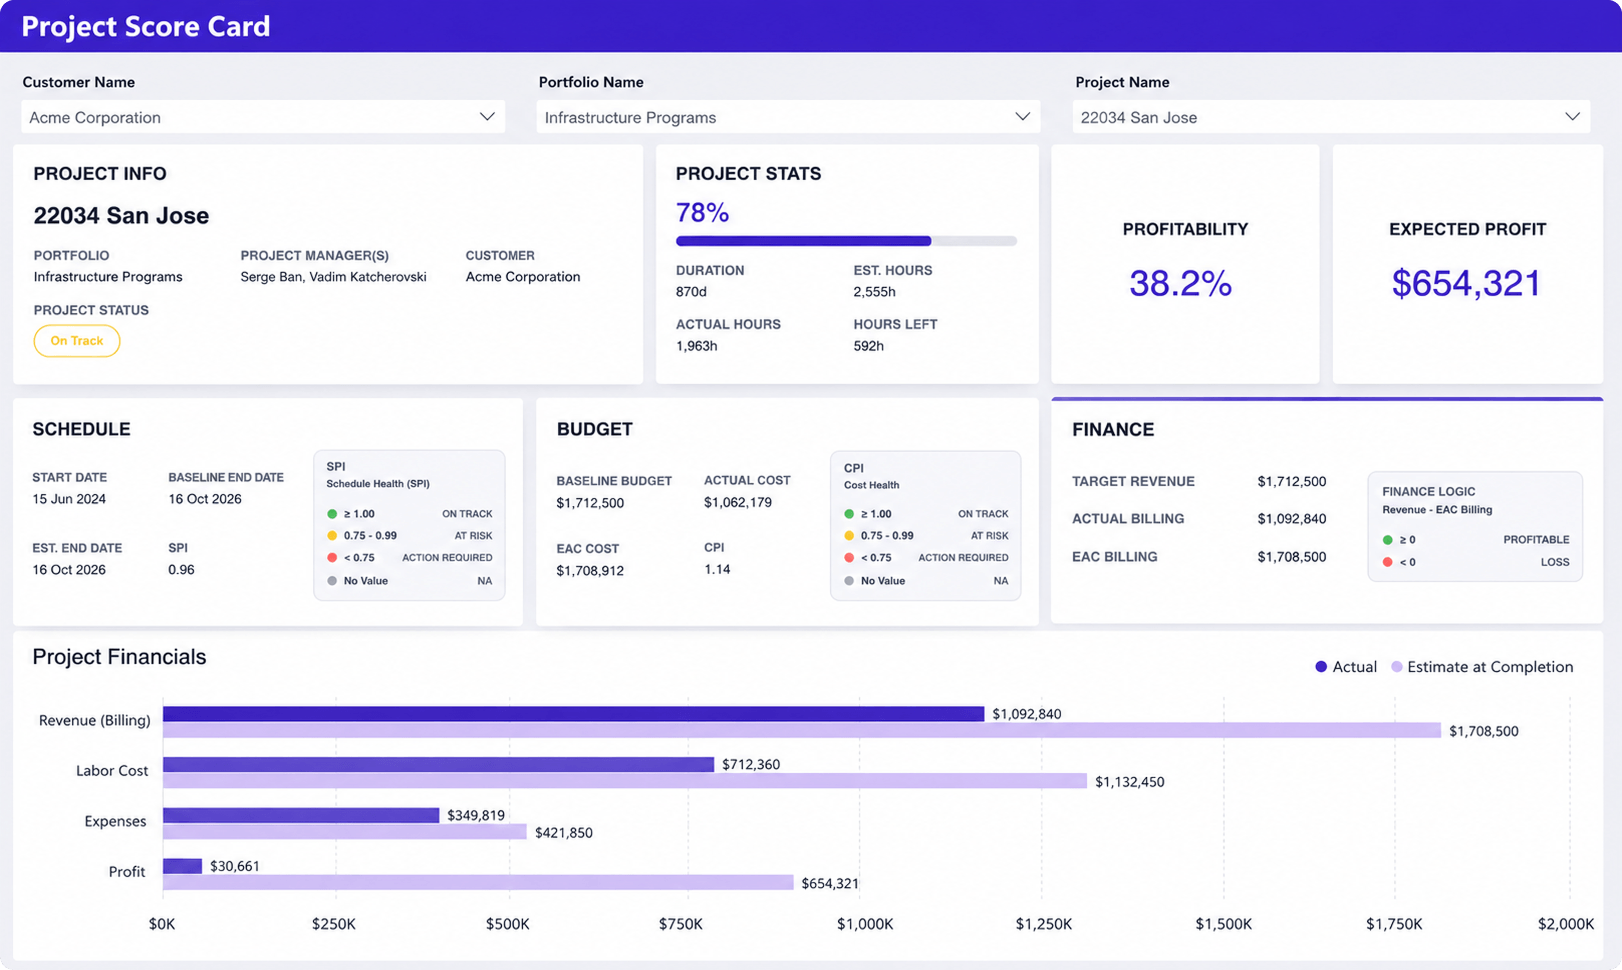
What it shows:
- project profitability and expected profit
- actual vs estimated revenue and cost
- labor and expense breakdown
- project health indicators
- schedule and budget performance metrics
Why it matters:
This dashboard gives executives a high-level financial and operational view of project performance in one place. It helps teams quickly identify projects with profitability, budget, or delivery risks before they affect portfolio performance.
Profit Forecast Dashboard
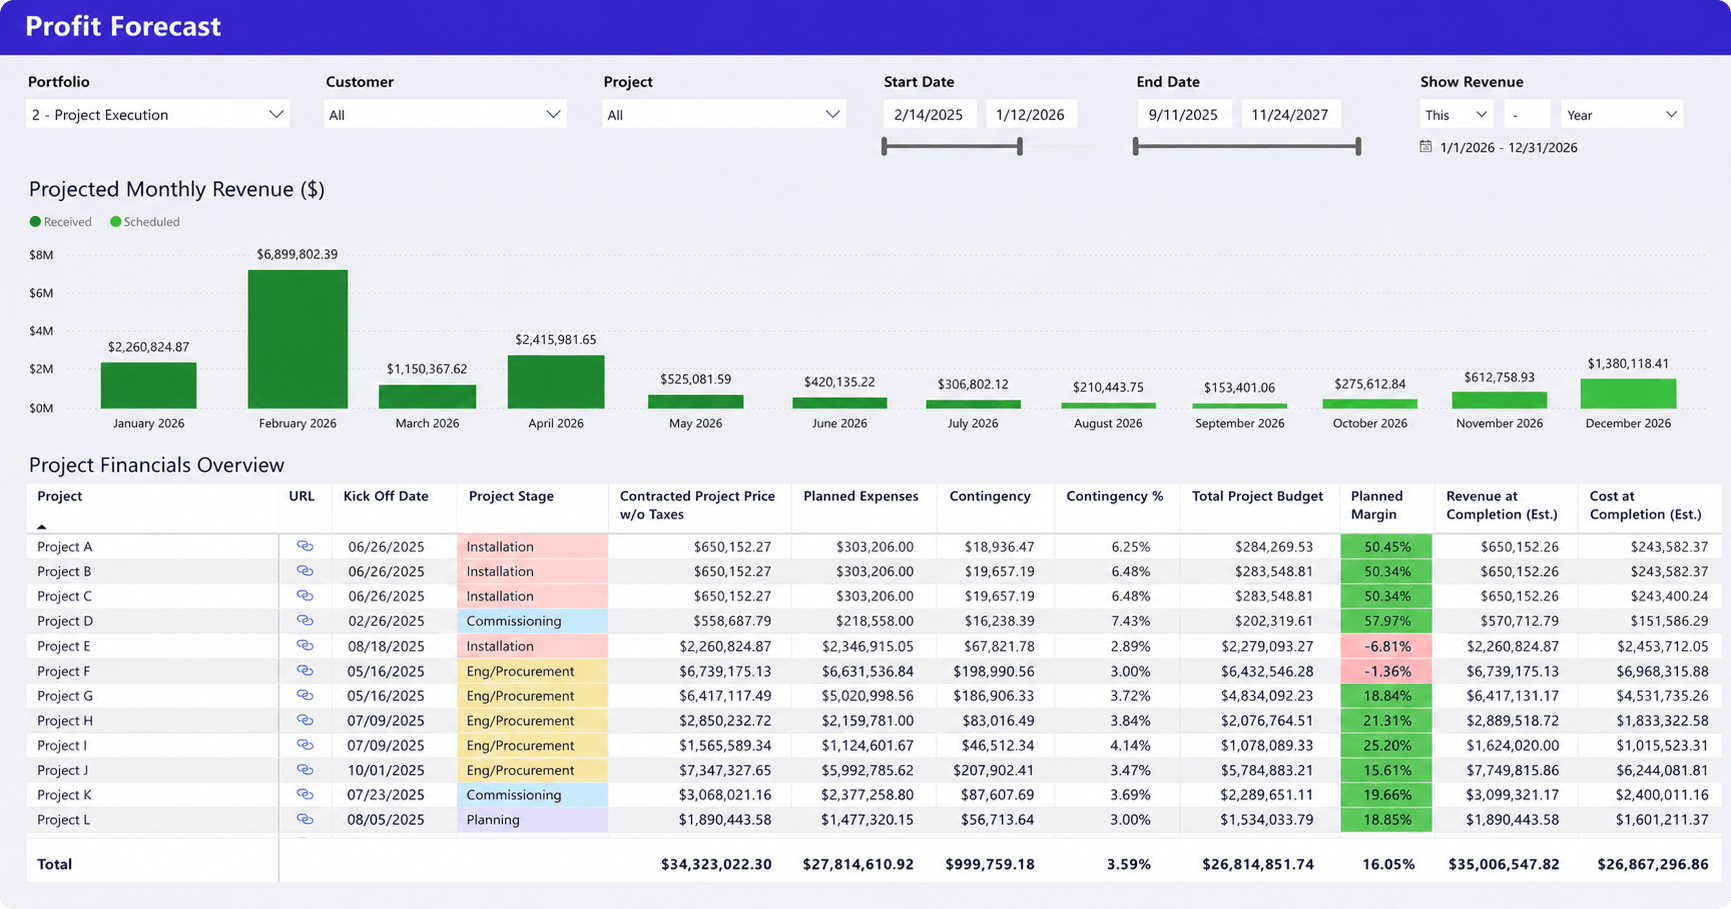
What it shows:
- projected monthly revenue
- planned vs forecasted profit margins
- revenue at completion
- cost at completion
- profitability trends across projects
Why it matters:
This dashboard helps CFOs forecast future profitability based on current project performance and delivery plans. It also improves financial planning by exposing projects with declining margins or increasing forecasted costs early.
Resource utilization dashboards
Resource utilization dashboards help firms understand whether delivery teams are operating efficiently and whether future project demand aligns with available capacity. They help firms monitor workload balance, staffing pressure, overtime, billable utilization, and resource capacity risks.
Resource Utilization Dashboard
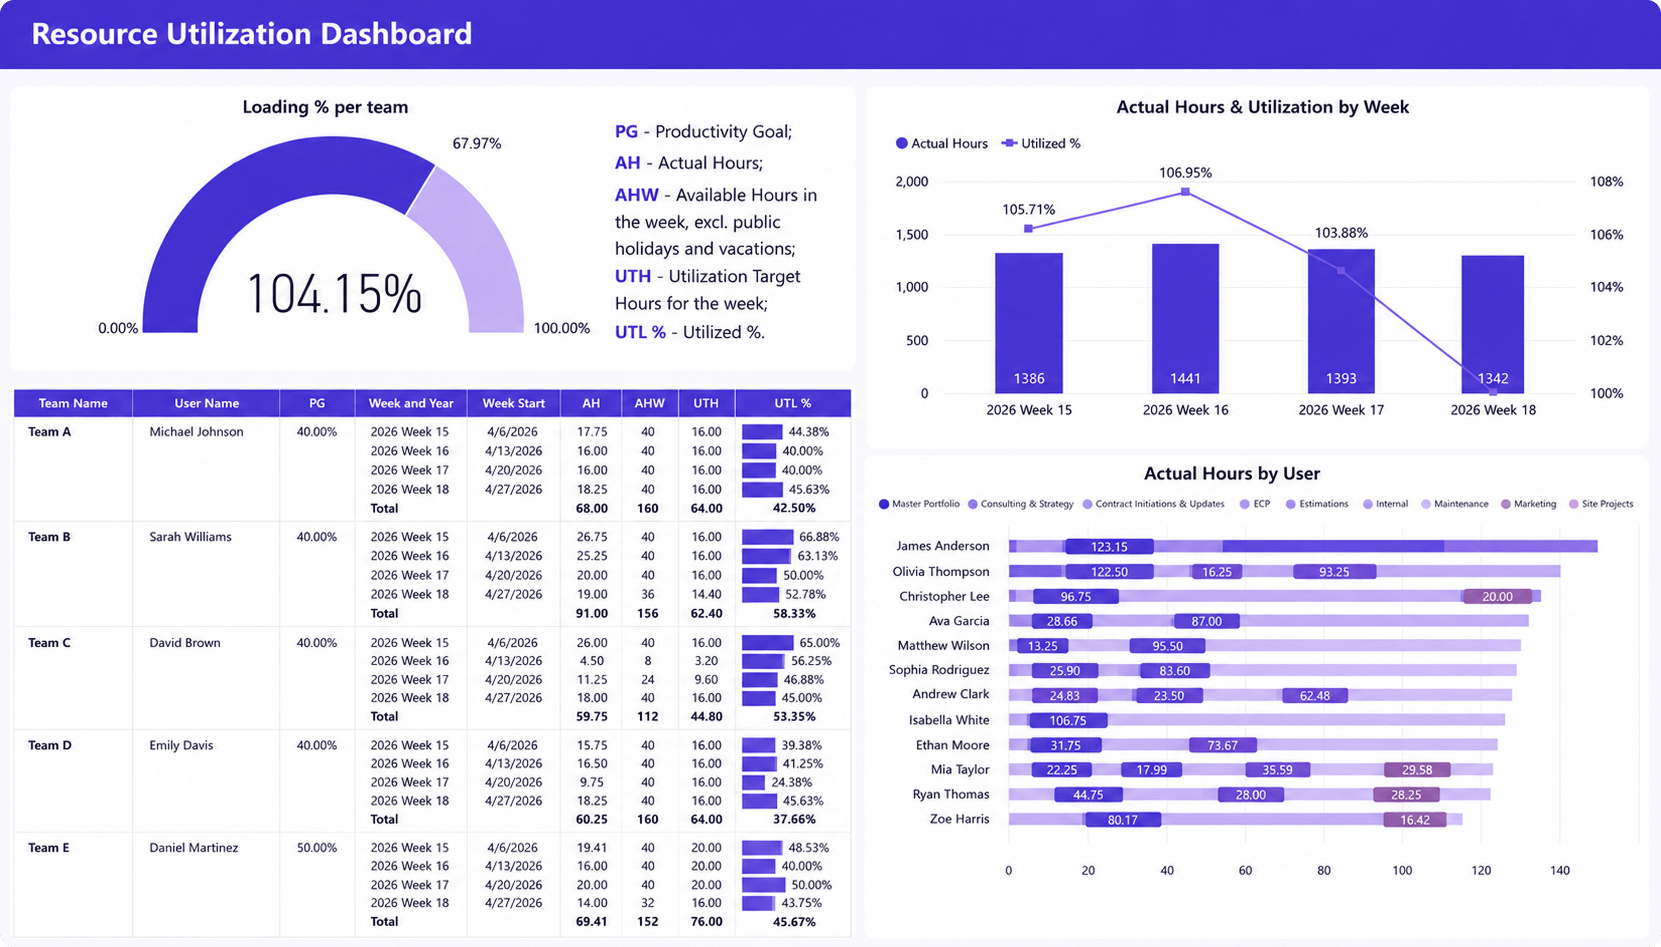
What it shows:
- utilization rates by team and employee
- actual vs available hours
- weekly workload trends
- utilization target tracking
- workload distribution across teams
Why it matters:
This type of resource utilization dashboard helps leadership teams identify underutilized or overloaded teams before utilization issues affect profitability or delivery timelines. It also improves staffing decisions by showing whether available capacity aligns with project demand.
User Management Dashboard
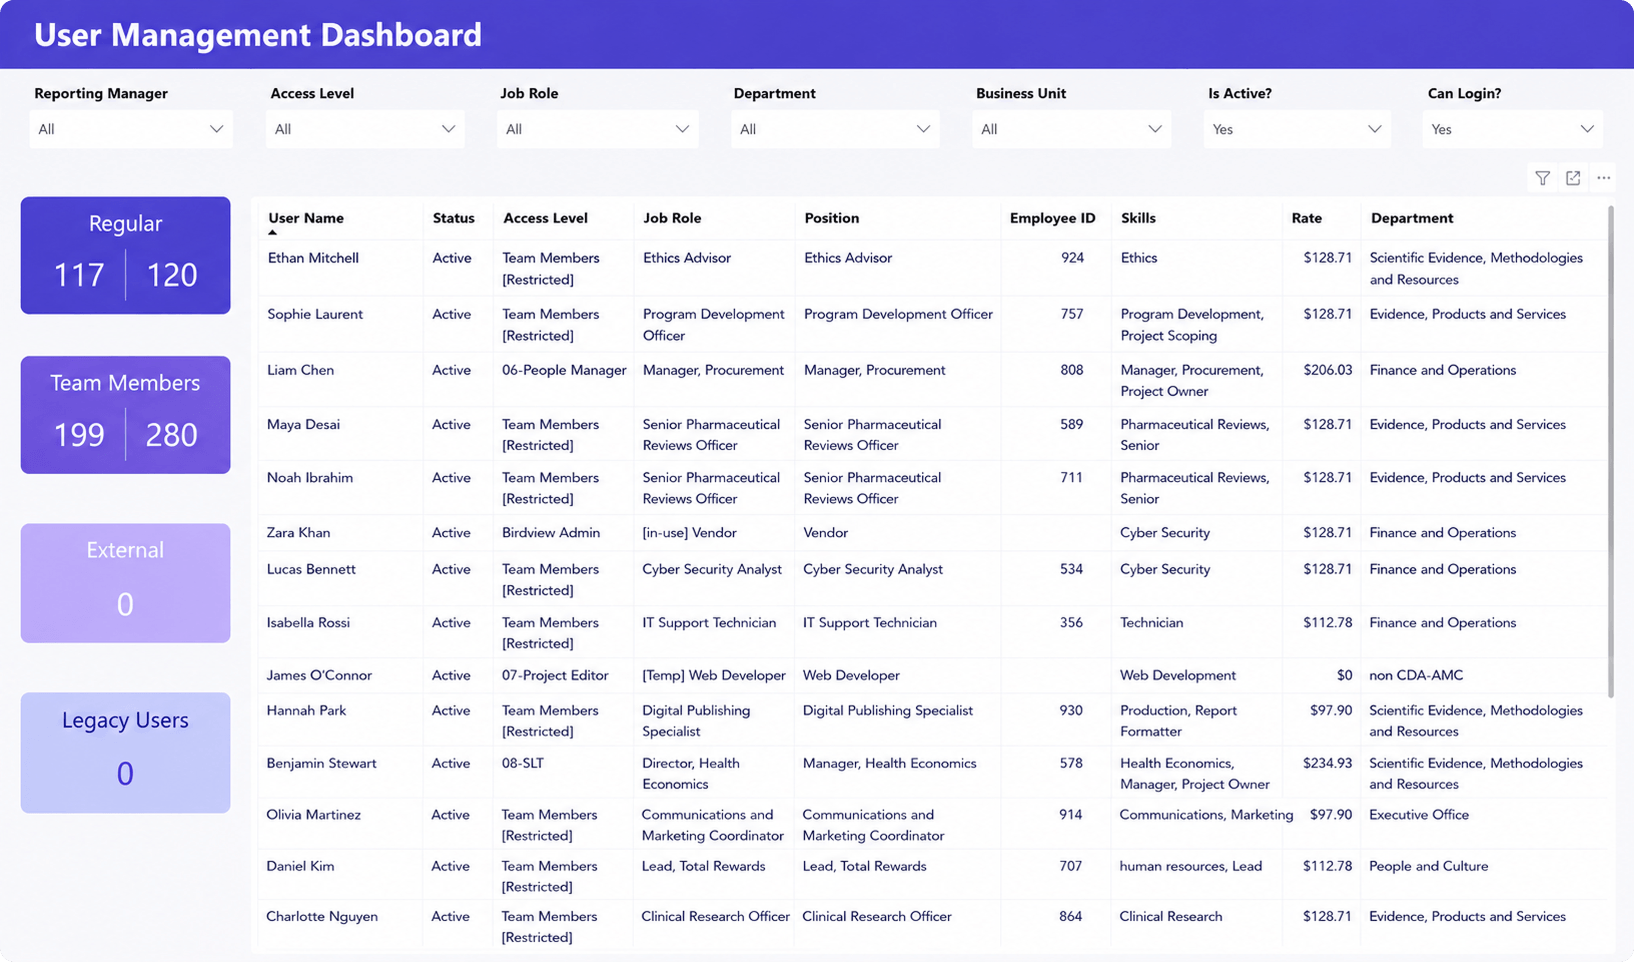
What it shows:
- active users and team members
- employee roles and departments
- billing rates by employee
- access levels and resource structure
- workforce distribution across business units
Why it matters:
This dashboard helps operations and finance leaders monitor workforce structure, billable roles, and staffing allocation across teams and departments.
Timesheets Overtime
What it shows:
- overtime hours by project and employee
- overtime billing totals
- total billed hours
- regular vs overtime utilization
- billing trends across projects and customers
Why it matters:
This dashboard helps firms monitor overtime costs and identify projects relying too heavily on extended hours or inefficient staffing allocation.
Revenue and forecasting dashboards
Revenue and forecasting dashboards help finance leaders monitor profitability, forecast revenue, and identify projects with growing financial risk.
Revenue, Cost & Profit
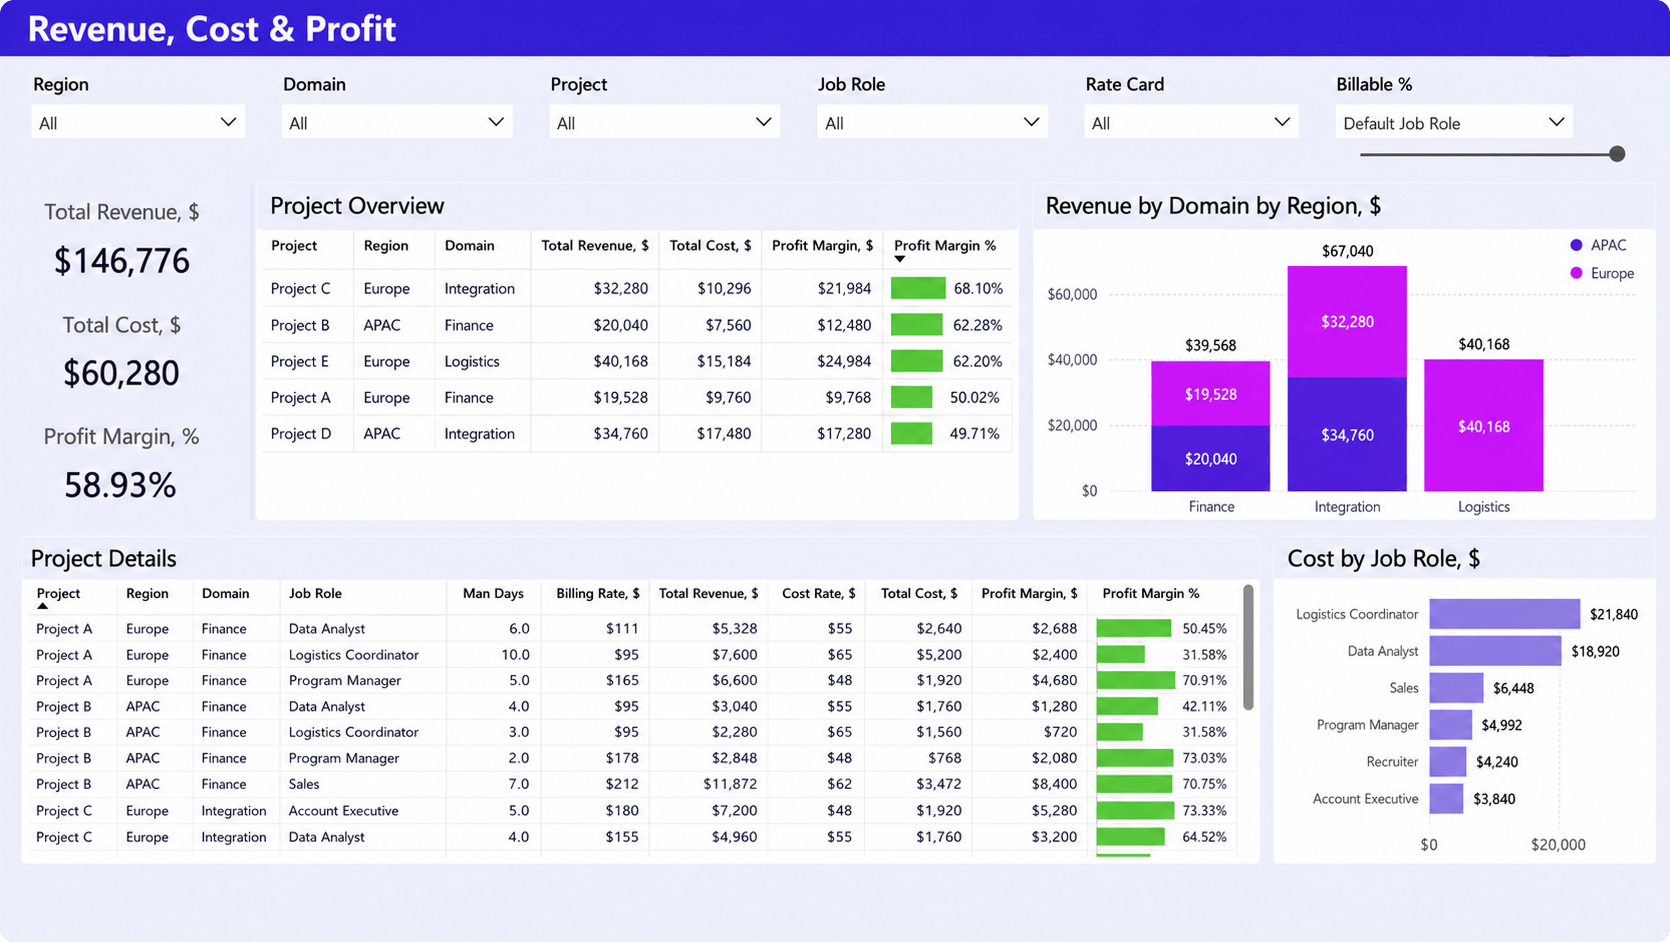
What it shows:
- total revenue, cost, and profit margin
- profitability by project
- revenue by service/domain
- cost distribution by role
- project-level margin performance
Why it matters:
This type of project profitability dashboard helps leadership teams quickly identify profitable and unprofitable work. It also helps uncover margin erosion caused by labor costs, underpriced projects, or excessive non-billable work.
Actual and Forecasted Cost vs. Budget
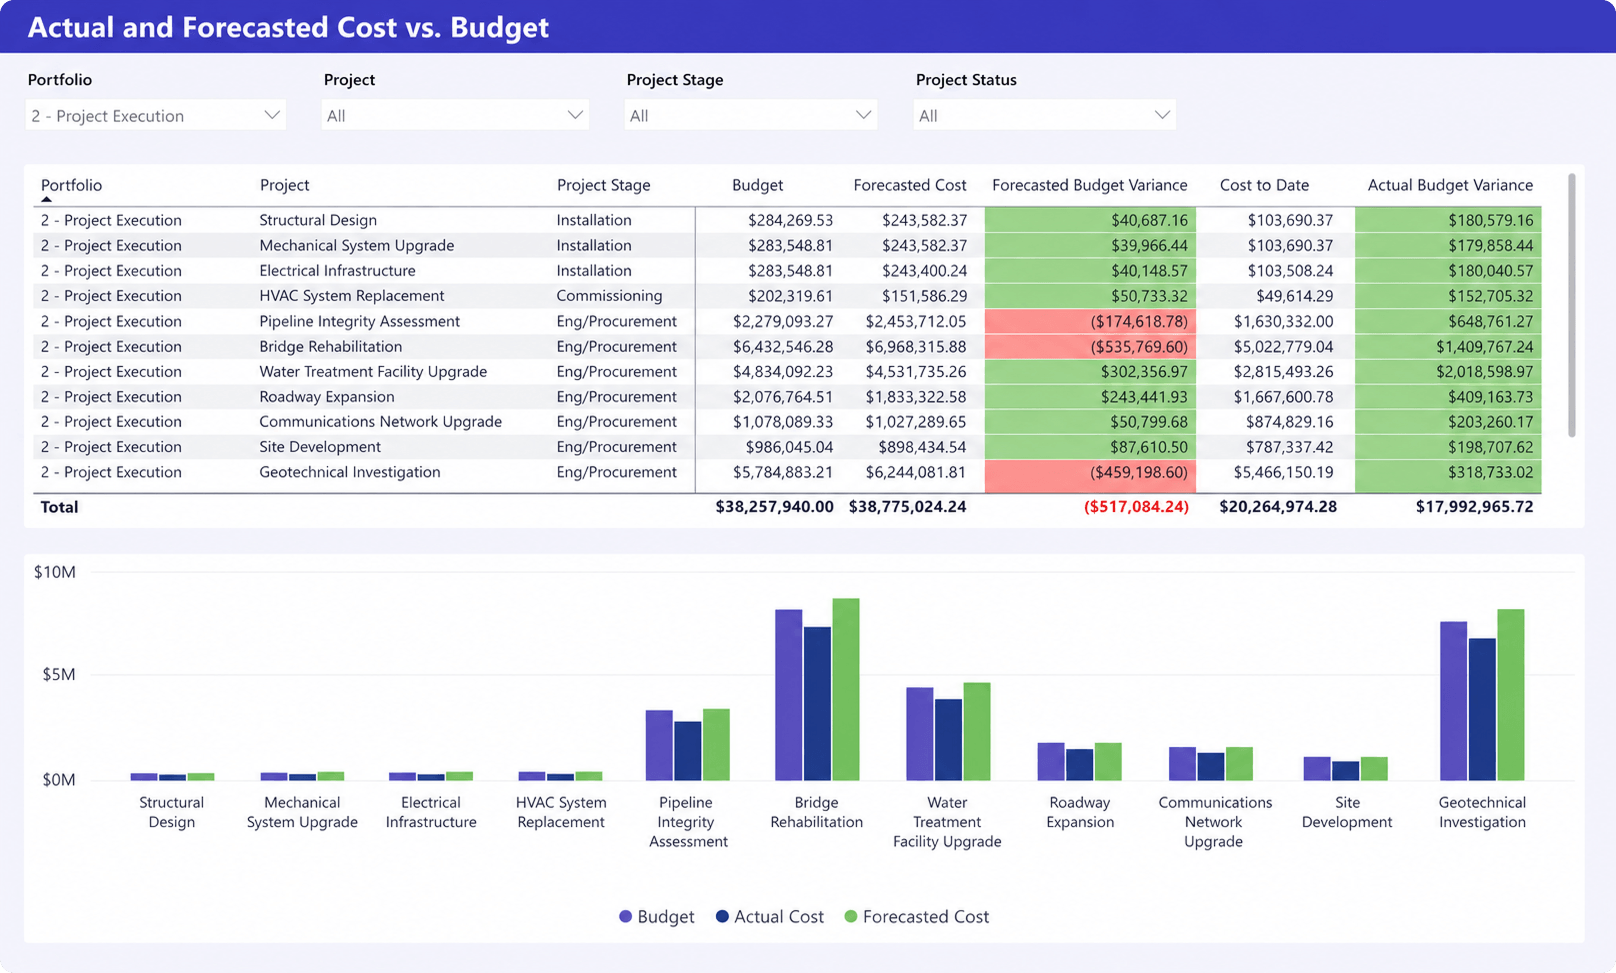
What it shows:
- project budget vs actual cost
- forecasted final cost
- budget variance
- cost-to-date tracking
- projects at financial risk
Why it matters:
This dashboard helps CFOs identify projects likely to exceed budget before financial issues escalate. It improves cost control by showing forecasted overruns early enough for teams to adjust staffing, scope, or delivery plans.
Cost tracking dashboard
Cost tracking dashboards help firms monitor project expenses, delivery costs, and billable versus non-billable spending.
Project Expense Tracking Dashboard
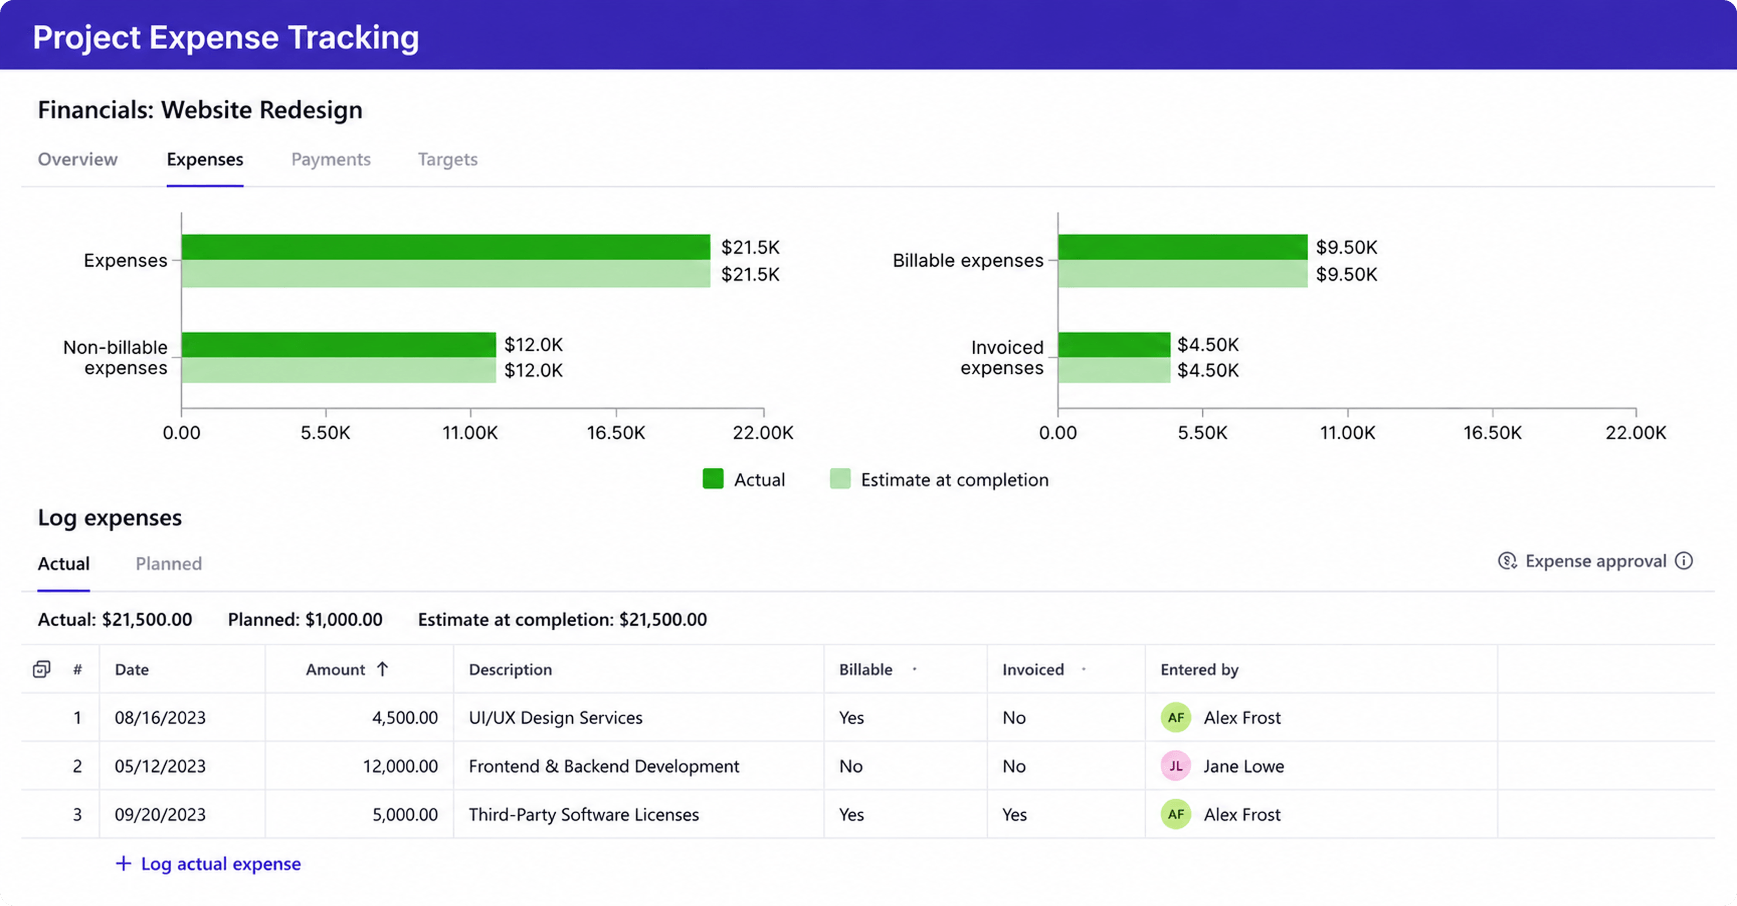
What it shows:
- actual vs planned expenses
- billable and non-billable costs
- invoiced expenses
- expense forecast at completion
- expense entries by project and category
Why it matters:
This dashboard helps finance teams monitor delivery costs and control project spending before budgets are affected. It also improves visibility into reimbursable and non-billable expenses that directly impact project margins.
Executive summary dashboard
Executive summary dashboards provide a consolidated view of financial and operational performance across the organization.
Executive Summary Dashboard
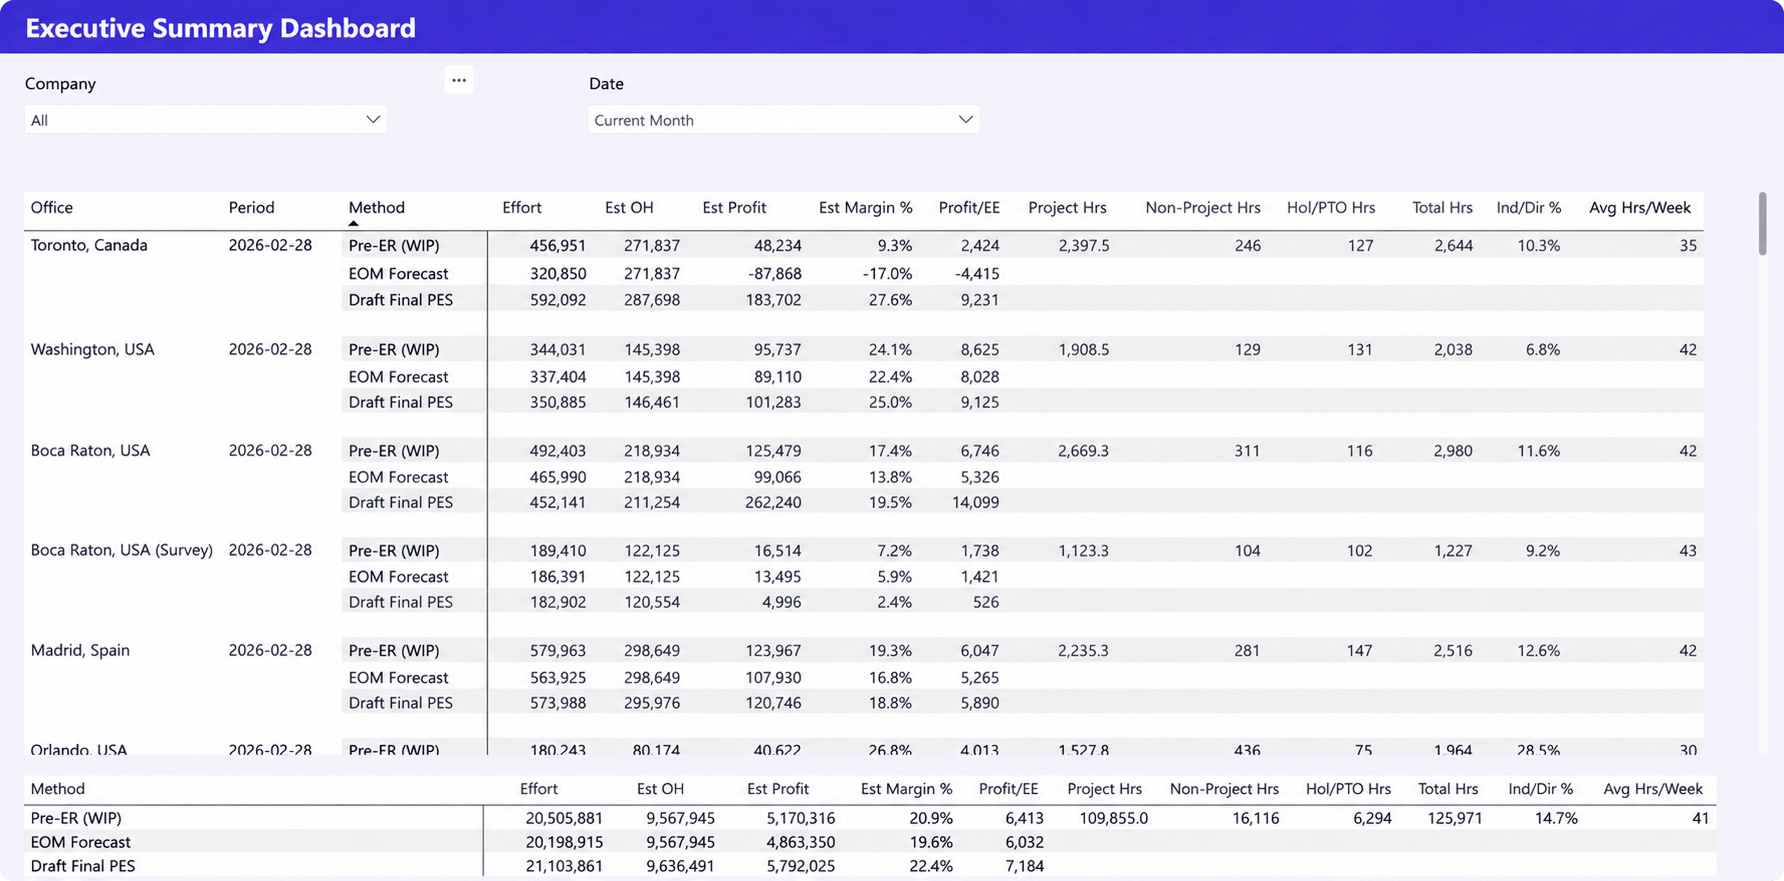
What it shows:
- profitability by office or business unit
- estimated revenue and profit
- project and non-project hours
- utilization and indirect labor ratios
- operational performance across regions
Why it matters:
This dashboard gives executives a consolidated view of profitability, utilization, and operational performance across offices, departments, or regions.
Portfolio financial dashboard
Portfolio financial dashboards help organizations monitor delivery performance, budget allocation, and portfolio financial health.
Portfolio Summary Dashboard
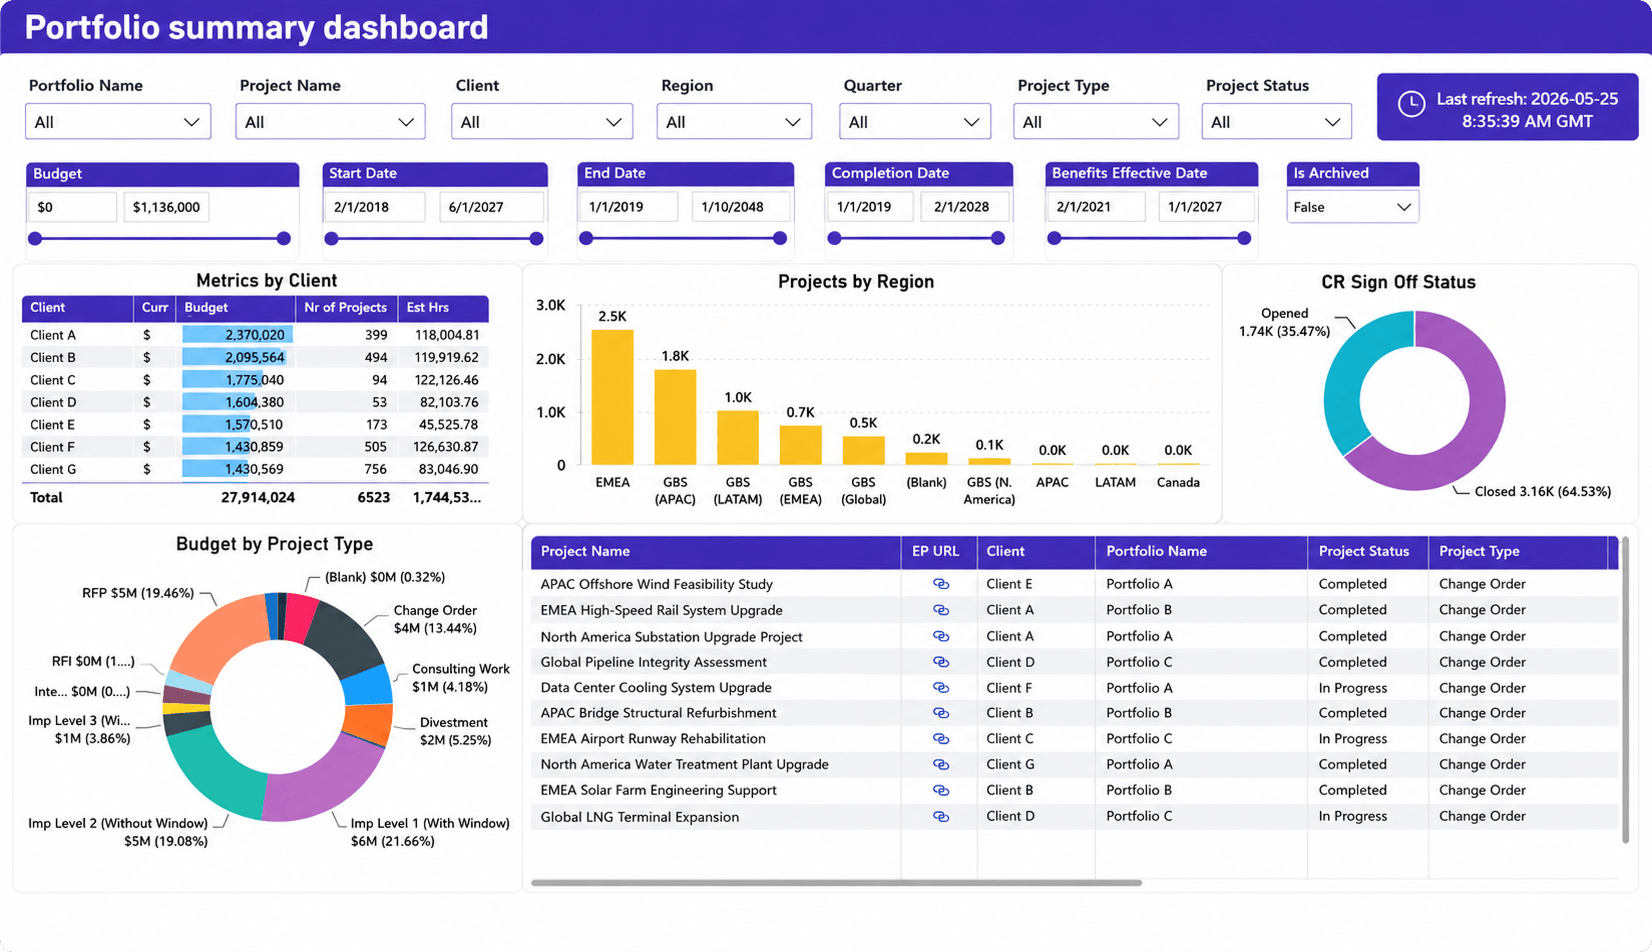
What it shows:
- portfolio budget distribution
- project status across the portfolio
- financial performance by client and region
- project mix by type
- portfolio-level delivery and completion trends
Why it matters:
This dashboard helps executives monitor portfolio financial performance, delivery risks, and resource demand across the organization.
Key metrics every CFO dashboard should include
The most effective dashboards combine financial and operational KPIs into one executive reporting layer.
| Metric category | Why it matters operationally |
| Revenue and backlog | Helps leadership teams understand growth trends and future delivery demand |
| Project profitability | Identifies margin erosion, underpriced work, and high-cost delivery areas |
| Utilization rates | Shows whether delivery teams are generating enough billable capacity |
| Forecast vs actuals | Improves forecasting reliability and planning accuracy |
| Labor and delivery costs | Helps control staffing costs and protect margins |
| Resource capacity | Prevents overbooking, delivery delays, and hiring surprises |
A strong project profitability dashboard should connect labor costs, utilization, project budgets, and revenue into one reporting layer, especially in firms managing multiple billing models.
How CFO dashboards solve common business problems
Strong dashboards improve operational alignment between finance, PMO, and delivery teams.
Faster decision-making
Real-time dashboards help executives identify utilization gaps, delivery risks, and profitability declines before month-end reporting cycles.
Better cost control
Most delivery cost problems start operationally through projects exceeding estimated hours, delayed approvals, overstaffed teams, excessive contractor usage, or unbilled time entries.
Dashboards help surface these issues earlier while corrective action is still possible.
Improved forecasting
Forecasting improves when finance teams can see delivery capacity alongside pipeline and revenue data. Instead of relying only on sales projections, executives can evaluate whether upcoming work is realistically supportable with current staffing levels and delivery timelines.
Increased profitability
Profitability improves when firms gain consistent visibility into staffing efficiency, utilization, project margins, write-offs, and delivery costs.
The biggest operational improvement is usually alignment. Finance, operations, and PMOs begin working from the same data instead of maintaining separate reporting logic.
How to build a CFO dashboard for professional services
Building an effective dashboard starts with operational data structure, not visualization design.
Define your data sources
Most executive dashboards combine project financials, time tracking, resource planning, accounting data, and CRM pipeline data. The challenge is usually consistency between systems.
Many firms discover that utilization, revenue, and profitability calculations differ across finance and operations teams because the systems were never fully connected.
This is one reason PSA platforms have become increasingly important in professional services reporting environments.
Align metrics with business goals
The dashboard should reflect the organization’s operating model.
For example:
- consulting firms often prioritize utilization and billable capacity
- agencies focus heavily on retainer profitability
- engineering firms rely more on long-range resource forecasting
Tracking every available KPI usually creates noise instead of clarity.
Design for executive use
Executive dashboards should help leadership teams identify risks and make decisions quickly. In practice, dashboards become less useful when they prioritize complex filtering and dense visualizations over operational clarity.
The most effective dashboards emphasize trends and exceptions, reduce unnecessary filtering, surface operational risks clearly, and simplify executive reporting instead of overwhelming users with detail.
Ensure data consistency
A dashboard only works if leadership teams trust the numbers.
Strong reporting environments establish a single source of truth for utilization, labor costs, revenue reporting, project financials, and forecasting assumptions.
Without consistent reporting logic, dashboards become another layer of confusion instead of a decision-making tool.
From spreadsheets to real-time dashboards
Most firms move away from spreadsheets when operational complexity increases.
At smaller scale, spreadsheet reporting often works well enough. As firms grow, the reporting process becomes slower, harder to maintain, and less reliable.
The transition to centralized dashboards usually happens when firms can no longer maintain:
- reliable utilization forecasting
- consistent project profitability reporting
- portfolio visibility
- accurate executive forecasting
Integrated PSA and reporting systems reduce this friction by connecting operational and financial data into one reporting environment.
For example, some firms use Birdview PSA with Power BI to centralize utilization, forecasting, project financials, and executive reporting into one dashboard structure connected directly to project delivery data.
What to look for in tools that power CFO dashboards
Many CFO dashboard problems originate from fragmented operational workflows rather than poor visualization design.
When evaluating systems that support CFO reporting, firms should prioritize integrated project and financial data, resource forecasting, utilization reporting, real-time updates, flexible billing support, reporting integrations, and portfolio visibility.
PSA platforms often provide stronger reporting consistency because operational and financial workflows live in the same environment.
The biggest reporting improvement usually comes from reducing manual reconciliation work between finance and delivery teams instead of simply adding more charts.
FAQ: CFO dashboards
What is a CFO dashboard?
A CFO dashboard is an executive reporting view that combines financial and operational KPIs into one centralized interface. In professional services firms, CFO dashboards typically track profitability, utilization, forecasting, project performance, and revenue trends.
What metrics should a CFO dashboard include?
Most CFO dashboards include revenue, project profitability, utilization, labor costs, forecast vs actual performance, backlog, and resource capacity metrics. The exact structure depends on the company’s service model and operational priorities.
How do you build a CFO dashboard?
Building a CFO dashboard usually starts with consolidating project, financial, time tracking, and resource planning data into a centralized reporting environment. The dashboard should focus on actionable executive metrics instead of excessive operational detail.
Why are dashboards important in professional services?
Professional services firms depend heavily on labor utilization, project delivery efficiency, and forecasting accuracy. Dashboards help leadership teams identify operational risks earlier and improve financial decision-making.
Can dashboards replace spreadsheets?
In many cases, yes. Real-time dashboards reduce manual reporting work and improve data consistency across finance and operations teams. Excel still works well for ad hoc analysis, but executive reporting is usually more reliable when dashboards pull data directly from operational systems.