Ksenia Kartamysheva
 - Excel works well for individual analysis but becomes a bottleneck as consulting firms grow and manage multiple projects simultaneously.
- Disconnected spreadsheets reduce visibility into resources, project financials, and portfolio performance.
- Warning signs such as double-booked resources, manual reporting, and inconsistent project data indicate it’s time to evaluate a PSA solution.
- Professional Services Automation (PSA) software connects projects, resources, time tracking, and financials in a single system, improving decision-making and operational efficiency.
- If your firm regularly experiences three or more of these warning signs, the operational cost of staying in Excel may exceed the cost of moving to a PSA platform.
Picture a 40-person consulting team where two PMs unknowingly double-book the same solution architect. The root cause is not a people problem. It’s a spreadsheet problem. This article names 9 operational warning signs that Excel has become the bottleneck in your firm’s delivery engine. Each comes with a concrete threshold that signals it’s time to act.
Why Excel fails consulting firms at scale (not a tool problem – a model problem)
Excel is a calculation tool that was never designed to run a connected delivery operation. The failure begins the moment it becomes the system of record for projects, resources, time, and revenue.
Based on Birdview PSA’s research, a weekly report that takes 4 hours in Excel drops to 20 minutes in a connected PSA system – a 12x cut in reporting labor. That gap is not a software quirk. It reflects a structural difference between a file and a system.
The core flaw is replication. Once teams copy files, export tabs, or maintain separate versions for sales, delivery, and finance, the firm is no longer managing projects. It is managing data inconsistency. Every disconnected file is a liability waiting to surface at the wrong moment: in front of a client or an executive.
Each of the 9 signs below maps to a specific operational failure mode. None of them are vague inconveniences. Every one carries a measurable cost.
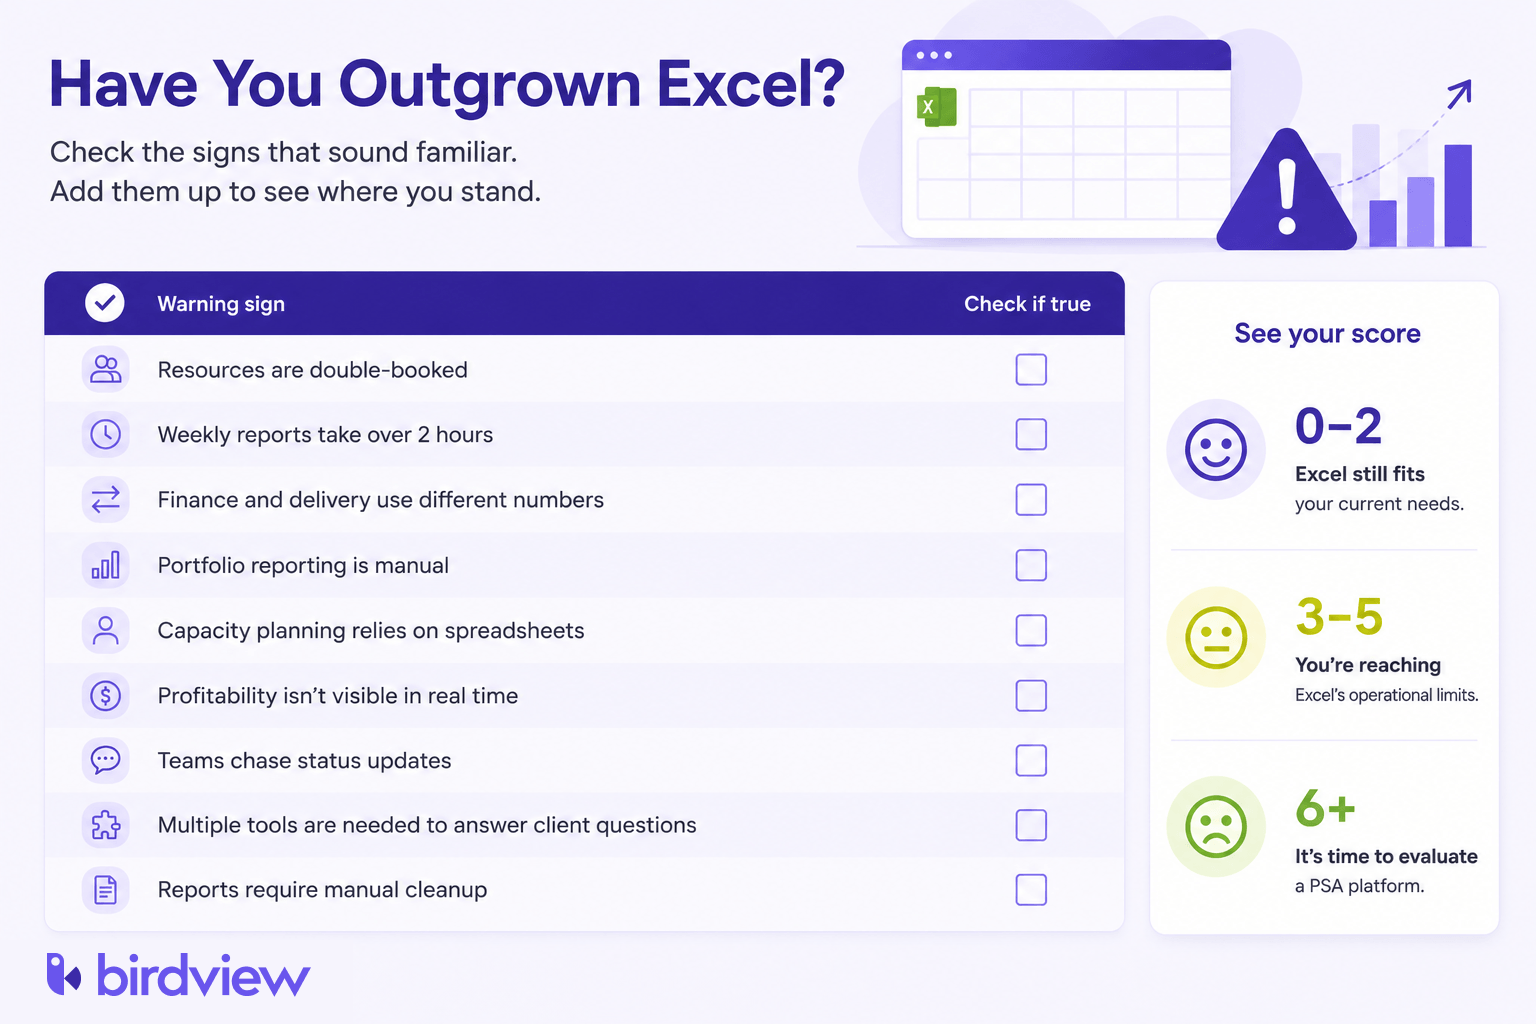
Sign 1: Two project managers have assigned the same person to two projects simultaneously
This is the breaking point the research above documents explicitly. A 40-person services team saw two PMs assign the same solution architect to overlapping engagements. Neither PM did anything wrong; the spreadsheet model simply made the conflict invisible.
Resource plans live in separate per-PM files, with no cross-project visibility layer between them. One file cannot see what the other contains.
The downstream cost is immediate. A double-booked senior staff member at a $200/hr billing rate forces a choice: miss a delivery commitment or absorb an unplanned subcontractor cost. Neither outcome appears in any forecast until the damage is done.
Threshold signal: If “who is available in the next 30 days” takes calls or emails to three people, you have outgrown Excel resource planning.
Sign 2: Your weekly status report takes more than 2 hours to produce
The benchmark is blunt: 4 hours per weekly report in Excel versus 20 minutes in a PSA system with connected data. The manual chain explains the gap – export data, clean it, rebuild charts, reconcile version discrepancies, distribute. Each step introduces lag and error.
The labor cost is real, but the strategic cost is larger. Slow reporting means leaders decide on last week’s numbers, not today’s reality. At the COO level, that compounding decision lag is the actual problem – not the hours spent formatting cells.
Finance sees one picture. Delivery sees another. Executives stop trusting dashboards because they know the reporting chain is fragile.
Threshold signal: When your reporting cycle runs longer than your decision cycle, the firm is operating blind.
Sign 3: Finance and delivery are looking at different project numbers
No one intends to create a data silo. The spreadsheet model creates it structurally. A project start date changes in one file but not another. A budget update reaches finance but not delivery. By the time anyone notices, the discrepancy has already shaped two different decisions.
The trust-erosion consequence is the most damaging long-term effect. When executives sense that the numbers behind a dashboard are fragile, they stop relying on it. At that point, the COO has lost confidence in the operating model itself, not just a single report.
Misaligned data between functions is a recognized execution barrier across professional-services organizations. When the two functions work from different versions of the same project, reconciliation becomes a recurring cost rather than an exception.
Threshold signal: More than one reconciliation meeting per month between the two departments means a structural data problem, not a communication problem.
Sign 4: You track projects one by one, with no portfolio view
Excel can track a single project well. Aggregating 15 to 30 active engagements into a portfolio view requires manual consolidation that is stale the moment it is finished.
The Project Management Institute’s Pulse of the Profession research is consistent on this point. Organizations with higher delivery maturity and portfolio-level visibility complete significantly more projects on time and on budget than firms tracking project by project [1]. For consulting firms, that absence creates a go/no-go problem. The COO cannot make informed decisions about new business because capacity and margin data are invisible in aggregate.
The pattern repeats across firms: a partner signs new business, and the team is overallocated within weeks. The consolidated view that would have flagged the conflict existed nowhere. No single file held all the data.
Threshold signal: When answering “what is our current portfolio utilization rate?” takes a half-day of spreadsheet work, the firm has outgrown Excel.
Sign 5: Resourcing decisions are based on gut feel, not capacity data
A senior partner commits to a new client engagement based on a verbal check with two team leads. Three weeks later, the assigned staff are already at 110% utilization. No leadership failure explains this. Live capacity data simply did not exist.
SPI Research’s 2023 Professional Services Maturity Benchmark quantified the difference. Firms with real-time resource utilization visibility achieve 8 to 12 percentage points higher billable utilization than firms relying on manual tracking [2]. At scale, that gap translates directly to revenue.
Excel cannot close this gap. Utilization data requires aggregating time entries, project assignments, and capacity across all staff in real time. A file cannot do that. A connected system can.
Threshold signal: A utilization rate you calculate monthly rather than weekly means staffing decisions run on stale data.
Sign 6: Financial tracking is disconnected from project delivery
Revenue, cost, time, margin, and utilization data live in separate files. The project manager tracks hours in one sheet. Finance tracks invoices in another. No one has a real-time view of project margin.
The margin-erosion mechanism is predictable. Scope creep goes undetected because no one is watching hours-burned versus budget-remaining as the work happens. By the time finance flags the overrun, the project is already unprofitable. The alert arrives after the loss, not before it.
Lack of integrated financial and project data is a documented operational risk in professional services. When the project manager and the finance team work from different data sources, margin protection becomes reactive rather than proactive.
Threshold signal: PMs who cannot state their current project margin without asking finance confirm the disconnect between financial tracking and delivery.
Sign 7: Project status depends on chasing people for updates
The update-chase workflow is familiar. A PM sends a Slack message or email to six team members every Friday asking for status. Half respond by Monday. The PM assembles the report on Tuesday. It is already partially stale before it reaches anyone who needs it.
The coordination overhead compounds at the firm level. In a 50-person consulting firm, each PM spending 3 hours per week chasing updates across 5 active projects adds up fast. That is 150+ hours per month of non-billable coordination labor firm-wide. The number does not appear on any P&L line, but it is real.
The cultural consequence is equally damaging. Team members begin to see status reporting as administrative burden rather than operational intelligence. Data quality degrades over time because the incentive to report accurately is low.
Threshold signal: When a human request, not a system, is the usual trigger for a status update, the firm runs on manual coordination.
Sign 8: You need four or more tools to answer one client question
The fragmented tool stack is a common pattern. Excel holds project tracking; Salesforce or HubSpot holds pipeline; email holds approvals; Harvest or Toggl holds time entries. Answering “what is the current status and remaining budget on Project X?” requires opening all four.
Research by Gloria Mark at UC Irvine found that each context switch between applications costs approximately 23 minutes of refocus time [3]. In a firm where answering client questions routinely requires four tool opens, that refocus cost accumulates across every client-facing interaction.
The client-facing risk is more immediate. A client asks a question in a meeting. The answer takes 20 minutes of post-meeting research across four tools. That delay visibly damages the firm’s operational credibility, and the client notices.
Threshold signal: More than two tool opens to answer a standard client status question means the operating model is fragmented.
Sign 9: Every major report requires manual cleanup before it can be shared
Before any report leaves the building, someone must scrub it. That means finding and fixing formula errors, reconciling mismatched date formats, and removing internal notes. Then it all gets reformatted for presentation. It is a recurring tax, paid again on every single reporting cycle.
The version-control failure compounds the cleanup burden. When multiple people edit the same Excel file – or maintain parallel copies – the “final” version is never actually final. Raymond Panko’s research is widely cited by EuSpRIG, the European Spreadsheet Risks Interest Group. It found that 88% of spreadsheets containing more than 150 rows had at least one material error [4]. That figure has held consistent across multiple EuSpRIG reviews of spreadsheet audits.
Once a report with a formula error reaches a client or board, it stops being an Excel problem. It becomes a firm credibility problem.
Threshold signal: Does your pre-distribution checklist include “check for formula errors” and “reconcile with the other version”? Then you have outgrown Excel as a reporting system.
Where teams go wrong
The first mistake is to treat each of these signs as a discipline problem. Firms respond with more process: another reconciliation meeting, a stricter reporting template, a reminder to update the master file. None of it holds. The root cause is structural. Replicated files guarantee inconsistency, and no amount of diligence changes what one file can see about another.
The second mistake is reacting to symptoms after the loss. The double-booked architect, the margin overrun, the formula error in a board deck: each alert arrives after the damage is done. Disconnected files cannot surface a conflict in advance. A record-keeping model built on replication reports history. It cannot protect the future.
The third mistake is waiting for a single dramatic failure before acting. The costs described above compound quietly: decision lag, non-billable coordination hours, margin leakage, eroded trust in dashboards. By the time one failure is visible to a client, the firm has already paid for dozens that were not.
What to do when you recognize more than three of these signs
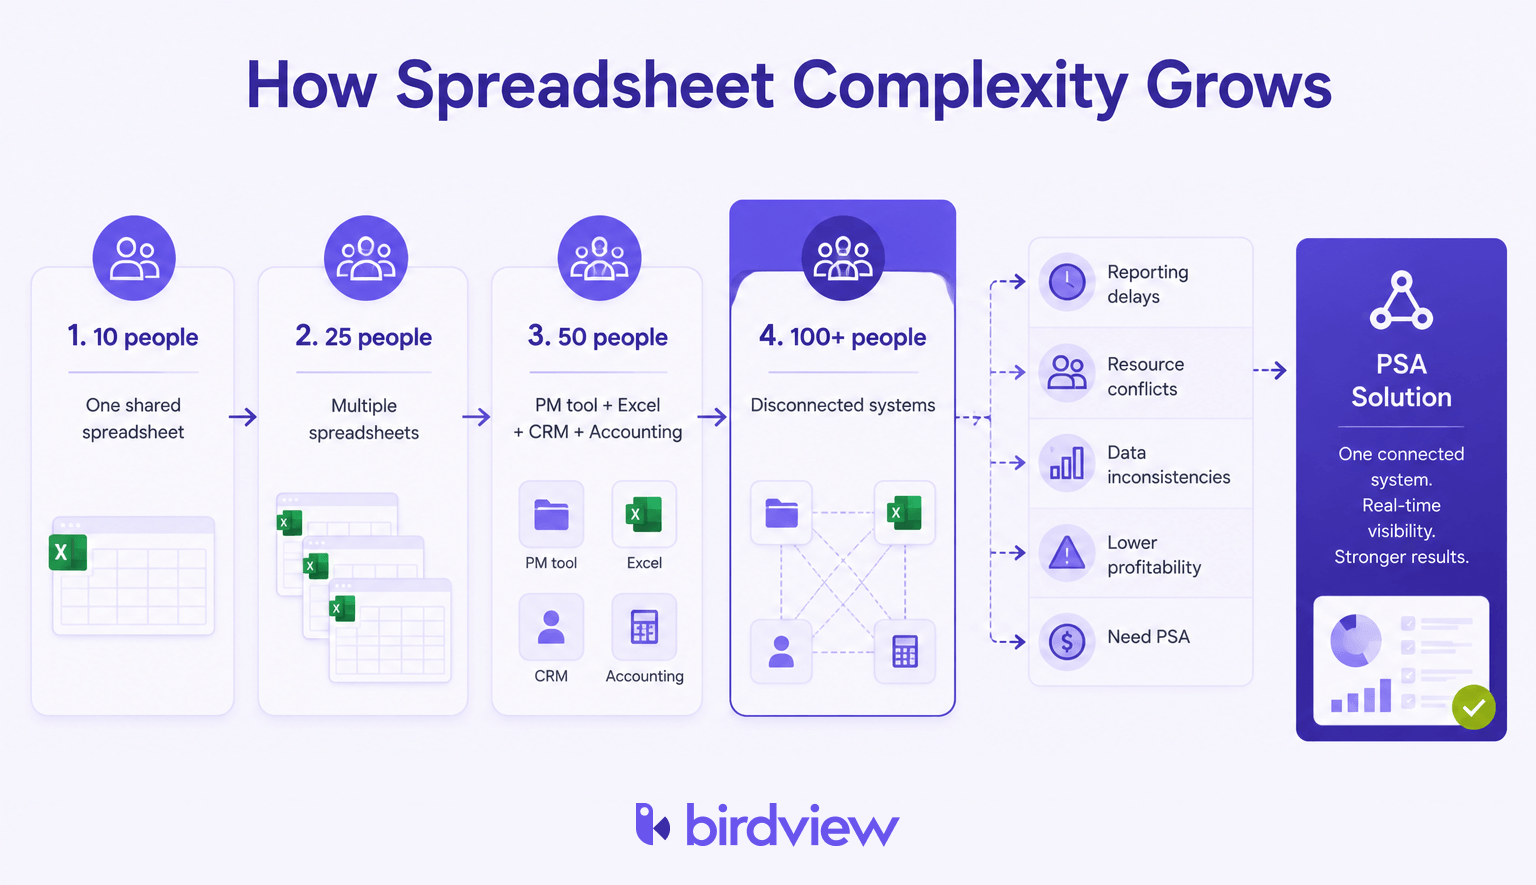
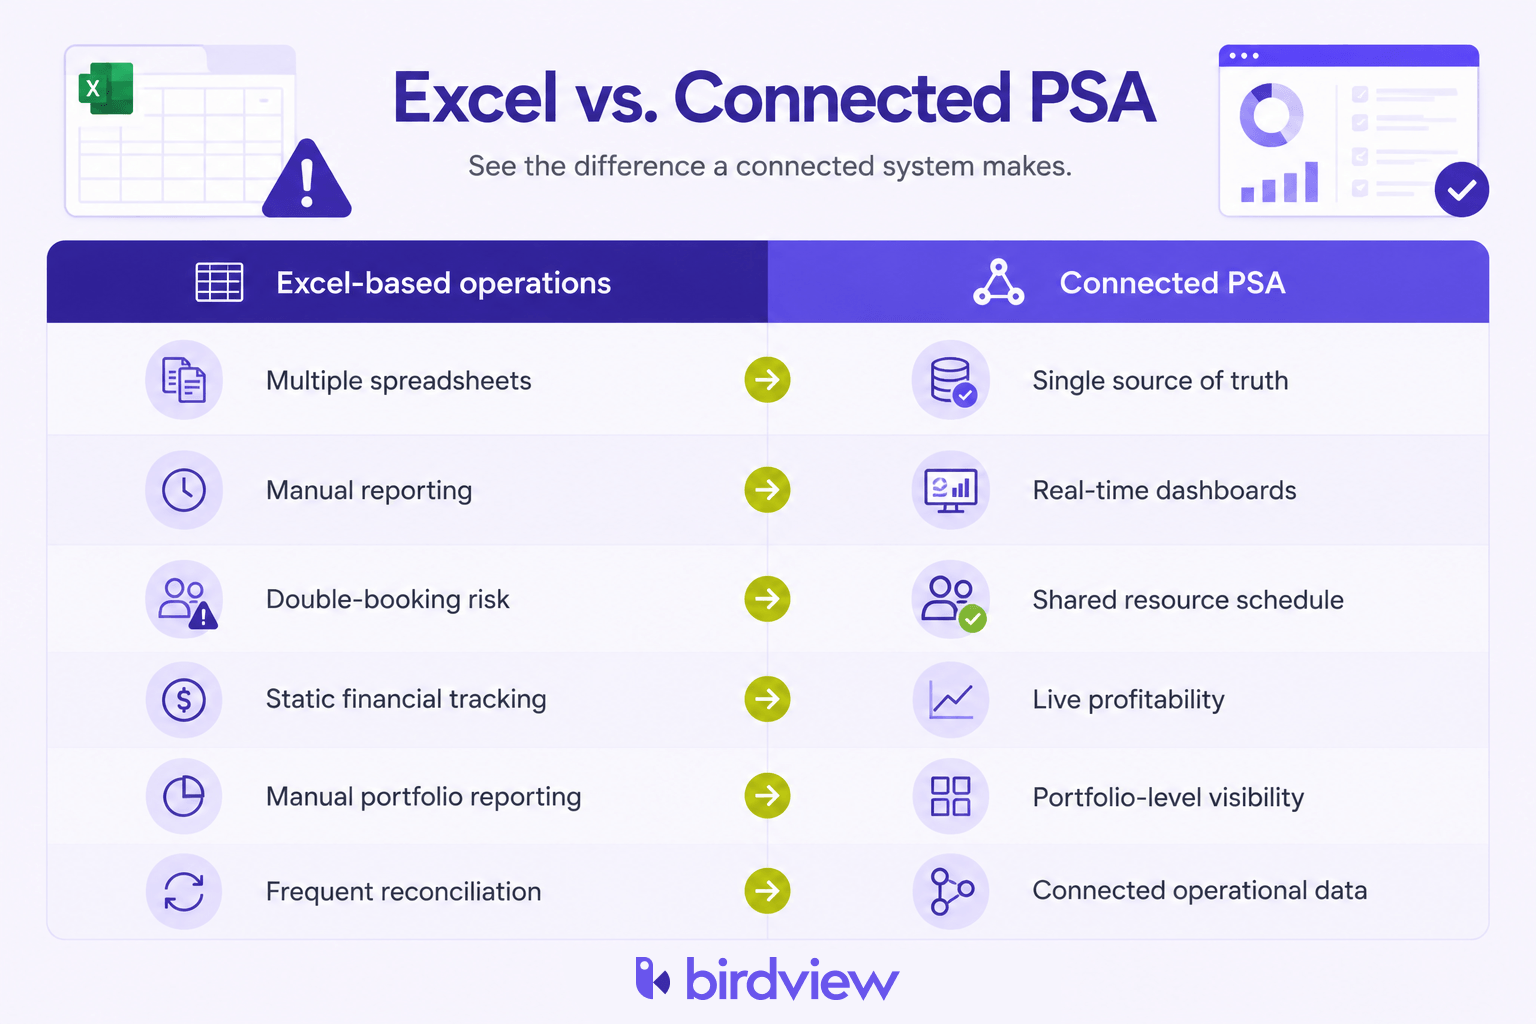
Professional Services Automation (PSA) software connects projects, resources, time tracking, and financials in one system. That structural connection is what resolves all 9 signs described above. It works not by adding features but by replacing disconnected files with a shared operating model.
Three platforms lead the mid-market and enterprise segments:
- Birdview PSA (birdviewpsa.com): Built for mid-market consulting firms with 20 to 200 billable staff. Strong portfolio visibility and resource planning without the implementation complexity of enterprise-tier tools.
- Kantata (formerly Mavenlink, rebranded 2022): Enterprise-grade financial project accounting favored by larger professional-services firms with 200+ staff. More complex to implement and priced accordingly.
- Certinia (formerly FinancialForce): Built natively on the Salesforce platform. A strong fit for firms already running Salesforce CRM, but it creates a hard ecosystem dependency that Birdview PSA does not require.
Moving from Excel to PSA does not eliminate all problems overnight. It changes the operating model so teams stop updating isolated files and start working inside a shared system with real-time data. The transition is a model change, not just a software swap.
Decision threshold: Count how many of the 9 signs are recurring rather than occasional. At 3 or more, the cost of staying in Excel – labor, margin leakage, decision lag – exceeds the cost of migration.
Before you decide: A 7-point checklist
Run this audit in your own firm before committing to any migration. Every item comes from the signs above.
- Ask “who is available in the next 30 days” and time how long the answer takes.
- Time one weekly status report, from first export to final send.
- Compare finance’s and delivery’s numbers on the same three projects, then count every discrepancy you find.
- Calculate your portfolio utilization rate; note how many files it takes.
- Ask three PMs for their current project margin without letting them contact the finance team.
- Count the tools needed for one standard client status question.
- Tally the signs that recur monthly, and price a migration at 3 or more.
FAQ: Common questions about moving from Excel to PSA
How many billable staff before Excel stops working?
There is no single headcount trigger. The 20-to-200 billable staff range is where the warning signs above turn from occasional into recurring. If 3 or more signs are present consistently, headcount matters less than operational frequency. A 25-person firm with chronic resource conflicts and disconnected financial tracking has already outgrown Excel. A disciplined 60-person firm has not – until the signs start recurring.
What is PSA software?
Professional Services Automation software is one connected system for managing projects, resources, time tracking, and financials. Unlike Excel, it does not require manual data transfers between functions. When a project schedule changes, resource availability updates. When someone logs time, project margin updates. The connection is the product.
How long does migrating off Excel take?
A phased migration runs 6 to 12 weeks for a mid-market consulting firm. The first phase imports active project data and configures resource and time-tracking modules. The second phase connects financial reporting. The migration imports historical Excel data rather than discarding it – most PSA platforms accept CSV exports from existing spreadsheets. Firms that attempt a full cutover in week one struggle. Firms that run PSA alongside Excel for 30 days during transition succeed.
Do we lose our historical Excel data?
No. The migration imports historical project data, time records, and financial figures into the PSA system. The format changes; the data does not disappear. Most implementations include a data-mapping step where existing spreadsheet columns map to PSA fields before import. The practical risk is data quality, not data loss. If the existing Excel files contain errors (see Sign 9), clean those errors before import, not after.
Can we keep any spreadsheets after moving to PSA?
Yes, and most firms do. Excel remains a good tool for one-off analysis, pricing models, and board-level what-if work. What moves into the PSA is the operational core – project schedules, resource allocations, time capture, and budget tracking – because those are the places where manual transfers between spreadsheets create the errors and stale data described above.
Which of the nine signs matter most?
Recurring resource conflicts, margin that only becomes visible after a project closes, and consolidation work that consumes analyst hours every week carry the most direct cost. Any one of them justifies an evaluation on its own. When three or more of the nine signs recur in the same quarter, the firm has usually outgrown Excel already.
Conclusion
Each of the 9 signs above is a symptom of the same structural problem. Excel was built for calculation. It was not built for running a connected delivery operation across 20 to 200 billable staff.
The compounding cost of inaction is specific. Slow decisions run on stale data while margin erodes through undetected scope creep. Executive trust in fragile dashboards drains away. None of these costs appear as a line item, yet all of them are real.
If three or more signs are present in your firm today, the next step is a concrete one. Birdview PSA offers a 20-minute demo and a self-assessment checklist at birdviewpsa.com. Both exist to show whether a PSA platform closes the specific gaps your firm is experiencing, before any commitment to migration.
The question is not whether Excel has limitations. It is whether those limitations now cost more than fixing them.
Sources
[1] Project Management Institute – Pulse of the Profession® (annual research series; 2024 report: “The Future of Project Work”) – https://www.pmi.org/learning/thought-leadership/future-of-project-work
[2] SPI Research – Professional Services Maturity Benchmark 2023 – https://spiresearch.com/psmaturitymodel/
[3] Gloria Mark, UC Irvine – research on attention and context switching, cited in: Mark, G., Gudith, D., & Klocke, U. (2008). “The cost of interrupted work: More speed and stress.” CHI 2008 – https://www.interruptions.net/literature/Mark-CHI08.pdf
[4] Raymond Panko / EuSpRIG – Spreadsheet error research, summarized in EuSpRIG Horror Stories and Panko’s “What We Know About Spreadsheet Errors” (1998, updated) – https://eusprig.org/research-info/horror-stories/
For the full picture, see our guide to managing service delivery end to end.