Ksenia Kartamysheva
 - EAC combines actual cost to date with a forecast of remaining cost. Cost to complete is one input into it, not a separate forecast.
- There are three standard EAC formulas: bottom-up (a fresh re-estimate), cost-performance-based (budget at completion ÷ CPI), and combined cost-and-schedule (which also factors in SPI).
- Cost-performance-based EAC is the default for routine monthly forecasting; bottom-up is reserved for at-risk engagements; the combined method applies when a project is both over budget and behind schedule.
- When the three formulas roughly agree, confidence in the forecast is high. A sharp divergence between them is diagnostic: it points to whether the trouble is cost, schedule, or a scope problem the original estimate never anticipated.
- Recalculate EAC at least monthly on active engagements, and immediately after a scope, staffing, or schedule change.
Estimate at completion (EAC) is a forecast of what a project will actually cost by the time it finishes, based on costs incurred so far plus a projection of what remains. There are three standard ways to calculate it, and each one assumes something different about whether current cost or schedule performance will continue. Picking the right formula is itself a diagnosis of what’s actually wrong with the project.
EAC and cost to complete answer related but different questions. Cost to complete is the remaining piece of spend; EAC is the whole forecast, costs already spent plus that remaining piece. Most finance teams meet EAC as a single formula, usually the crude version: money spent so far plus whatever budget is left. That version works fine when a project is running close to plan. It gives a misleading number the moment a project is genuinely off track, because it assumes the remaining work will suddenly cost exactly what was originally budgeted, regardless of how the project has actually been performing.
This guide covers what EAC is, the three formulas finance and PMO teams actually use, when each one applies, a worked example that runs the same project through all three, and how an EAC number should change what a project manager does next, not just what gets reported.
What is estimate at completion?
Estimate at completion is the projected total cost of a project at finish, combining actual costs to date with a forecast of remaining cost. It answers one question: given everything we know right now, what will this project actually cost when it’s done?
The original budget was set with the least information a project will ever have. EAC is the same forecast, rebuilt with everything learned since work started. Once a project is meaningfully underway, a finance lead should trust the EAC over the original budget, because the EAC reflects real cost and schedule performance instead of an early estimate.
Cost to complete is one input to EAC, not a separate concept: EAC is what the project will ultimately cost, and cost to complete is the piece of that total still ahead. The formula for cost to complete itself lives in its own explanation; here it’s treated as a building block.
The three EAC formulas
Each formula makes a different assumption about why a project might be running over budget, and each one is useful for a different kind of project.
Method 1: bottom-up EAC
Formula: EAC = costs incurred to date + a fresh, bottom-up re-estimate of remaining work.
This method throws out the original remaining-budget number entirely and asks the delivery team to re-estimate what’s left, task by task, based on everything they now know about scope and effort. It assumes the original estimate is no longer trustworthy at all, not just running at a steady rate of overrun, but wrong in a way that only a fresh look at the remaining work can fix.
Bottom-up EAC is the right tool for engagements already flagged as at risk, the kind that show up on a delivery dashboard’s at-risk list because the cause of the overrun looks like scope creep or a wrong approach, not a consistent inefficiency you could just extrapolate. It’s also the most accurate method, and the most expensive to produce, since it needs a real re-estimation effort from whoever is running the work. Reserve it for projects that need it. Running a bottom-up re-estimate on every active engagement every month is not a sustainable cadence for most PS finance teams.
Method 2: cost-performance-based EAC
Formula: EAC = budget at completion ÷ cost performance index.
Cost performance index, or CPI, measures how efficiently money has been spent so far: earned value divided by actual cost. A CPI of 1.0 means the project is spending exactly what was planned for the work completed. A CPI below 1.0 means it’s costing more than planned for the same amount of work.
In plain terms: if a project has been running 15% over on every dollar spent so far, this method assumes that rate holds for whatever is left. It’s a pessimistic assumption, but often a realistic one, because cost inefficiency rarely corrects itself without someone actively intervening.
This is the default formula for a routine monthly portfolio sweep across stable, well-understood engagements, the same logic used for choosing a cost-to-complete method: use the fast, mechanical version by default, and reserve the expensive re-estimate for the exception cases.
Method 3: combined cost-and-schedule EAC
Formula: EAC = actual cost + [(budget at completion − earned value) ÷ (cost performance index × schedule performance index)].
Schedule performance index, or SPI, measures whether a project is ahead of, on, or behind its planned schedule, using the same earned-value logic as CPI but comparing earned value to planned value instead of actual cost. An SPI below 1.0 means the project is behind schedule.
This method assumes cost and schedule problems are compounding each other: a project running behind schedule often drives cost up on its own, through overtime, rushed subcontracting, or extended overhead, in a way a cost-only formula would understate. It’s the right formula when both a schedule flag and a budget flag are active on the same engagement at once, the kind of dual-flag situation a delivery dashboard surfaces when it tracks schedule and budget health separately.
This is the formula most PS finance teams will reach for least often. It’s also the one that stops leadership from being blindsided by a budget-only forecast that quietly ignored a schedule problem making things worse.
| Formula | What it assumes | Best for |
| Bottom-up | The original estimate is no longer trustworthy | At-risk engagements needing a fresh scope re-estimate |
| Cost-performance-based | Current cost inefficiency will continue at the same rate | Routine monthly forecasting on stable projects |
| Combined cost-and-schedule | Cost and schedule problems are compounding | Engagements with both a schedule and a budget flag |
Worked example: three formulas, three different answers
Running the same project through all three methods shows why the choice of formula matters, not just as an exercise but as a real diagnostic.
The project: a $150,000 engagement, 40% complete on the original schedule. Actual cost incurred so far is $70,000. Planned value at this point (the work that should have been done by now) is $60,000, and earned value (the work actually done, valued at budgeted rates) is also $60,000. That means the project is on schedule but has spent $70,000 to deliver $60,000 worth of planned work.
Cost performance index: CPI = earned value ÷ actual cost = $60,000 ÷ $70,000 = 0.86. The project is running about 14% over on cost efficiency.
Schedule performance index: SPI = earned value ÷ planned value = $60,000 ÷ $60,000 = 1.0. The project is exactly on schedule.
Bottom-up EAC: the delivery team re-estimates the remaining work at $95,000 based on what they now know about the scope, instead of trusting the original remaining budget of $80,000. EAC = $70,000 + $95,000 = $165,000.
Cost-performance-based EAC: EAC = budget at completion ÷ CPI = $150,000 ÷ 0.86 = $175,000.
Combined EAC: EAC = $70,000 + [($150,000 − $60,000) ÷ (0.86 × 1.0)] = $70,000 + $105,000 = $175,000. With SPI at 1.0, the combined formula collapses to the same number as the cost-performance formula, which is exactly what should happen when schedule isn’t the problem. The formulas aren’t arbitrary; they converge when the extra assumption a method makes doesn’t apply to the project in front of you.
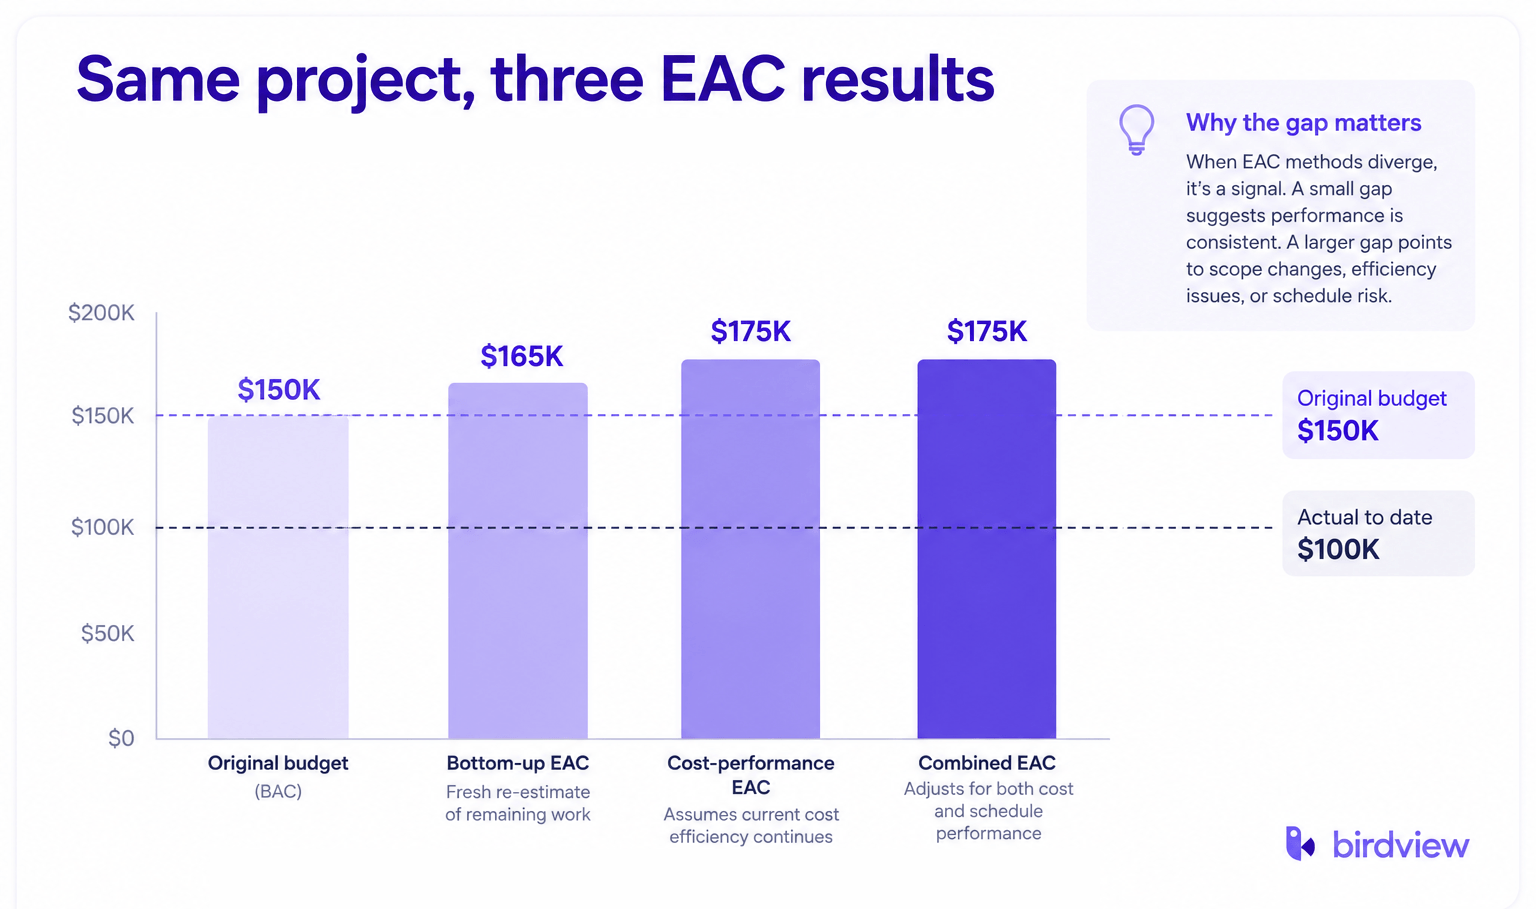
The gap that matters here is between $165,000 and $175,000. The delivery team’s fresh estimate is $10,000 more optimistic than the historical cost-performance run rate suggests. That $10,000 gap is a real conversation: either the team has identified something that will genuinely change the trajectory, or the historical run rate is the more reliable number and the re-estimate is underestimating how hard the remaining work will be. Neither number is automatically right. The disagreement between them is the useful signal.
EAC vs. the original budget: the conversation it should change
EAC’s value isn’t the number itself, it’s the decision that number forces. A project sitting 15% over its EAC at 40% complete needs an active management conversation now. The same 15% gap discovered at 95% complete is just a closeout report; there’s nothing left to manage.
Set a real threshold for when an EAC gap moves a project from routine monitoring to active management, the same threshold logic that shows up on a portfolio’s KPI dashboards: a small, stable variance stays in monitor mode, and a variance that’s growing or crosses a set percentage gets escalated.
EAC also feeds a loop beyond any single project. Rolled up across a portfolio, EAC gaps tell finance whether firm-wide contingency reserves are sized correctly. And a pattern of consistent EAC overshoot on one type of engagement, say every fixed-fee migration project running 12% over its original budget, is direct evidence for repricing or rescoping that engagement type going forward, not just a series of unrelated one-off overruns worth flagging when protecting project margins.
Common mistakes when forecasting EAC
Using the crude shortcut when the situation calls for a real method. Costs incurred plus remaining budget is fine for a healthy project. Applied to a project already showing cost or schedule strain, it produces a number that’s too optimistic to be useful, and the gap only shows up at the worst possible time.
Method-shopping. Picking whichever formula produces the most comfortable number for a status update isn’t forecasting, it’s avoiding the conversation the forecast was supposed to trigger.
Recalculating too rarely. An EAC pulled once a quarter on an active engagement is stale by the time anyone reads it. Monthly, at minimum, on anything already flagged.
Not distinguishing cost trouble from schedule trouble. Using a cost-only formula on a project that’s also behind schedule understates the real exposure, since only the combined method captures cost and schedule problems compounding each other.
A study of 35 completed projects and programs totaling over $21.8 billion in cost, published by Aramali, Gibson, El Asmar, and Sanboskani in the Journal of Construction Engineering and Management (2023), found that projects run with high earned-value-management maturity had 54% less cost overrun against baseline than those with low maturity. The formula matters less than the discipline of actually using one consistently.
Where this leaves you
EAC has three legitimate answers, and the right one depends on what’s actually wrong with the project, not on which formula is easiest to run. When the three methods roughly agree, that agreement is itself useful information: confidence in the forecast is high. When they diverge sharply, the size and direction of that divergence tells you whether you’re looking at a cost problem, a schedule problem, or a project whose original scope needs to be re-examined from the ground up.
If your team is still building bottom-up re-estimates in a spreadsheet every time a project trips a threshold, that’s exactly the manual step live cost-performance data removes. A Birdview demo is a reasonable next step if that’s the bottleneck.
FAQ
What is the formula for estimate at completion? There are three standard formulas: bottom-up (costs incurred plus a fresh re-estimate of remaining work), cost-performance-based (budget at completion divided by cost performance index), and combined (which also factors in schedule performance). Each answers a different question about why a project might be off track.
What’s the difference between EAC and cost to complete? Cost to complete is the remaining piece of spend on a project; EAC is the full forecast, costs already incurred plus that remaining piece. Cost to complete is one input into an EAC calculation, not a separate forecast.
Which EAC formula should I use? Use cost-performance-based EAC as the default for routine monthly forecasting. Switch to bottom-up when a project is already flagged at risk and the cause looks like a scope problem. Use the combined method when a project is behind schedule and over budget at the same time.
How often should EAC be recalculated? At least monthly on any active engagement, and immediately after a scope change, staffing change, or a schedule slip. A stale EAC on a project already showing strain is close to useless by the time it’s read.
Sources
- Project Management Institute, The Standard for Earned Value Management (ANSI/PMI 19-006-2019), 2019. https://www.pmi.org/standards/earned-value-management
- Aramali, V., Gibson, G.E., El Asmar, M., and Sanboskani, H., “Novel Earned Value Management System Maturity Framework and Its Relation to Project Performance,” Journal of Construction Engineering and Management, 2023. https://www.energy.gov/sites/default/files/2023-04/Report%204%20-%20Novel%20Earned%20Value%20Management%20System%20Maturity.pdf