

When you’re responsible for an entire portfolio of projects, knowing what’s going on beneath the surface can be a challenge. You may have timelines, budgets, and resources spread across departments. Each team uses different tools, updates progress at different times, and defines “success” in their way. The result? A noisy mix of data that’s hard to trust and even harder to act on.
Tracking performance across an entire portfolio requires more than basic status reports. It calls for meaningful, well-defined metrics that highlight patterns, surface risks, and connect day-to-day execution with strategic goals. These metrics, or key performance indicators (KPIs), help you step back and see the big picture: what’s working, what’s falling behind, and where to focus next.
This guide walks through how to measure portfolio performance using KPIs that matter. You’ll find clear categories, relevant examples, and practical formulas to support more confident, data-driven decision-making.
Once those KPIs are defined, many consulting firms roll them into a portfolio health score: green, amber, or red, so the PMO and practice leads can see which engagements need attention before the next executive review. Use this metrics chapter together with the project portfolio guide and the project portfolio management process when you want the operating spine behind the score.
What are project portfolio metrics?
Project portfolio metrics are high-level indicators used to measure how well your entire portfolio of projects is performing. Unlike project-level KPIs, which focus on individual timelines, budgets, or deliverables, portfolio metrics take a broader view. They aggregate data across initiatives to help you assess strategic alignment, resource efficiency, and overall business impact.
While project-level metrics might focus on scope, cost, or time, portfolio metrics zoom out to look at how groups of projects are performing relative to each other and to your business objectives. For example, metrics like total portfolio ROI, percentage of projects aligned with strategic goals, or average resource utilization across departments give you insights that aren’t visible when looking at projects in isolation.
Common KPIs to track project portfolio performance
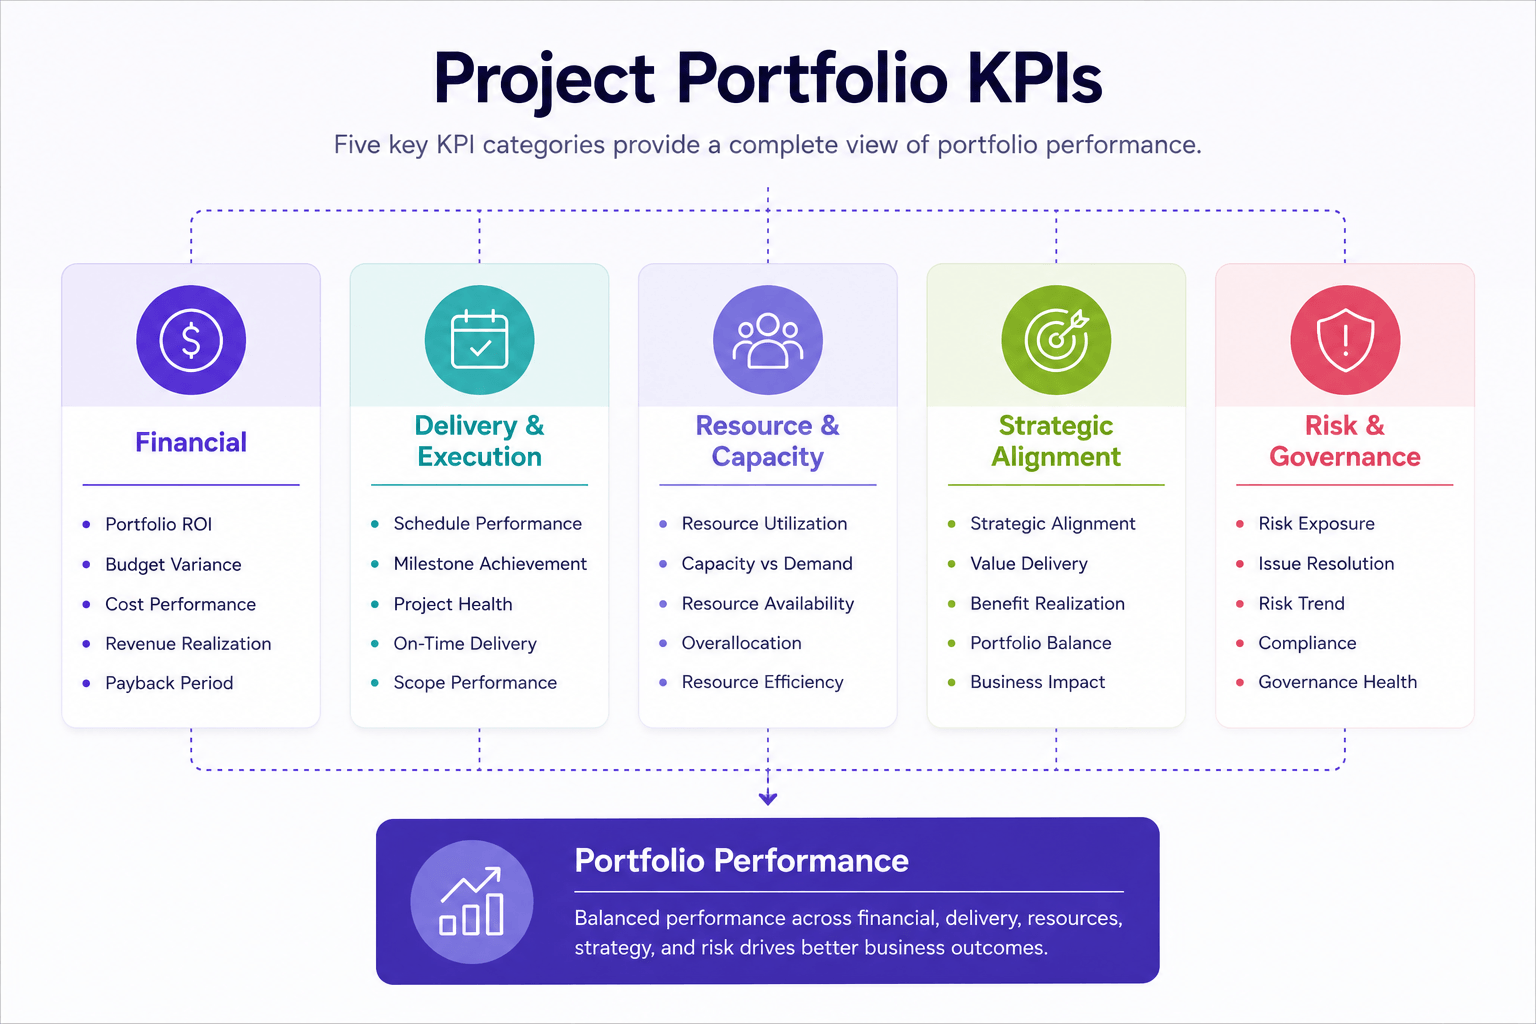
To get a complete picture of how your project portfolio is performing, it’s helpful to track KPIs across multiple categories, not just financials or delivery timelines. Below is a breakdown of essential KPI categories, along with key metrics that can help your PMO or operations team monitor, measure, and optimize performance at the portfolio level.
Project portfolio KPI categories at a glance
Project portfolio performance should be measured across several dimensions rather than through a single metric. The table below summarizes the five main KPI categories, what each category evaluates, and the most useful metrics to track.
| KPI category | What it evaluates | Example KPIs | Key question answered |
|---|---|---|---|
| Financial | Financial health, cost efficiency, and value generated across the portfolio | Portfolio ROI Budget Variance Cost Performance Index Benefit Realization Rate |
Is the portfolio delivering sufficient financial value? |
| Delivery & Execution | Schedule performance, delivery consistency, and milestone completion | Schedule Performance Index On-Time Delivery Rate Project Success Rate Milestone Achievement Rate |
Are projects being delivered successfully and on time? |
| Resource & Capacity | How effectively people, skills, and available capacity are being used | Resource Utilization Rate Capacity vs. Demand Ratio Billable Utilization Team Workload Balance |
Do we have the capacity and skills to deliver planned work? |
| Strategic Alignment | How well projects support business goals, priorities, and expected value | Projects Aligned with Strategic Goals Strategic Contribution Score Portfolio Value by Strategic Area Benefit Realization |
Are we investing in the initiatives that matter most? |
| Risk & Governance | Portfolio risk exposure, issue resolution, and compliance with governance standards | Risk Exposure Index Percentage of High-Risk Projects Issue Resolution Rate Governance Compliance Rate |
Which risks or governance issues require leadership attention? |
1. Financial KPIs
These KPIs measure the financial health and value generation of your project portfolio. Financial metrics help determine whether you’re staying within budget and delivering a strong return on investment.
Portfolio ROI (Return on Investment)
Measures the overall financial return from completed projects in the portfolio.
Budget Variance
Tracks how actual costs compare to planned budgets across all projects.
Cost Performance Index (CPI)
Evaluates cost efficiency. A CPI below 1 indicates the portfolio is over budget, while a CPI above 1 indicates it is under budget.
Benefit Realization Rate
Compares the projected value of a portfolio with the value that has actually been achieved.
2. Delivery & Execution KPIs
These KPIs help you monitor progress, timelines, and delivery effectiveness across all projects in the portfolio.
Schedule Performance Index (SPI)
Indicates how efficiently scheduled work is being completed across projects.
On-Time Project Delivery Rate
Measures the percentage of projects completed on or before their planned deadlines.
Project Success Rate
Measures the percentage of projects that meet the organization’s defined success criteria, such as being completed on time, within budget, and within scope.
Milestone Achievement Rate
Tracks the percentage of key milestones completed according to schedule across the portfolio.
3. Resource & Capacity KPIs
These KPIs focus on how effectively teams, skills, and available capacity are being used across the portfolio.
Measures how much of your available resource capacity is being used.
Capacity vs. Demand Ratio
Assesses whether current resource capacity can meet project demand across the portfolio.
Billable vs. Non-Billable Hours
Indicates how much of the team’s logged time is generating revenue, which is especially important for professional services organizations.
Team Workload Balance
A qualitative or visual KPI that shows how evenly work is distributed across resources and helps identify overallocated or underutilized team members.
4. Strategic Alignment KPIs
These KPIs measure how well the project portfolio supports business objectives and long-term strategic priorities.
Percentage of Projects Aligned with Strategic Goals
Tracks how many active projects directly contribute to defined strategic initiatives.
Strategic Contribution Score
Assigns a weighted score to each project based on its relevance and contribution to key business priorities.
Portfolio Value vs. Strategic Priority Ratio
Compares investment in different strategic areas with their expected value or business impact.
5. Risk & Governance KPIs
These KPIs focus on portfolio risk exposure, issue resolution, and adherence to governance standards.
Risk Exposure Index
Aggregates the probability and potential impact of risks across all projects in the portfolio.
Percentage of High-Risk Projects
Identifies how many active projects exceed the organization’s defined risk threshold.
Issue Resolution Rate
Tracks how efficiently identified issues are being resolved across the portfolio.
Governance Compliance Rate
Measures how consistently projects follow internal controls, reporting standards, approval processes, or audit requirements.
What is portfolio health scoring?
Portfolio health scoring turns selected project KPIs into one comparable status, usually green, amber, or red, so the PMO, CFO, and practice leads can scan dozens of engagements without reading every status note. The score does not replace individual KPIs; it answers whether a project is on track, at risk, or failing the firm’s published floors.
Consulting firms use it because sold work, staffing, and margin move faster than monthly narrative reports. SPI Research’s 2026 Professional Services Maturity Benchmark draws on 509 professional services organizations. In that same benchmark, Level 5 firms report about 42% more billable utilization than Level 2 peers [1]. Under that pressure, one shared band for margin, schedule slip, and capacity strain beats hallway grading. Inputs, weights, and band rules must be the same for every practice.
Which metrics go into a portfolio health score
Most mid-size services firms use four inputs: margin (or forecast margin), schedule performance, delivery or commercial risk, and utilization (or staffing coverage). Strategic alignment and governance often sit as gates or commentary rather than as every weighted factor.
| Score input | Common source metrics | What “good” usually means |
|---|---|---|
| Margin | Forecast project margin %, budget variance, CPI | Forecast margin stays at or above the sold floor |
| Schedule | SPI, milestone achievement, on-time delivery trend | Critical milestones and end date stay inside tolerance |
| Risk | Open high risks, aging issues, change-order backlog | No unresolved red risks past the published age limit |
| Utilization / staffing | Billable utilization, capacity vs. demand, overallocation | Required roles covered without chronic overtime |
Four factors create decisions; eight create debate. Add a fifth only for a hard commercial rule (for example, unsigned SOW after kickoff) that must force red.

Pull numbers from the same time, plan, and financial systems used for KPI tracking. A side spreadsheet will disagree with the dashboard the CFO opens in review.
What makes a project score red in portfolio health scoring
Red means a published floor is broken, not a vague uneasy status call. Amber warns; red escalates with a named owner and next action.
Common red triggers: forecast margin below the absolute floor; critical-path or SPI miss past the amber window; high-impact risk past the age limit or client stop-work; required roles unfilled for the next planning window; unsigned change order while work continues, or billing holds without a recovery plan.
One red input usually paints the project red (“worst-band wins”), so healthy utilization cannot hide collapsing margin. Only a named practice lead or portfolio board clears red to amber after evidence is logged on the project record.
How to weight margin, risk, schedule, and utilization
Write weights once with the CFO and PMO, share with practice leads, and revisit quarterly.
| Input | Suggested weight | Why it sits there |
|---|---|---|
| Margin | 30 to 35% | Protects contribution and CFO confidence |
| Schedule | 25 to 30% | Client trust and capacity plans depend on dates |
| Risk | 20 to 25% | Catches issues before they become write-offs |
| Utilization / staffing | 15 to 20% | Links delivery to the firm’s billable engine |
Normalize each input, multiply by the weight, sum to a composite, map to bands (for example, 80 to 100 green, 60 to 79 amber, below 60 red), and keep “any red input = red project” on top. Publish the table with executive reporting. Do not weight utilization so heavily that a fully billed, money-losing project stays green, SPI’s maturity gap on billable utilization is the industry hint [1].
How often should ops update portfolio health scores
Weekly ops refresh, monthly executive board, ad-hoc when a red trigger fires.
| Cadence | Owner | Purpose |
|---|---|---|
| Weekly | Ops / PMO | Recompute from live time, schedule, and financial data; triage amber and red |
| Monthly | Practice leads + portfolio board | Review band mix; approve stay/pause/stop |
| Ad-hoc | Project manager + practice lead | Recalculate on margin breach, client stop, or key resignation |
Daily scoring is usually noise; quarterly-only is too slow.
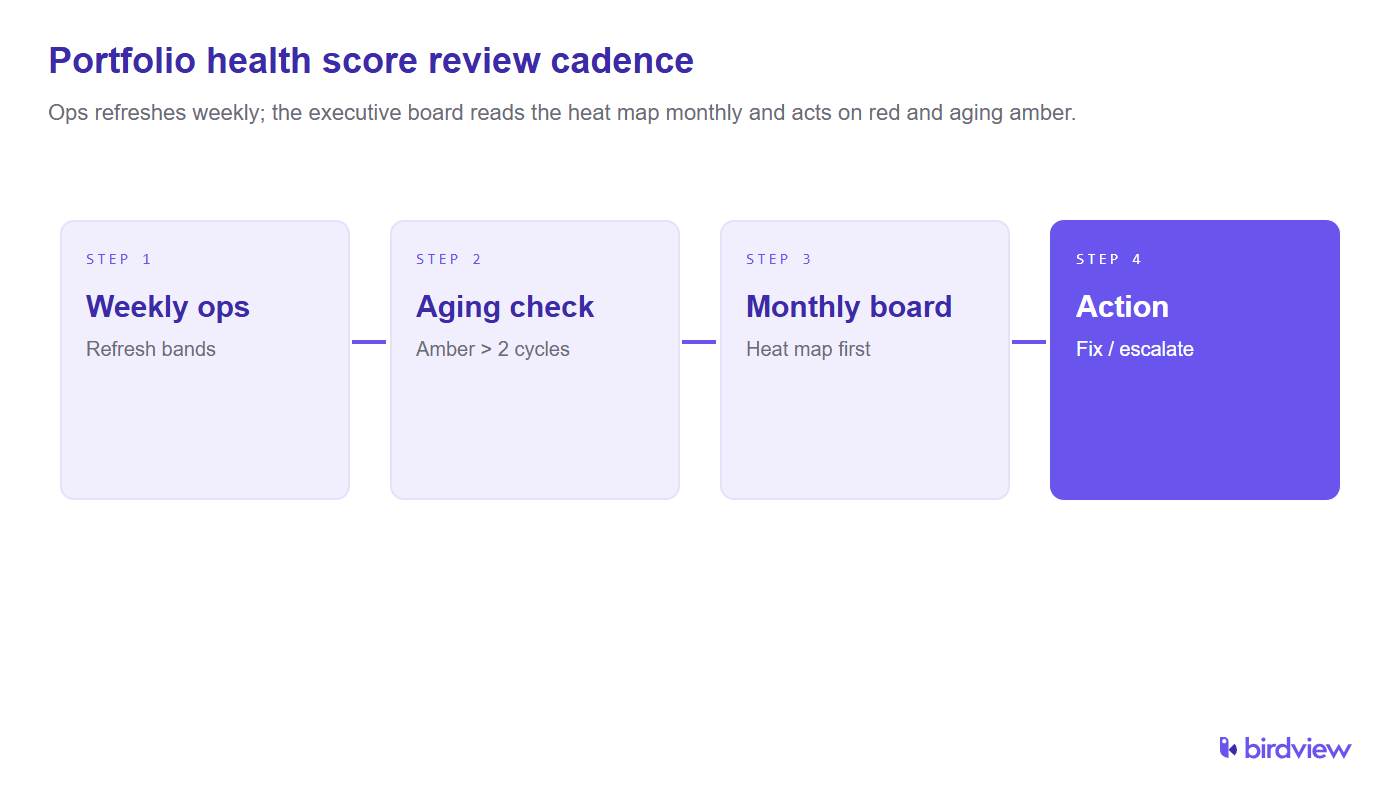
Put both dates on the same portfolio calendar used for KPI reviews so the board never reads stale bands.
How executives use portfolio health scores in reviews
Open with the band mix by practice, then drill into red and aging amber only. The packet needs a heat map, a red list with owner/trigger/ask, amber older than two refresh cycles, trends for the worst practices, and decisions logged since the last meeting.
PMI research frames portfolio governance as more than oversight of live work: it runs end to end from ideation and selection through delivery [2]. Health scores are the in-flight signal that governance board uses when sold demand and capacity diverge.
Pair the heat map with executive reporting for project portfolios so the board deck and ops dashboard share definitions. Answer “are we healthy?” with the band mix and the action list.
What to do when portfolio health scoring shows many amber projects
Treat a spike as an ops problem first: segment new vs. aging amber; find shared causes (scarce roles, change-order backlog, client delays); cap new starts in the worst practices; force stay / fix / escalate on aged amber; review thresholds only after triage. Do not widen green until the heat map looks calm.
How to build a simple portfolio health scoring model for a mid-size firm
- Pick four inputs: margin, schedule, risk, utilization/staffing.
- Name one source metric each.
- Publish green / amber / red floors and the composite band map.
- Set weights in a one-page table (PMO + CFO).
- Add hard red overrides (unsigned change order with work continuing; client stop-work; margin below absolute floor).
- Assign owners: PM maintains inputs; ops refreshes weekly; practice lead owns amber/red actions.
- Wire scores to live PSA project, time, and financial fields.
- Pilot one practice for 60 days, then expand.
A mid-size firm (roughly 50 to 150 delivery people) rarely needs more than four weighted inputs and three hard overrides.
Can PSA automate portfolio health scoring from live project data?
Yes, when margin, schedule, risk flags, and utilization share one engagement record and band rules sit in the reporting layer.
Require: financials from time and expenses; schedule fields for SPI or milestones; risk/issue age and severity; utilization and staffing by role; dashboards that recompute green / amber / red; an audit trail for clearing red. Define formulas once as custom KPIs, map to bands, and refresh on the weekly cadence, without pasting numbers into slides the night before the board.
Not all metrics are equally useful. Good KPIs for project portfolio management are those that focus on strategic impact rather than day-to-day execution. A helpful KPI should be specific enough to guide action, measurable over time, and tied to a broader business objective. If it’s too narrow, it may not give you the portfolio-level insight you’re after. If it’s too general, it risks becoming background noise.
Strong KPIs also need to be consistent across teams and projects so data can be compared and trends can be identified. And finally, they should be understandable to both technical and non-technical stakeholders. If you can’t explain why a KPI matters in a meeting with senior leadership, it may not be the right one to track.

How to implement KPI tracking in your portfolio management process
Tracking KPIs effectively starts with setting clear goals. What do you want your portfolio to achieve? Growth, efficiency, innovation, risk reduction? Once you’ve identified that, you can select KPIs that reflect progress toward those outcomes.
The next step is to ensure you have access to accurate and timely data. This typically involves consolidating data from multiple sources, such as project plans, time tracking, and financial systems, as well as standardizing the recording process. If your data isn’t reliable or consistent, your KPIs won’t be either.

Once you have all the data, you need to present KPI insights to stakeholders and team members in a clear and concise format. It fosters a culture of transparency and accountability across and beyond your organization.
It also helps to set benchmarks or thresholds so that you can quickly see whether a KPI signals success, concern, or something in between. Over time, establish regular review cycles, monthly or quarterly, to assess performance trends and make course corrections as needed.
Map those thresholds to green, amber, and red score bands so the same number that triggers a KPI warning also updates the portfolio health score, without a second set of rules for executive reviews.

How Birdview PSA tracks project portfolio KPIs
Once you’ve identified the KPIs that matter most, the next challenge is collecting and monitoring them consistently. Birdview PSA centralizes project, resource, and financial data in a single platform, making it easier to track portfolio KPIs without relying on spreadsheets or manual reporting.
With Portfolio Dashboards, you can visualize key metrics like on-time delivery rates, budget variance, and task progress in a single view. These dashboards are configurable by user role, so executives can see high-level trends, while project managers track day-to-day performance.
The Business Intelligence (BI) module allows you to build interactive reports using drag-and-drop functionality–no technical skills or SQL required. You can display KPIs such as overall resource utilization, revenue per project, project health by strategic initiative, or ROI trends by department. Filters make it easy to break down metrics by portfolio, team, client, or timeframe.
Birdview also includes custom KPIs, so you can define the metrics that matter most to your business, whether it’s forecast accuracy, margin by service type, or SLA compliance. You can build formulas directly within the reporting interface and reuse them across dashboards.
Because Birdview integrates with your CRM and accounting tools, you can include sales pipeline data, client billings, or actual costs alongside delivery metrics. This gives teams a more complete, real-time view of both project outcomes and business impact, helping you spot risks early, identify inefficiencies, and make faster, data-backed decisions.
The same live project, time, and financial data can feed portfolio health scores: define the weighted inputs once, map them to green / amber / red bands, and refresh the heat map on your ops cadence without rebuilding the packet in a spreadsheet.
Common project portfolio KPI tracking challenges and solutions
Portfolio KPI tracking can provide valuable insights, but only when metrics are clearly defined, consistently measured, and connected to business objectives. The table below summarizes common challenges, their impact, and practical ways to address them.
| Challenge | Impact | How to address it |
|---|---|---|
| Tracking too many KPIs | Creates information overload and makes it difficult to identify which metrics require attention. | Prioritize a focused set of KPIs that directly support strategic goals and executive decision-making. |
| Inconsistent or inaccurate data | Produces unreliable portfolio insights and reduces stakeholder confidence in reports. | Standardize data collection, connect key systems, automate updates, and define clear ownership for data quality. |
| Unclear KPI definitions | Causes stakeholders to interpret the same metric differently and reach conflicting conclusions. | Document each KPI’s definition, formula, data source, reporting frequency, owner, and target threshold. |
| Metrics without business context | Shows that performance has changed without explaining why it changed or what action is required. | Add benchmarks, trends, commentary, drill-downs, and recommended actions alongside numerical results. |
| Outdated KPIs | Keeps teams focused on metrics that no longer reflect current business priorities. | Review the KPI set quarterly or semi-annually and replace metrics that no longer support strategic objectives. |
| No targets or thresholds | Makes it difficult to distinguish acceptable performance from emerging risk. | Set targets, warning ranges, and escalation thresholds for every KPI that requires action. |
| Manual and delayed reporting | Leaves leaders working with outdated information and slows down corrective action. | Use centralized portfolio management software and automated dashboards to keep KPI data current. |
| Metrics that do not lead to action | Turns KPI reporting into a passive status exercise rather than a decision-making process. | Connect every KPI to an owner, review cycle, decision, and predefined response when performance falls outside the target range. |
Successful portfolio KPI management is not just about measuring performance. It requires consistent data, clearly defined metrics, regular reviews, and a reporting process that turns insights into action. By addressing these common challenges, organizations can build KPI reporting that supports better portfolio decisions and long-term business success.
Measure your project portfolio performance with Birdview
Using a mix of KPIs from each of these categories helps ensure a well-rounded view of portfolio performance. Rather than focusing solely on budget or timeline, you’re capturing all key dimensions for making informed decisions at the portfolio level, such as value, efficiency, strategic alignment, and risks.
If you’re using a platform like Birdview PSA, you can track many of these KPIs in real time. Through dashboards and customizable reports, you can pull data directly from project, resource, and financial modules.
Project portfolio management process
Executive reporting for project portfolios
FAQ
Why do consulting firms score portfolio health?
So the PMO, CFO, and practice leads can compare engagements on one green / amber / red scale when sold work, staffing, and margin move faster than narrative reports. SPI’s maturity gap on billable utilization across 509 organizations [1] is the industry hint that shared early-warning bands matter.
Which metrics go into a portfolio health score for projects?
Margin (or forecast margin), schedule performance, delivery or commercial risk, and utilization or staffing coverage. Strategic alignment and governance often sit as gates or commentary.
What makes a project score red in portfolio health scoring?
A published floor is broken: margin below the absolute limit, critical schedule miss, aging high-impact risk, unfilled required roles, or broken commercial paperwork such as unsigned change orders with work continuing. One red input usually paints the project red.
How to weight margin, risk, schedule, and utilization in portfolio health scoring?
Start near margin 30 to 35%, schedule 25 to 30%, risk 20 to 25%, utilization/staffing 15 to 20%. Keep a hard override so any red input can force a red project.
How often should ops update portfolio health scores?
Weekly ops refresh plus monthly executive board for most mid-size firms, with ad-hoc recalculation when a red trigger fires.
How do executives use portfolio health scores in reviews?
As the agenda filter: heat map first, then red list and aging amber with owners and asks. Green stays out of the deep dive unless a key account needs confirmation. That matches PMI’s end-to-end portfolio governance view from selection through delivery [2].
What should we do when portfolio health scoring shows many amber projects?
Segment new vs. aging amber, find shared causes, cap new starts in overloaded practices, and force stay / fix / escalate on aged amber. Do not widen green just to calm the heat map.
How to build a simple portfolio health scoring model for a mid-size firm?
Four inputs, one source metric each, published floors and weights, hard red overrides, PM / ops / practice-lead owners, live PSA fields, and a 60-day pilot on one practice.
Can PSA automate portfolio health scoring from live project data?
Yes, when project financials, schedule, risk registers, and utilization share one engagement record and band rules recompute in dashboards or custom KPIs when source data changes.
Sources
- SPI Research, 2026 Professional Services Maturity Benchmark (509 organizations; Level 5 vs Level 2 billable utilization gap): https://spiresearch.com/reports/2026-ps-maturity-benchmark/
- Project Management Institute, Governance of Innovation in Portfolios, Programs, and Projects (Knapp, Killen, Stevens, Sankaran, 2019): https://www.pmi.org/learning/library/governance-innovation-projects-programs-portfolios-11796