As a project manager, you understand how important it is to properly manage resources for the success of your projects. Balancing the workload to keep team members engaged but not overwhelmed is challenging, especially given equipment and budget constraints. So, how do you ensure the right resources are available at the right time? The answer lies in effective resource management. Let’s look at how to effectively plan and manage project resources using a Gantt chart. There are many tools available to create a Gantt chart, such as Birdview PSA, Microsoft Project, or Asana. In our examples, we’ll use Birdview PSA, a modern software designed for managing internal company projects and projects in professional services.
Birdview PSA’s interactive Gantt chart is designed for planning projects and managing resources using a convenient visual interface.
How to manage project resources with a Gantt chart
Begin by entering all your project tasks into the software. For each task, specify the duration it will take to complete, identify dependencies between tasks, and set significant milestones to track progress.
By setting milestones at key points in the project, you can monitor progress and control the project schedule. Each milestone establishes a clear goal for the team to strive for and allows you to measure the project’s progress against its plan.
Birdview is equipped with user-friendly features such as drag-and-drop functionality. This makes it easy to rearrange tasks, extend or shorten deadlines, and make other necessary adjustments on the fly. For example, if a task is late, you can simply drag it to a new date and see how it affects the overall project schedule.
Furthermore, Birdview PSA allows you to visualize dependencies by linking tasks together. This ensures that you can see which tasks need to be completed before you start others, which helps avoid bottlenecks.
In addition to task management, you can allocate resources to specific tasks, ensuring that the right people are available when needed. This helps balance resources.
Regularly updating your Gantt chart with actual progress data is important. As you complete tasks, you can mark them, and if any changes occur, and thus adjust the schedule. This dynamic update ensures your project plan is accurate and up to date.
So we see that Gantt Charts are powerful tools that will help you allocate resources efficiently and track progress in real time. Here‘s a guide on how to use Gantt charts for optimal resource management.
Step-by-step guide to managing project resources using Gantt charts
Let’s take a marketing project as an example.
Project Name: Spring Marketing Campaign
Objective: Launch a comprehensive marketing campaign to promote a new product line.
Tasks and Timeline:
- Market Research (2 weeks) – Conduct surveys, Analyze market trends, Identify target audience
- Content Creation (3 weeks) – Develop campaign strategy, Write blog posts and articles, Create social media content
- Design (2 weeks) – Design promotional materials, Create ad graphics, Develop landing pages
- Ad Placement (1 week) – Set up online ads, Schedule social media posts, Coordinate with media outlets
- Campaign Launch (1 day) – Publish blog posts, Launch social media campaign, Activate and manage PPC ads
- Performance Analysis (2 weeks) – Monitor campaign metrics, Adjust strategy as needed, Compile final report
Implementation in Gantt Chart:
- Market Research: Start Date – Week 1, Duration – 2 weeks, Dependency: None
- Content Creation: Start Date – Week 2, Duration – 3 weeks, Dependency: Market Research
- Design: Start Date – Week 3, Duration – 2 weeks, Dependency: Content Creation
- Ad Placement: Start Date – Week 5, Duration – 1 week, Dependency: Design
- Campaign Launch: Start Date – Week 6, Duration – 1 day, Dependency: Ad Placement
- Performance Analysis: Start Date – Week 6, Duration – 2 weeks, Dependency: Campaign Launch
By entering these tasks, durations, and dependencies into a Gantt chart, you can visually track the progress of all tasks to successfully launch your campaign.
Here’s a step-by-step guide:
Step 1. Define project scope and tasks
Start by clearly defining the project’s goals, deliverables, and boundaries. Break the project down into tasks. Each task should have a clear description and purpose.
Example. In a marketing campaign, tasks may include content writing, design, advertising placement, and performance analysis.
Step 2. Estimate task duration
At this stage, you need to estimate the time to complete each task. Use historical data or consult with team members to make realistic estimates.
Example: It may take two weeks to create content, and one week to place an advertisement.
Step 3. Identify task dependencies
Determine which tasks depend on the completion of the next ones.
Example: Advertising cannot begin until content creation is complete.
Step 4. Create the Gantt chart
Using project management software like Birdview PSA, , input your tasks, durations, dependencies, and milestones to create the Gantt chart. Birdview has a drag-and-drop functionality that makes it easy to adjust tasks and deadlines as needed.
Example: Enter tasks such as market research, content creation, and advertising. Set their duration, establish dependencies, and mark key milestones in the promotional video.
How: Use Birdview PSA’s Gantt chart feature to create a visual representation of your project timeline. This helps to understand the overall progress of the project and the allocation of resources.

Step 5. Assess Resource Availability
Planning resources, especially human resources, is one of the most challenging aspects of project planning..
When planning, it’s important to have a clear understanding of your team’s workload.
Example: Consider our project designer, Max. First, we check if Max can handle more tasks. We look at his current assignments and upcoming deadlines. If Max is already swamped with work, we then consider assigning the task to Jack, who has fewer assignments scheduled in the next few days.
If our entire marketing team is feeling the crunch, it might be time to bring in additional staff to share the load. Furthermore, we should analyze future projects to determine if more designers will be needed, ensuring we have the right number of people for upcoming tasks.
To manage this effectively, we need project management software with robust resource balancing features. Unfortunately, not all software includes these capabilities, so it‘s essential to choose one that does to avoid overloading team members and ensure smooth project execution. Tools like Birdview PSA, Microsoft Project, or Asana often have these functionalities built in, providing visibility into team schedules and helping prevent resource conflicts.
Use Birdview’s smart resource scheduling and resource planning features to balance resources.
Step 6. Allocate resources to tasks
Assign team members to each task based on their skills, availability, and workload. Ensure that resources are not overloaded and that their assignments align with project priorities.
Example: Assign content writers to create content, designers to handle design tasks, and marketers to handle advertising.
How:In Birdview PSA, use resource planning tools to assign team members to tasks. Monitor their workload to prevent over-allocation of resources and balance the distribution of work.
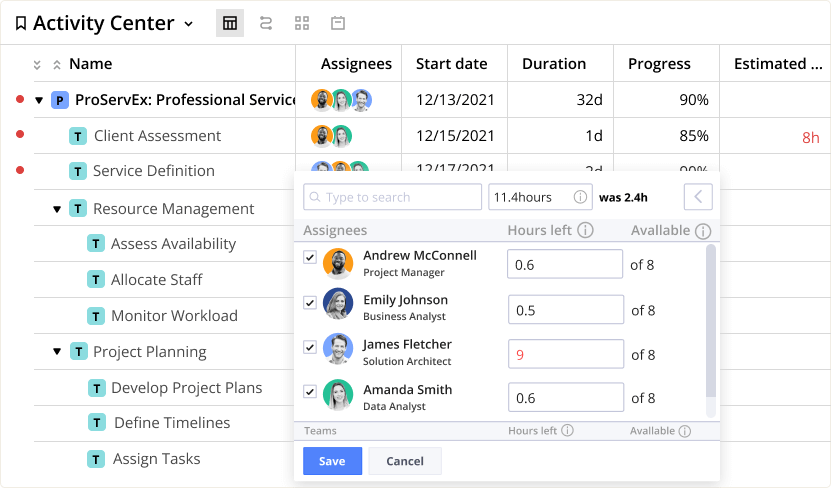
Step 7. Apply hourly capacity planning estimates
Accurate project estimation is the key to success. Overestimation leads to resource downtime, while underestimation leads to delays and stress. Achieving balance is critical.
Using hourly estimates and time tracking in Birdview PSA improves resource management. Here’s how:
Add hourly estimates: To include hourly estimates, input the expected number of hours required for each task into the Gantt chart. This helps in accurately planning and scheduling work.
Breakdown estimates by resource: Distribute the estimated hours among the assigned team members. Allocate specific hours to each person based on their role and availability, ensuring a balanced workload.
For example, if a task is estimated to take 12 hours over 2 days, one person will work 6 hours per day.
Track progress. When team members update their progress, you’ll see whether tasks are being completed on time or behind schedule.
Example: Max has 6 tasks, each lasting 30 minutes (3 hours total), and Donald has 1 task, lasting 8 hours. Max could handle a lot of tasks, but Donald couldn’t.
Hourly estimates ensure logical assignment of tasks and effective workload balancing.
Step 8. Visualize resource allocation
Most Gantt chart tools allow you to visualize resource allocation by showing who is working on what and when. This helps ensure that resources are used efficiently and can highlight any potential conflicts or overallocation.
Example: In Birdview PSA, view the resource allocation section to see which developers are assigned to coding tasks and adjust if anyone is overallocated
Step 9. Monitor progress and adjust
Regularly update your Gantt chart to reflect the actual progress of tasks. Tracking progress in real-time helps identify any delays or issues early, allowing for timely interventions.
Example: If content creation is delayed, update the Gantt chart to adjust the timeline for ad placement and performance analysis accordingly.
How: Use Birdview PSA to track progress in real time. Make necessary adjustments by dragging and dropping tasks in the Gantt chart. Reassign resources if certain team members are falling behind or tasks are taking longer than expected.
Step 10. Adjust timelines and resources as needed
Projects rarely go exactly as planned. Be prepared to adjust timelines and reallocate resources as necessary to keep the project on track.
Example: If a key designer is unavailable due to illness, reassign their tasks to other team members or adjust the project timeline accordingly.
Step 11. Communicate with clients and stakeholders
Use the Gantt chart to communicate the project plan and progress with stakeholders. The visual representation makes it easier for stakeholders to understand the project‘s status and any potential issues.
Example: During project status meetings, share the updated Gantt chart to inform clients of current progress and discuss any necessary adjustments.
How: In Birdview PSA, generate reports and share the Gantt chart with stakeholders. This ensures transparency and keeps everyone informed and aligned.
Read more:
What Are Milestones in Project Management?
Best Practices of Gantt Charts in Management
Online Gantt Chart Maker for Project Management
5 Advantages of Gantt Charts for Marketing Department
Importance of project resource management with Gantt charts
Managing project resources effectively is essential to ensure project success. Gantt charts play a crucial role in this process by providing a clear visual representation of the project timeline and resource allocation. Here’s why they are important:
1. Clear Visualization
Gantt charts offer a comprehensive view of all project tasks, their durations, and dependencies. This visualization helps project managers see the big picture and understand how resources are being utilized throughout the project lifecycle.
Example: In a marketing campaign, a Gantt chart can show when content creation overlaps with design tasks, helping to allocate writers and designers efficiently.
2. Efficient Resource Allocation
With Gantt charts, you can assign resources to specific tasks and monitor their workload. This ensures that no team member is overburdened and that resources are used optimally.
Example: In a legal services project, you can allocate attorneys to case preparation and paralegals to document review, balancing their workloads.
3. Enhanced Communication
Gantt charts serve as excellent communication tools, providing stakeholders with a clear understanding of the project status and resource usage. This transparency helps in managing expectations and keeping everyone on the same page.
Example: During a project update meeting, a Gantt chart can illustrate which tasks are on track and which need more attention, facilitating better decision-making.
4. Real-Time Progress Tracking
Project managers can update Gantt charts in real time to reflect the current status of tasks. This ability to track progress helps in identifying potential delays early and allows for timely adjustments.
Example: If an engineering consulting project faces delays in material procurement, the Gantt chart can be updated to show the impact on subsequent tasks, enabling quick rescheduling
5. Proactive Problem Solving
By using Gantt charts, project managers can foresee potential bottlenecks and resource conflicts. This foresight allows for proactive problem-solving, ensuring that issues are addressed before they escalate.
Example: In an architectural project, if the Gantt chart indicates a clash between design revisions and client presentations, the manager can reallocate resources to prevent delays.
Integrating Gantt charts into project resource management is a game-changer. They provide clarity, improve resource allocation, enhance communication, allow real-time tracking, and support proactive problem-solving.
Benefits of using Gantt charts for resource management
Gantt charts are invaluable tools for project resource management, offering numerous advantages that streamline the entire process. Here are the key benefits of using Gantt charts to manage your resources effectively:
Visual clarity. Gantt charts provide a clear, visual representation of the project timeline and resource allocation. This helps project managers and team members understand the schedule and responsibilities at a glance.
Improved planning. Gantt charts help in planning by breaking down the project into manageable tasks and setting realistic timelines. They make it easier to identify task dependencies and potential bottlenecks.
Efficient resource allocation. By displaying who is working on what and when Gantt charts help ensure that resources are used efficiently. This prevents overallocation and underutilization of resources.
They enhanced tracking and monitoring. Gantt charts allow for real-time tracking of project progress. Project managers can quickly identify delays or issues and make necessary adjustments.
Better communication. Gantt charts are excellent communication tools. They provide a visual summary of the project plan and progress, making it easier to update stakeholders and team members.
Best practices for using Gantt charts in resource management
Gantt charts are powerful tools for resource management, but to maximize their effectiveness, certain best practices should be followed. Implementing these strategies will ensure that your Gantt charts are clear, accurate, and highly useful for your project needs. Here are some best practices to keep in mind:
Could you keep it simple? Don‘t overcomplicate your Gantt chart with too many details. Focus on key tasks and milestones. Use color coding to differentiate between tasks, phases, and resource assignments.
Regular updates. Update your Gantt chart regularly to keep it relevant. Regular updates ensure that the chart reflects the current status of the project and helps in making informed decisions.
Involve stakeholders. Use your Gantt chart to keep stakeholders informed and involved in the project. Regularly share updates and solicit feedback to ensure alignment with project goals.
Maintain flexibility. Be prepared to adjust your Gantt chart as the project evolves. Flexibility is key to accommodating changes in scope, timelines, and resource availability.
Use real-time data. Leverage real-time data for accurate tracking and monitoring. Modern project management tools provide real-time updates, helping you stay on top of project progress and resource utilization.
Focus on the critical path. Identify and focus on the critical path–the sequence of tasks that determine the project‘s duration. Ensure that resources are allocated efficiently to tasks on the critical path to avoid delays.

Key terms and concepts in the article:
What is a Gantt chart?
A Gantt chart is a type of bar chart that represents a project schedule. It lists project tasks on the vertical axis and time intervals on the horizontal axis. Each task is represented by a bar; the position and length of the bar reflect the task’s start date, duration, and end date. By incorporating resource allocation, Gantt charts also show who is working on what tasks and when.
Key components of a Gantt chart:
- Tasks: The activities or work packages required to complete the project.
- Timeline: The period over which the project tasks will be carried out.
- Bars: Visual representations of the tasks, showing start and end dates.
- Milestones: Key dates or events marking significant points in the project timeline.
Resources: The team members, equipment, or materials assigned to tasks.
What is project resource management?
Project resource management is all about ensuring that everything you need for a project–people, equipment, materials, and budget–is planned, allocated, and managed effectively.
Effective resource management means you‘re optimizing efficiency, boosting productivity, and minimizing delays and costs, ensuring your project‘s success.
Key elements of project resource management
- Resource Planning
Resource planning involves identifying the necessary resources for a project and determining how to allocate them effectively. It includes understanding project scope, defining tasks, and estimating the resources needed. - Resource Allocation
Resource allocation is the process of assigning available resources to specific tasks and activities within a project. This ensures that resources are distributed according to project priorities and requirements. - Resource Utilization
Resource utilization measures how effectively allocated resources are used. It assesses the efficiency and productivity of resources in completing assigned tasks. - Resource Scheduling
Resource scheduling involves creating a timeline for resource usage, including when resources will be needed and ensuring their availability. This includes planning work hours, breaks, and equipment use. - Resource Tracking
Resource tracking is the ongoing process of monitoring resource usage and performance. It involves tracking task progress, checking resource availability, and identifying any potential issues. - Resource Optimization
Resource optimization aims to make the best use of available resources. It involves reallocating resources as needed to address bottlenecks or underutilization, ensuring maximum efficiency. - Resource Capacity Planning
Resource capacity planning determines the amount and type of resources needed to meet future project demands. It involves forecasting, analyzing, and planning to ensure sufficient resources are available without overloading or underutilizing them.
Read more:
What is Resource Management
Resource management in project management: process, tools, benefits & technique
What is Resource Utilization and Analysis?
Resource allocation in professional services