- Revenue leakage in professional services is rarely caused by a single issue. It typically results from multiple small operational and financial gaps, including unbilled work, write-offs, scope creep, delayed approvals, and underutilized resources.
- Most revenue leakage starts long before it appears in financial reports. Warning signs often emerge in project delivery, resource management, time tracking, and billing processes while projects are still active.
- Unbilled time, low realization rates, and project margin erosion are among the most common sources of lost revenue. Identifying these issues early can significantly improve profitability.
- Revenue visibility depends on connected operational and financial data. When project, resource, time, billing, and financial information are spread across disconnected systems, revenue risks become harder to detect and address.
- The right dashboards help organizations identify revenue leakage before it affects the bottom line. Visibility into profitability, utilization, forecasting, billing, and project performance enables faster corrective action.
- A small set of KPIs often provides the strongest early warning signals. CFOs and operations leaders should closely monitor realization rate, project profitability, revenue forecast accuracy, billable utilization, project margins, and unbilled time.
- Leading service firms treat dashboards as early-warning systems rather than reporting tools. The goal is not simply to measure performance, but to identify emerging revenue risks while there is still time to act.
Revenue leakage is one of the most common and costly profitability problems in professional services organizations. Unlike declining sales, revenue leakage often occurs after work has already been sold and delivered. Teams complete projects, consultants log hours, resources stay busy, and invoices get sent. Yet expected revenue never fully materializes.
A few missed time entries. A delayed invoice. A project that quietly exceeds budget. A consulting engagement with growing scope but unchanged billing terms.
Individually, these issues may seem insignificant. Collectively, they can reduce profitability by hundreds of thousands of dollars annually.
The challenge is that revenue leakage rarely appears as a single, obvious problem. It is usually hidden across projects, resources, billing processes, and operational workflows.
This is why leading service firms focus not only on financial reporting but also on operational visibility. By monitoring the right metrics and dashboards, organizations can identify revenue leakage early and take corrective action before profits disappear.
What is revenue leakage in professional services?
Revenue leakage occurs when earned revenue is delayed, reduced, or never captured due to operational inefficiencies, billing issues, poor visibility, or project delivery problems.
In professional services organizations, revenue leakage often happens long before finance teams recognize its impact.
Common examples include:
- Unbilled work
- Missed time entries
- Delayed time approvals
- Invoice write-offs
- Scope creep without billing adjustments
- Underutilized billable resources
- Project margin erosion
- Forecasting errors that affect staffing decisions
The important distinction is that revenue leakage is not the same as losing sales opportunities.
The work has already been sold or delivered. The problem is that the organization fails to capture the full value of that work.
Why revenue leakage is difficult to detect
Revenue leakage rarely appears as a single major problem. Instead, it develops through small operational and financial issues that accumulate across projects, teams, and billing cycles. Because revenue is still coming in and projects are still moving forward, these losses often remain hidden until profitability begins to decline.
Consider a consulting firm with 50 billable consultants. If each consultant fails to record just one billable hour per week, the organization loses more than 2,500 billable hours annually. At a blended billing rate of $150 per hour, that represents over $375,000 in potential revenue.
In practice, revenue leakage rarely comes from a single issue. A few missed time entries, delayed approvals, small write-offs, underutilized specialists, and unbilled scope changes may seem insignificant on their own. Together, they can create a substantial profitability gap that remains hidden until margins begin to decline.
Small losses accumulate over time
Most revenue leakage starts with seemingly minor issues: missed billable hours, delayed approvals, unplanned discounts, or additional work that is never billed. Individually, these events have little impact. Collectively, they can create a significant gap between the revenue a firm earns and the revenue it ultimately captures.
Delivery and finance data are disconnected
Many service firms manage project delivery, resource planning, time tracking, billing, and financial reporting in separate systems. Project managers, resource managers, and finance teams each see part of the picture, but no one has complete visibility into how operational issues affect profitability. As a result, revenue leakage often goes unnoticed.
Revenue leakage often hides inside active projects
Revenue leakage usually begins during project delivery, not after project completion. Scope creep, additional effort, budget overruns, and declining margins can develop gradually while a project appears healthy on the surface. Without ongoing visibility, these risks remain hidden until financial performance suffers.
Most firms discover issues too late
Many financial reports are backward-looking. They reveal declining margins, write-offs, or revenue shortfalls after the damage has already occurred. The firms that reduce revenue leakage most effectively are those that identify risks during project execution rather than during month-end reviews.
This is why many service firms are surprised when profitability declines despite strong project demand and healthy revenue growth. The underlying causes are often operational rather than financial, making them difficult to detect without visibility into project delivery, resource utilization, time tracking, and billing performance.
The biggest sources of revenue leakage in service firms
Revenue leakage is rarely caused by a single failure. More often, it results from small issues that occur throughout project delivery, resource management, billing, and financial operations. The following areas are where service firms most commonly lose revenue and profitability.
Unbilled time
Unbilled time occurs when billable work is performed but never reaches an invoice. Missing time entries, late submissions, and inconsistent time tracking can all contribute to lost revenue.
For example, a 50-person consulting firm that misses just one billable hour per consultant each week can lose more than 2,500 billable hours annually. At a blended rate of $150 per hour, that represents over $375,000 in potential revenue.
Low realization rates
Realization measures how much billable work ultimately becomes revenue. A consultant may log 10 billable hours, but only eight are ultimately invoiced after write-offs, discounts, or billing adjustments. Those gaps often accumulate gradually across multiple projects before they become visible in financial reports.
Because realization directly connects delivery activity to revenue generation, declining realization rates are often one of the earliest signs that profitability is slipping. The larger the gap between work performed and revenue collected, the more revenue leakage a firm is likely experiencing.
Delayed time approvals
Many firms cannot invoice work until time entries have been reviewed and approved. When approvals are delayed, billing cycles slow down, cash collection takes longer, and the risk of missed charges increases.
Scope creep without billing adjustments
Projects rarely stay within their original scope. Additional meetings, revisions, support requests, and client-driven changes often increase delivery effort over time.
A few additional review cycles, support requests, or change requests may seem insignificant on their own. Across a six-month project, however, they can consume dozens of hours that were never included in the original budget.
When those changes are not reflected in project budgets or billing arrangements, firms end up delivering more value without generating additional revenue. This makes scope creep one of the most common causes of hidden margin loss.
Margin erosion during delivery
Project margins rarely disappear overnight. Costs increase, timelines expand, and additional resources are assigned over time, gradually reducing profitability.
Underutilized resources
For service organizations, people are the primary revenue-generating asset. When highly skilled employees spend excessive time on internal work, administrative activities, or remain unassigned, potential revenue is lost.
While some non-billable work is unavoidable, persistent underutilization reduces overall earning capacity and puts additional pressure on project margins.
Forecasting inaccuracies
Revenue forecasts influence hiring and staffing decisions. I often see firms hire ahead of expected demand only to discover that projects were delayed or sales opportunities failed to close. The result is excess capacity, lower utilization, and reduced profitability.
The dashboards that help identify revenue leakage early
Most revenue leakage does not begin in financial reports. It starts much earlier through missed time entries, declining utilization, project overruns, approval bottlenecks, and shrinking margins.
The following dashboards help surface these warning signs early by connecting operational and financial data. Instead of showing what has already gone wrong, they help leaders identify emerging revenue risks while there is still time to take corrective action.
Billable vs non-billable dashboard
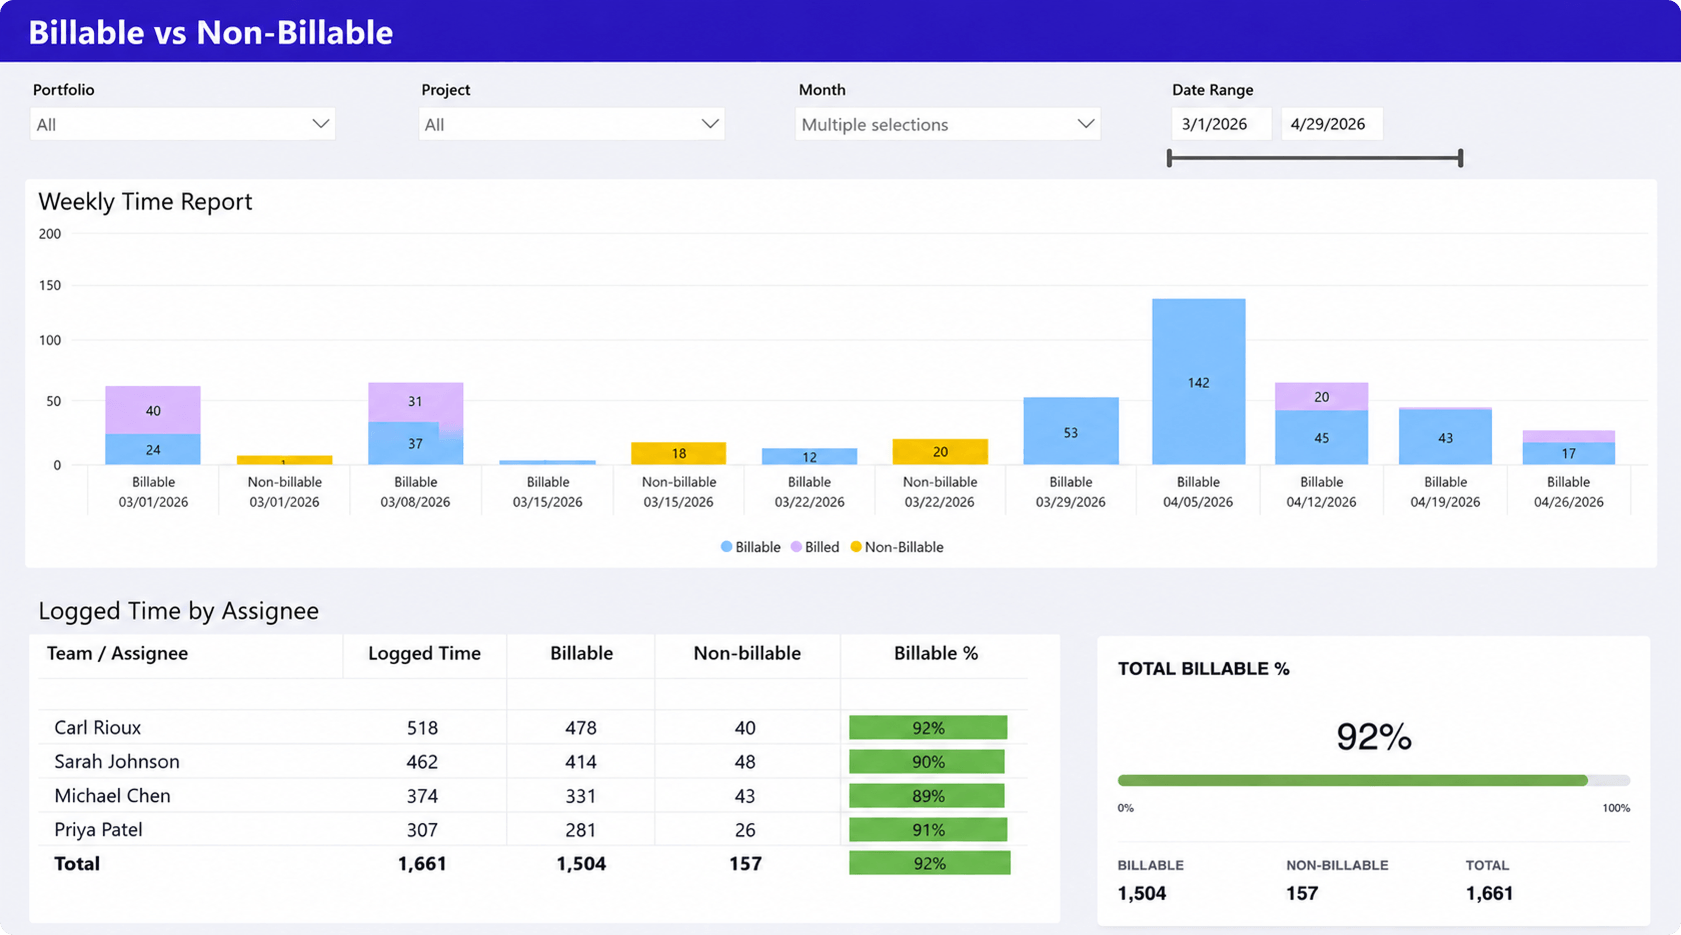
Revenue leakage is not always caused by billing mistakes. In many service firms, profitability declines because too much employee capacity is consumed by non-billable work. Internal meetings, administrative tasks, rework, and other non-client activities can gradually reduce the amount of revenue-generating work the organization delivers.
What it shows
- Billable versus non-billable hours over time
- Total billable percentage across the organization
- Billable performance by employee or team
- Weekly trends in time allocation
- Logged time breakdowns by resource
Why it matters
This dashboard helps leaders understand how effectively available capacity is being converted into revenue-generating work. A declining billable percentage often signals utilization issues, process inefficiencies, or excessive internal overhead that can negatively affect profitability. By identifying teams or individuals with unusually high levels of non-billable work, organizations can take action before utilization and revenue performance begin to suffer.
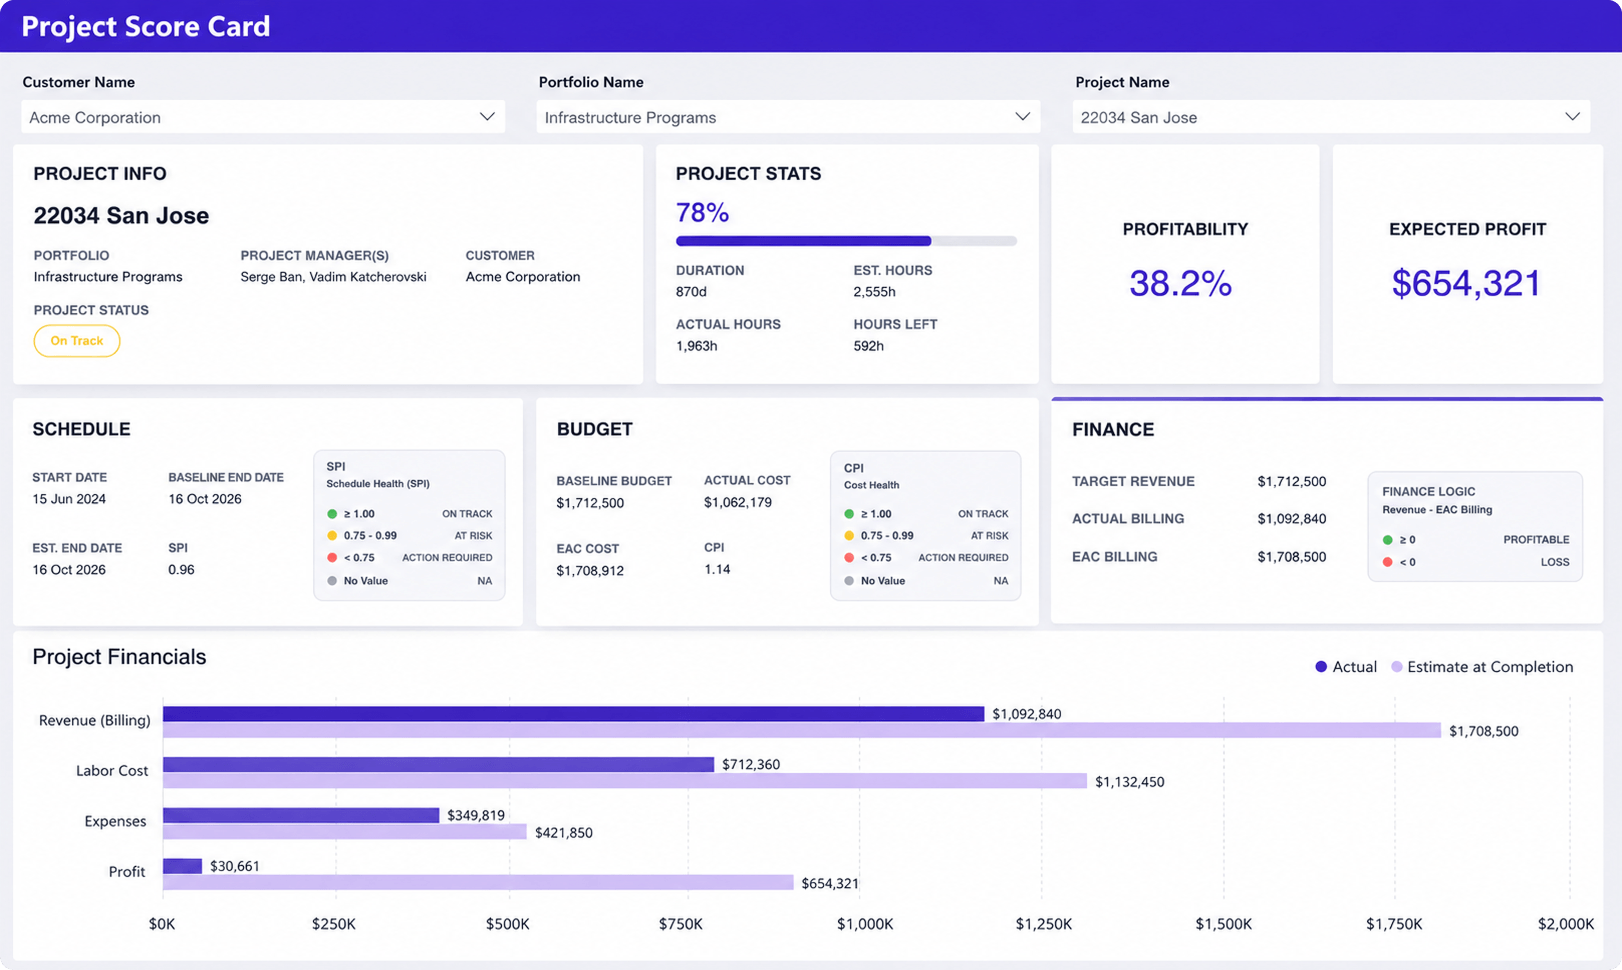
Project score card
What revenue risk it helps identify
Revenue leakage often starts at the project level. Costs increase, hours exceed estimates, billing falls behind plan, or project scope expands without corresponding revenue adjustments. These issues may not be visible in high-level financial reports but can significantly reduce profitability over time.
What it shows
- Project profitability and expected profit
- Actual versus forecasted revenue
- Labor costs and expenses
- Budget and schedule performance
- Project health indicators
- Revenue, cost, and profit comparisons
Why it matters
This dashboard provides a complete view of project financial performance, making it easier to identify projects where margins are beginning to erode. By comparing planned and actual financial results alongside delivery metrics, leaders can spot cost overruns, billing gaps, and profitability risks before they affect overall business performance.
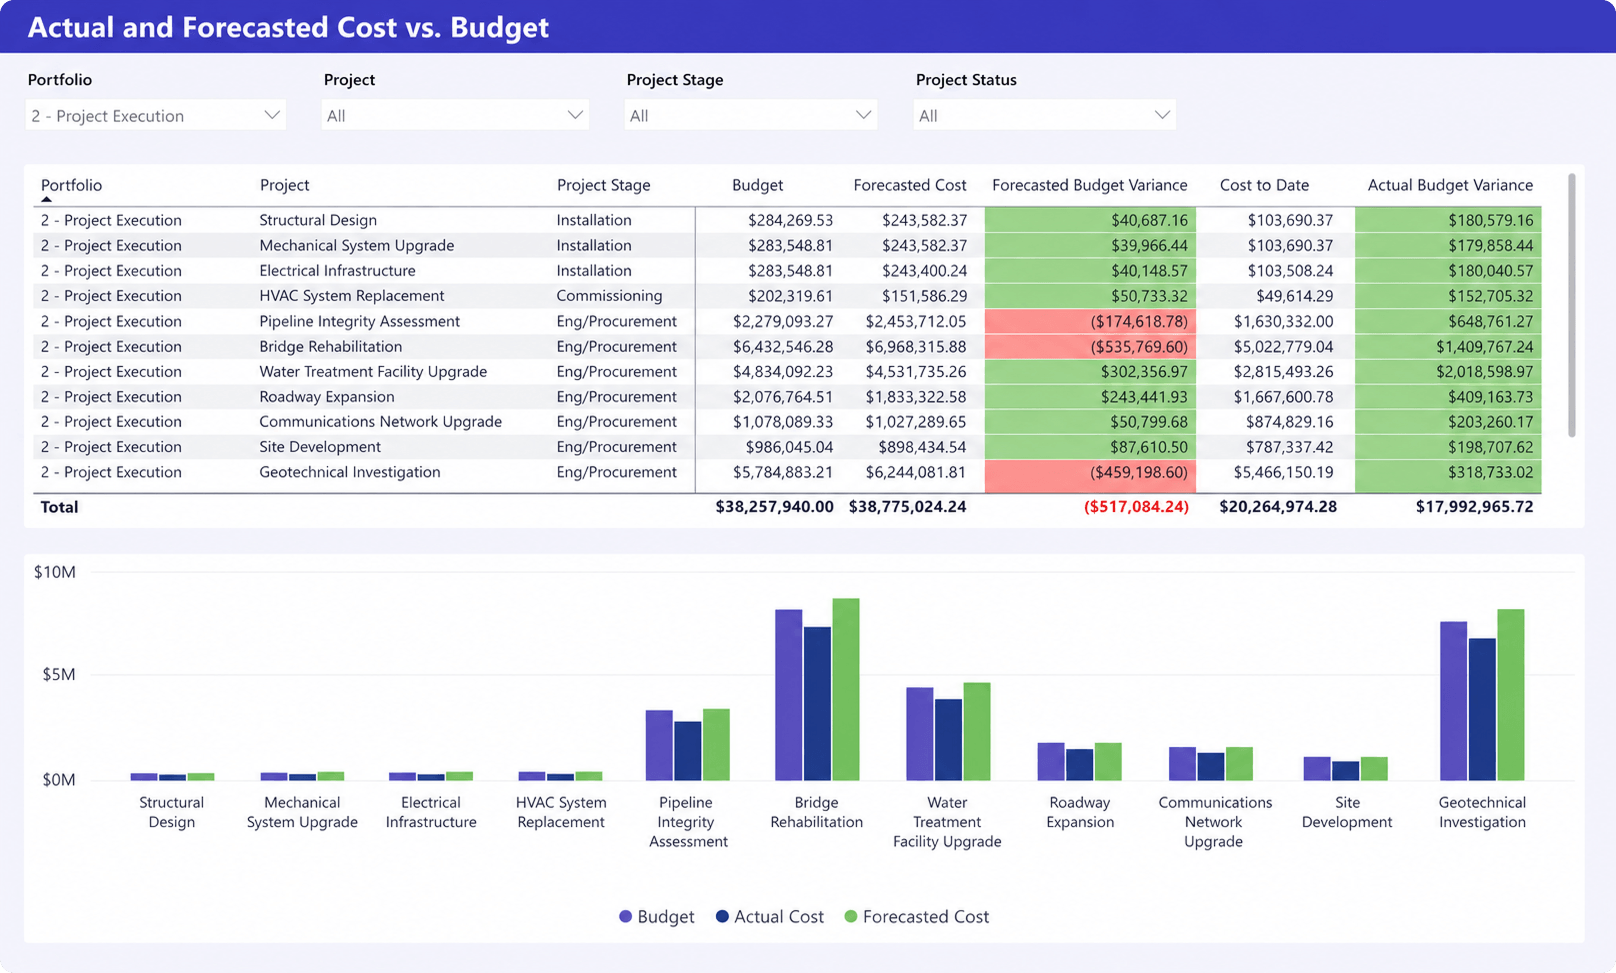
Actual and forecasted cost vs. budget dashboard
What revenue risk it helps identify
Revenue leakage is not always caused by missed billing. In many cases, profitability declines because project costs grow faster than expected. Additional labor, delivery delays, and unexpected expenses can gradually reduce margins long before the problem appears in financial reports.
What it shows
- Project budgets
- Actual costs to date
- Forecasted project costs
- Budget variances
- Forecasted budget variances
- Cost performance across projects
Why it matters
This dashboard helps leaders identify projects that are at risk of exceeding their budgets before delivery is complete. By comparing actual and forecasted costs against planned budgets, teams can spot emerging overruns and take corrective action early.
Visibility into budget variance helps prevent small overruns from turning into significant margin losses.
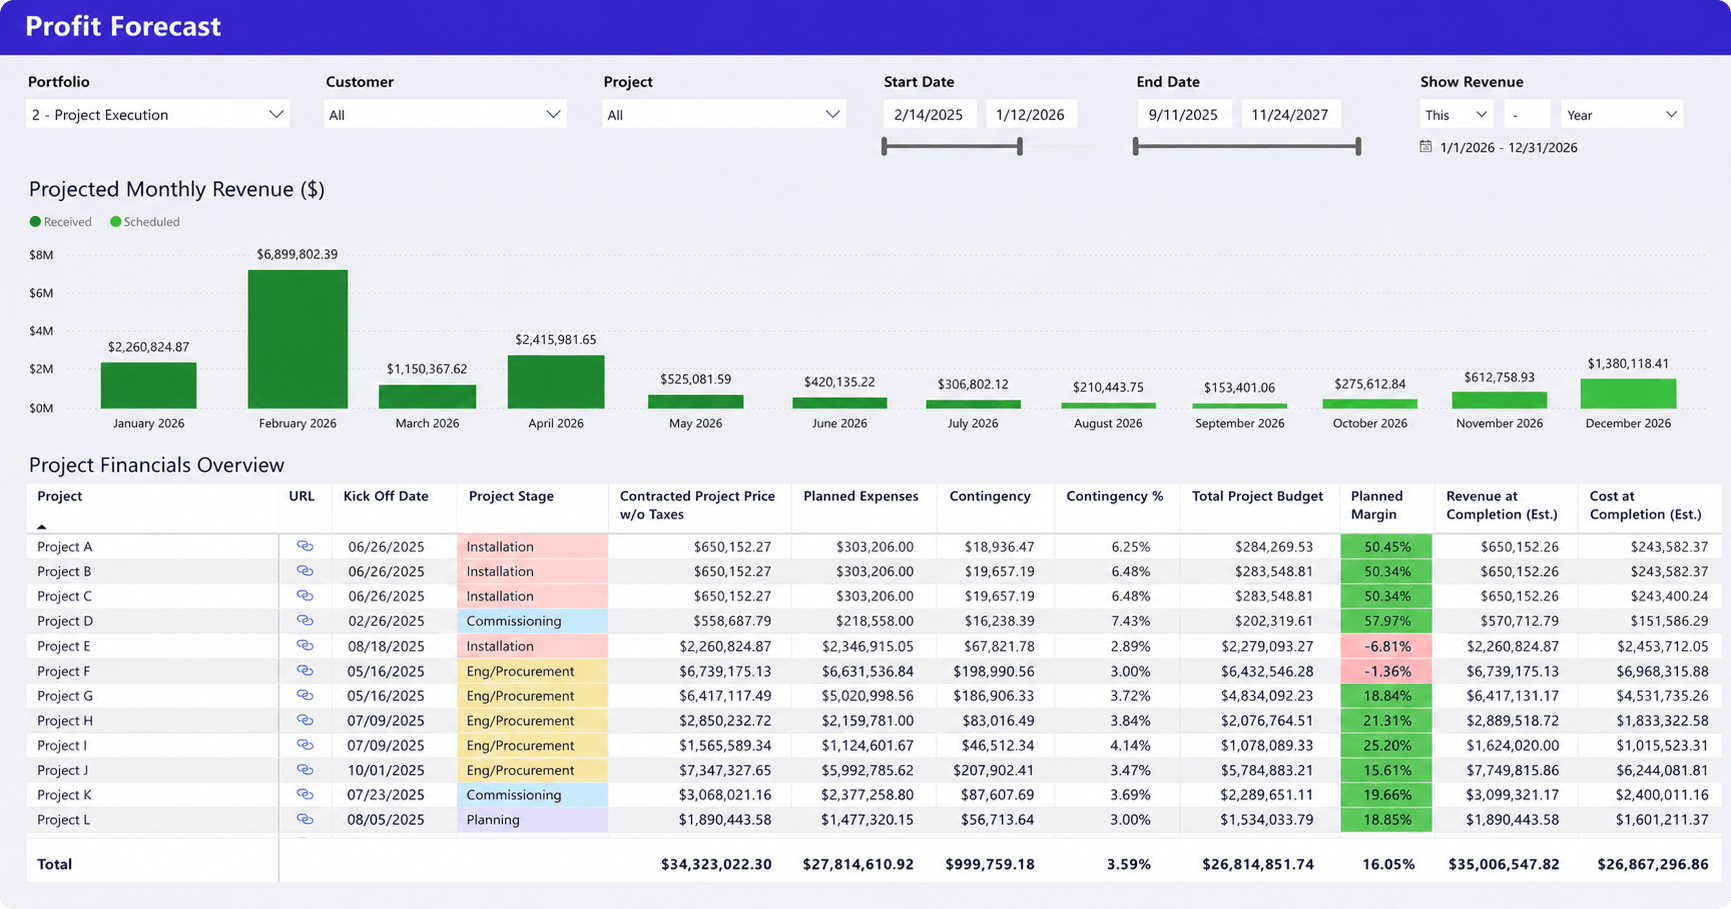
Profit forecast dashboard
What revenue risk it helps identify
Revenue leakage often starts long before it appears in financial statements. Projects may still be generating revenue while profitability declines due to rising costs, shrinking margins, or inaccurate assumptions about future performance.
This dashboard helps identify those risks by showing not only expected revenue, but also projected profitability across active projects.
What it shows
- Forecasted project revenue
- Planned and forecasted expenses
- Revenue at completion
- Cost at completion
- Planned margins
- Project profitability projections
Why it matters
Looking at revenue alone can create a false sense of confidence. By combining revenue, costs, and projected margins, this dashboard helps leaders identify profitability risks before delivery is complete.
Resource utilization dashboard
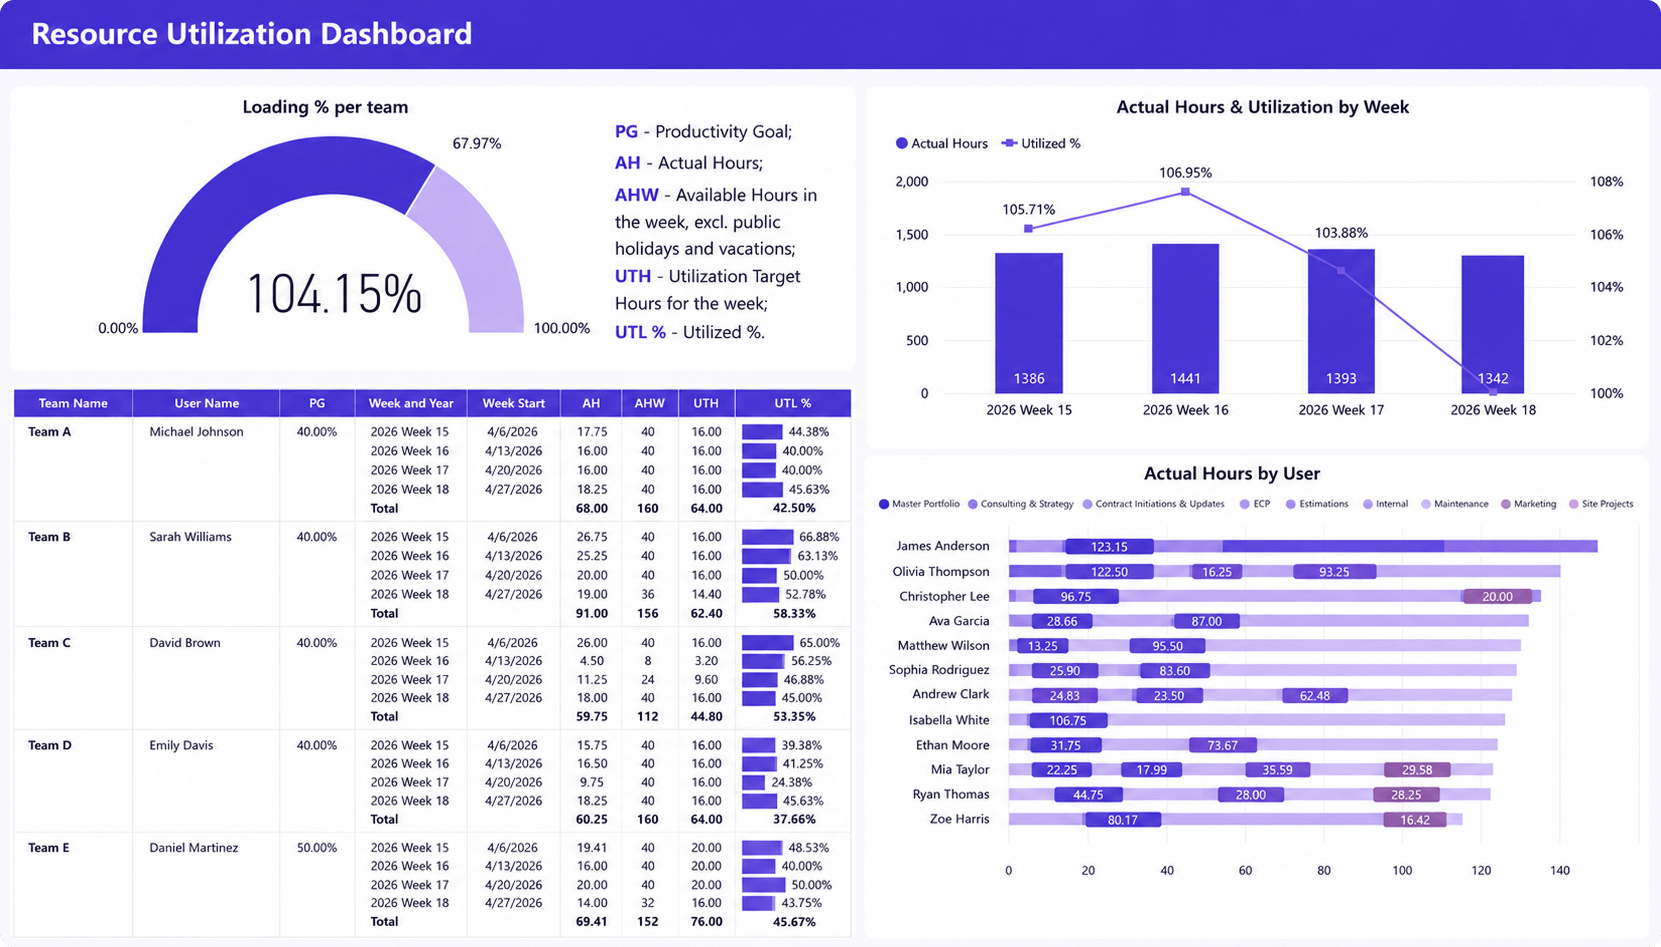
What revenue risk it helps identify
Revenue leakage is not always the result of missed billing or delayed invoices. In many service firms, revenue potential is lost because resources are underutilized, overallocated to non-billable work, or assigned inefficiently across projects.
This dashboard helps leaders identify whether available capacity is being converted into productive, revenue-generating work.
What it shows
- Resource utilization rates
- Actual hours worked
- Utilization targets versus actual performance
- Team and individual workload distribution
- Hours allocated across projects and activities
- Utilization trends over time
Why it matters
Utilization is one of the strongest drivers of professional services profitability. This dashboard helps leaders improve staffing decisions, maximize billable capacity, and identify underutilized resources before revenue potential is lost.
In practice, firms often focus on overloaded teams while overlooking specialists who remain partially unallocated for weeks. Both situations create profitability risks for different reasons.
Time approval dashboard
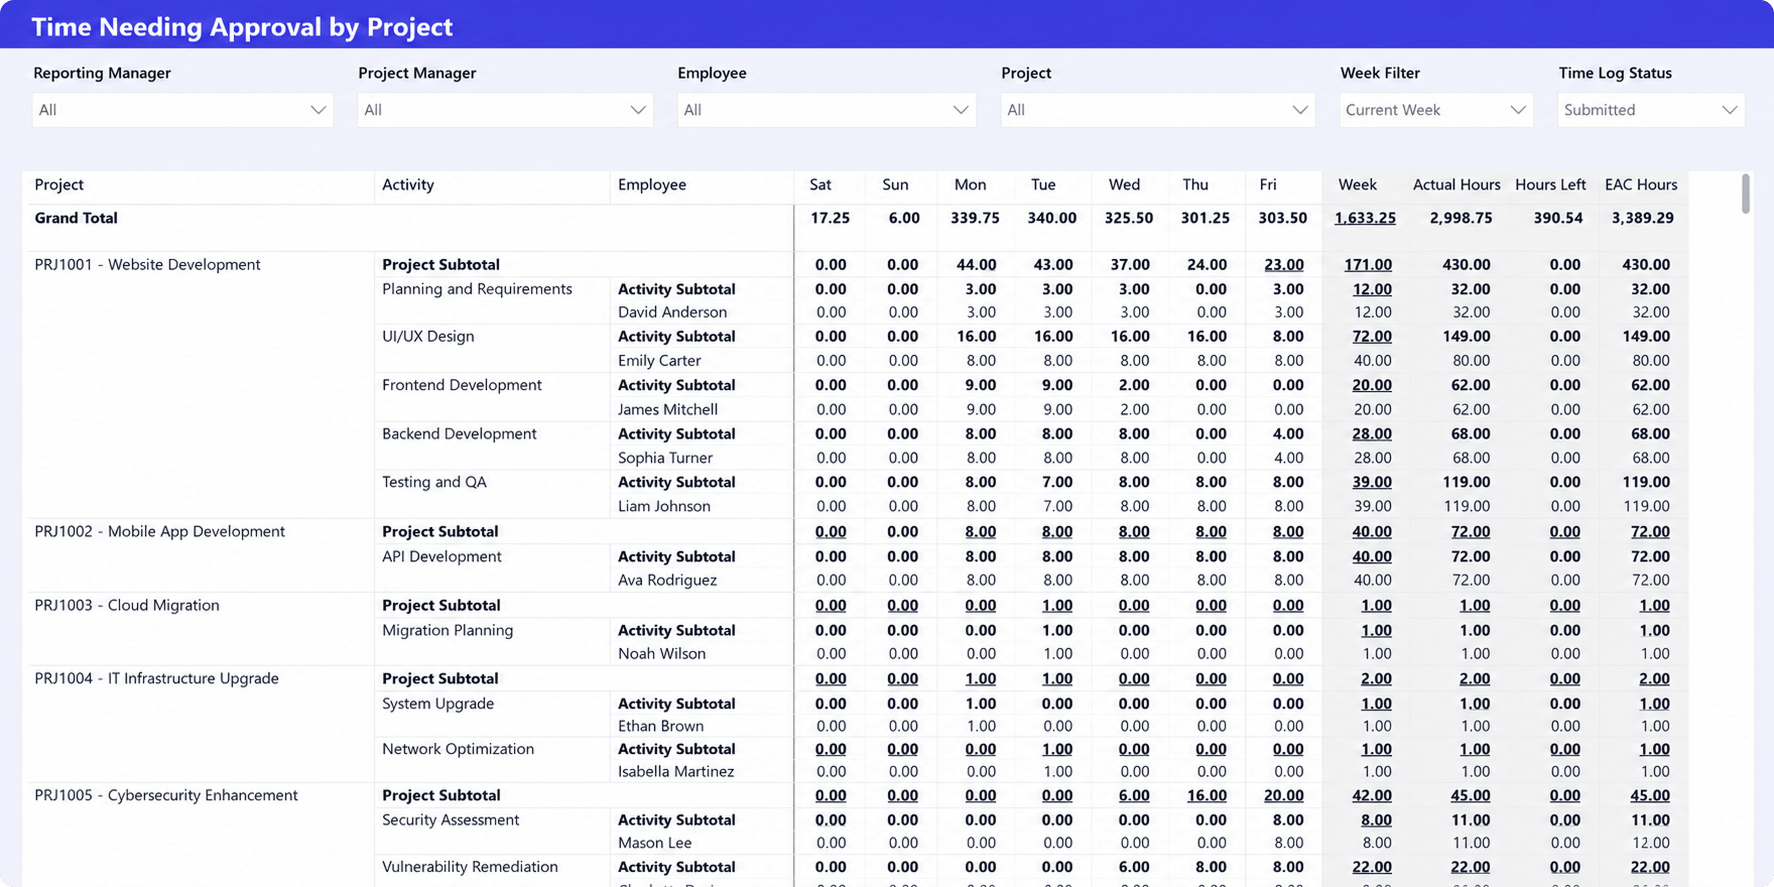
What revenue risk it helps identify
Many service firms cannot invoice work until time entries have been reviewed and approved. When approvals are delayed, the entire billing process slows down, creating bottlenecks that affect cash flow and increase the risk of missed or disputed charges.
This dashboard helps teams identify where submitted time is waiting for approval and which projects are experiencing approval delays.
What it shows
- Submitted time entries awaiting approval
- Hours pending by project
- Time approval status
- Actual versus approved hours
- Employee and project-level approval details
- Approval trends across reporting periods
Why it matters
The longer time entries remain unapproved, the longer revenue remains unbilled. This dashboard helps teams identify approval bottlenecks and accelerate the path from completed work to invoiced revenue.
Which metrics CFOs should monitor most closely
Not every operational metric has the same impact on profitability. While service firms may track dozens of KPIs, a small group of indicators typically provides the earliest warning signs of revenue leakage.
Realization rate
Realization rate shows how effectively billable work is converted into revenue. Declining realization often signals growing write-offs, excessive discounting, or billing issues that prevent firms from capturing the full value of the work they deliver.
Project profitability
Project profitability reveals whether engagements are generating acceptable returns after labor and delivery costs are considered. A profitable project today can become unprofitable surprisingly quickly if costs rise faster than revenue.
Revenue forecast accuracy
Forecast accuracy measures how closely projected revenue aligns with actual outcomes. Consistent forecasting errors often point to problems with project estimation, resource planning, sales handoffs, or delivery execution.
Billable utilization
Utilization remains one of the strongest drivers of professional services profitability. Even small declines in billable utilization can significantly reduce revenue generation and increase pressure on project margins.
Unbilled time
Unbilled time is often one of the clearest indicators of revenue leakage. Rising volumes of unbilled work may signal delayed submissions, approval bottlenecks, or billing process issues that prevent completed work from becoming recognized revenue.
Project margin
Project margins provide an early warning system for financial underperformance. Tracking margin trends throughout delivery helps firms identify profitability risks before projects become unprofitable.
Why spreadsheets and disconnected tools make revenue leakage worse
Many service firms struggle to identify revenue leakage because project delivery, resource planning, time tracking, billing, and financial reporting are managed in separate systems. The challenge is often not a lack of data but a lack of visibility.
No single source of truth
When project, resource, time, and financial data exist in separate systems, identifying revenue leakage becomes difficult. Teams spend more time reconciling data than acting on insights.
Delayed visibility
Spreadsheet-based reporting often depends on manual updates. By the time reports are completed, the underlying issues may already have grown worse.
Manual reporting errors
Manual reporting increases the risk of inconsistent calculations, outdated information, and missing data. These errors make revenue leakage harder to identify accurately.
Delivery and finance operate separately
Many organizations struggle because operational teams and finance teams work with different information. Without shared visibility, financial risks remain hidden inside delivery activities.
Revenue risks are identified too late
Disconnected systems create reporting delays that prevent proactive decision-making. Organizations end up reacting to financial problems instead of preventing them.
How leading service firms reduce revenue leakage
Reducing revenue leakage is rarely about fixing a single process. The most successful service organizations treat it as an ongoing operational discipline that combines financial oversight, project controls, resource management, and reporting visibility.
Common practices include:
- Connect delivery and financial data to create visibility into project performance, utilization, billing, and profitability from a single source of truth.
- Standardize time tracking and billing processes to reduce missed time entries, approval delays, and invoicing bottlenecks.
- Monitor project profitability continuously rather than waiting until project completion to review financial results.
- Track realization rates and billable utilization to identify revenue gaps before they affect overall profitability.
- Review forecast accuracy regularly to improve staffing decisions and reduce costly capacity imbalances.
- Identify budget and margin risks early by monitoring actual performance against planned financial outcomes.
- Use dashboards as early-warning systems to surface operational and financial issues before they become revenue losses.
The firms that protect profitability most effectively are not necessarily those with the most detailed financial reports. They are the ones that can identify revenue risks while projects are still active and take corrective action before revenue is lost.
Revenue visibility starts with connected operational data
Revenue leakage is often viewed as a finance problem, but it is usually a visibility problem. The most effective revenue leakage dashboards combine project delivery, resource management, time tracking, billing, and financial data into a single view.
Platforms such as Birdview PSA help service firms connect operational and financial data to identify revenue risks earlier. Regardless of the technology used, the goal is the same: create visibility before revenue is lost.
FAQ: Revenue Leakage in Service Firms
What causes revenue leakage in professional services?
Revenue leakage is commonly caused by unbilled work, missed time entries, write-offs, delayed invoicing, low realization rates, scope creep, resource underutilization, and poor visibility into project financial performance.
How do firms identify revenue leakage?
Organizations typically identify revenue leakage by monitoring metrics such as realization rate, project profitability, billable utilization, unbilled time, forecast accuracy, and project margins through operational and financial reporting.
What is the biggest source of lost revenue?
For many professional services firms, unbilled time is one of the largest sources of lost revenue because work may be delivered but never accurately recorded or invoiced.
Which dashboards help improve profitability?
The most effective dashboards include project profitability dashboards, realization rate dashboards, resource utilization dashboards, revenue forecasting dashboards, and unbilled time reporting dashboards.
How can firms reduce revenue leakage?
Organizations can reduce revenue leakage by improving visibility, standardizing billing processes, monitoring profitability continuously, connecting operational and financial data, and using dashboards to identify risks early.