Leonid Kostin
 - Excel and Power BI serve different purposes. Excel is ideal for calculations, financial modelling, and ad hoc analysis, while Power BI is designed for automated reporting, interactive dashboards, and ongoing business visibility.
- Excel remains an excellent reporting tool for smaller or less complex environments. The challenges begin when spreadsheets become the primary system for consolidating project, resource, and financial data.
- Growing organizations often outgrow manual reporting before they outgrow Excel itself. As project portfolios expand, maintaining spreadsheets becomes increasingly time consuming and prone to errors.
- Power BI delivers the greatest value for recurring reporting. Automated data refresh, portfolio dashboards, executive reporting, and cross-functional visibility help teams spend less time preparing reports and more time making decisions.
- The biggest reporting improvement comes from better data, not just better dashboards. Connecting Power BI to a centralized project management or PSA platform creates a single source of truth, reducing manual effort and improving reporting accuracy.
Excel remains the foundation of project reporting for many organizations because it is flexible, familiar, and powerful for calculations and analysis. As project portfolios grow and reporting expectations increase, however, many teams begin asking the same question:
Should we continue reporting in Excel, or is it time to move to Power BI?
The answer isn’t as simple as choosing one tool over the other. Excel and Power BI were built for different purposes, and many organizations achieve the best results by using both together.
This guide compares Power BI vs Excel for project reporting, explains where each tool excels, and helps you recognize when your reporting requirements have outgrown spreadsheets.
Power BI vs Excel: what’s the difference?
Excel is designed for calculations, analysis, and ad hoc reporting. Power BI is designed to combine data from multiple systems into interactive dashboards that support ongoing reporting and decision-making.
Rather than replacing Excel, Power BI complements it. Excel gives users the flexibility to analyze data, build models, and answer one-off business questions. Power BI focuses on automated reporting by connecting directly to data sources and refreshing dashboards automatically.
As reporting requirements grow, many organizations continue using Excel for analysis while relying on Power BI to deliver consistent reports across the business.
Why so many project teams still rely on Excel
Excel remains one of the most widely used project reporting tools because it excels at analysis. It is familiar, flexible, and gives users complete control over formulas, pivot tables, and calculations, making it easy to answer business questions without building a dedicated dashboard.
It is also well suited to one-off reporting. Whether teams are comparing planned versus actual hours, forecasting project costs, or analyzing margins, Excel makes it easy to explore data and test different scenarios.
For smaller organizations, spreadsheets are often all that’s needed. If projects are managed in a single system and reporting is relatively simple, Excel provides a fast and cost-effective way to create reports.
The challenge is not Excel itself. Problems begin when spreadsheets become the primary reporting system for the business. As the number of projects, stakeholders, and data sources grows, maintaining accurate reports requires increasing amounts of manual work, making reporting harder to scale.
Where Excel starts to break down
Most organizations don’t replace Excel overnight. Reporting usually evolves gradually as project portfolios grow, more business systems are introduced, and manual reporting becomes increasingly difficult to maintain. The illustration below shows the typical progression from spreadsheet-based reporting to automated dashboards powered by centralized project data.
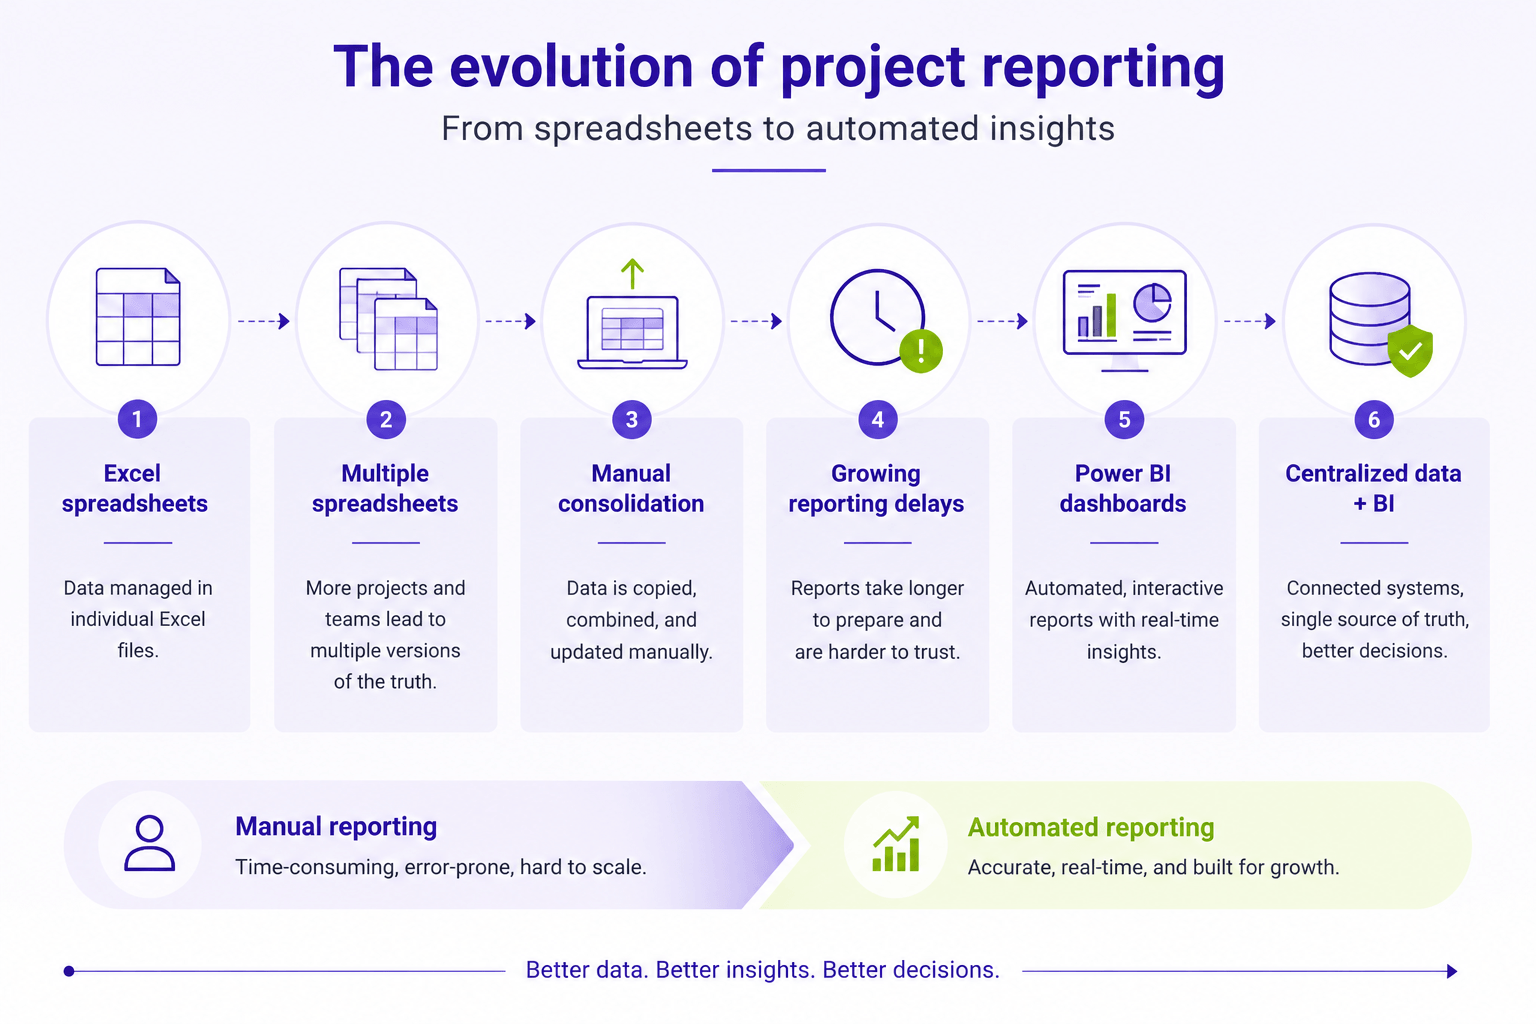
Excel rarely reaches a point where it simply stops working. Instead, reporting gradually becomes more difficult as projects, teams, and data sources increase. What was once a simple reporting process becomes increasingly manual, time consuming, and difficult to maintain.
Many organizations experience these challenges long before they begin evaluating new reporting software.
Multiple versions of the same report
As reporting responsibilities expand, different departments often maintain their own spreadsheets. Project managers track delivery metrics, finance monitors budgets, while operations prepares executive summaries using copied information from several reports.
Over time, multiple versions of the same report begin circulating across the organization. Teams spend valuable meeting time determining which spreadsheet is current and why the numbers do not match instead of discussing project performance or making decisions.
Version control becomes particularly difficult when reports are shared by email or stored in different locations. Even small changes to formulas or source data can create inconsistencies that are difficult to identify.
Manual data updates
Many organizations still build reports by exporting information from several systems and combining it in Excel. Project data, time entries, financial information, and resource allocations are copied into spreadsheets before reports can be updated and distributed.
This process often works when reporting requirements are relatively small. As the number of projects grows, however, manual updates consume more time every reporting cycle. They also increase the risk of missing data, broken formulas, outdated exports, and simple copy and paste errors.
Instead of focusing on insights, reporting teams spend much of their effort preparing data before analysis can even begin.
Reporting across multiple projects
Creating a report for one project is relatively straightforward. Creating consistent reports across dozens or even hundreds of projects is significantly more challenging.
PMOs and operations leaders need to understand portfolio performance, identify projects that require attention, monitor delivery risks, and compare performance across business units. Consolidating that information manually often requires combining data from numerous spreadsheets before meaningful analysis is possible.
As portfolios expand, maintaining those reporting processes becomes increasingly difficult and time consuming.
Combining project, resource, and financial data
Project reporting rarely depends on project schedules alone. Decision makers also need visibility into resource allocation, capacity, time tracking, budgets, actual costs, invoices, revenue, and future demand.
When these datasets exist in different systems, Excel frequently becomes the place where everything is brought together. Although this approach is possible, every additional spreadsheet, export, and lookup adds complexity to the reporting process and increases the likelihood of inconsistent numbers.
For many operations leaders, this is the point where reporting feels more like data preparation than business analysis.
Limited real-time visibility
Executives increasingly expect reports that reflect current business conditions instead of information that is already several days old. Manual reporting makes that difficult because spreadsheets only reflect the data available when they were last updated.
As a result, project issues, resource constraints, or budget overruns may not become visible until the next reporting cycle. By the time reports reach decision makers, the business has often moved on.
This growing gap between reporting effort and reporting value is one of the strongest indicators that an organization has outgrown spreadsheets as its primary reporting platform.
Where Power BI adds value
Power BI helps organizations scale reporting by automating data collection, combining information from multiple systems, and presenting it through interactive dashboards. Instead of spending hours preparing spreadsheets, teams can focus on analyzing results and making decisions.
Interactive dashboards
Unlike static spreadsheets, Power BI dashboards allow users to filter data, drill into specific projects, and explore information from different perspectives. A single dashboard can support executives, project managers, and finance teams without requiring separate reports for each audience.
Automated data refresh
Power BI connects directly to project management, finance, CRM, and time tracking systems, allowing dashboards to refresh automatically. This reduces manual reporting effort, minimizes errors, and gives stakeholders access to current information.
Executive reporting
Executives need a clear view of project delivery, financial performance, resource capacity, and business risks rather than detailed spreadsheets. Power BI presents these metrics in visual dashboards that make it easier to monitor performance and identify issues that require attention.
Cross-functional reporting
Project decisions often depend on data from multiple business functions, including project management, finance, resource planning, sales, and time tracking. Power BI combines these datasets into a single reporting environment, making it easier to understand how different parts of the business affect project performance.
Portfolio visibility
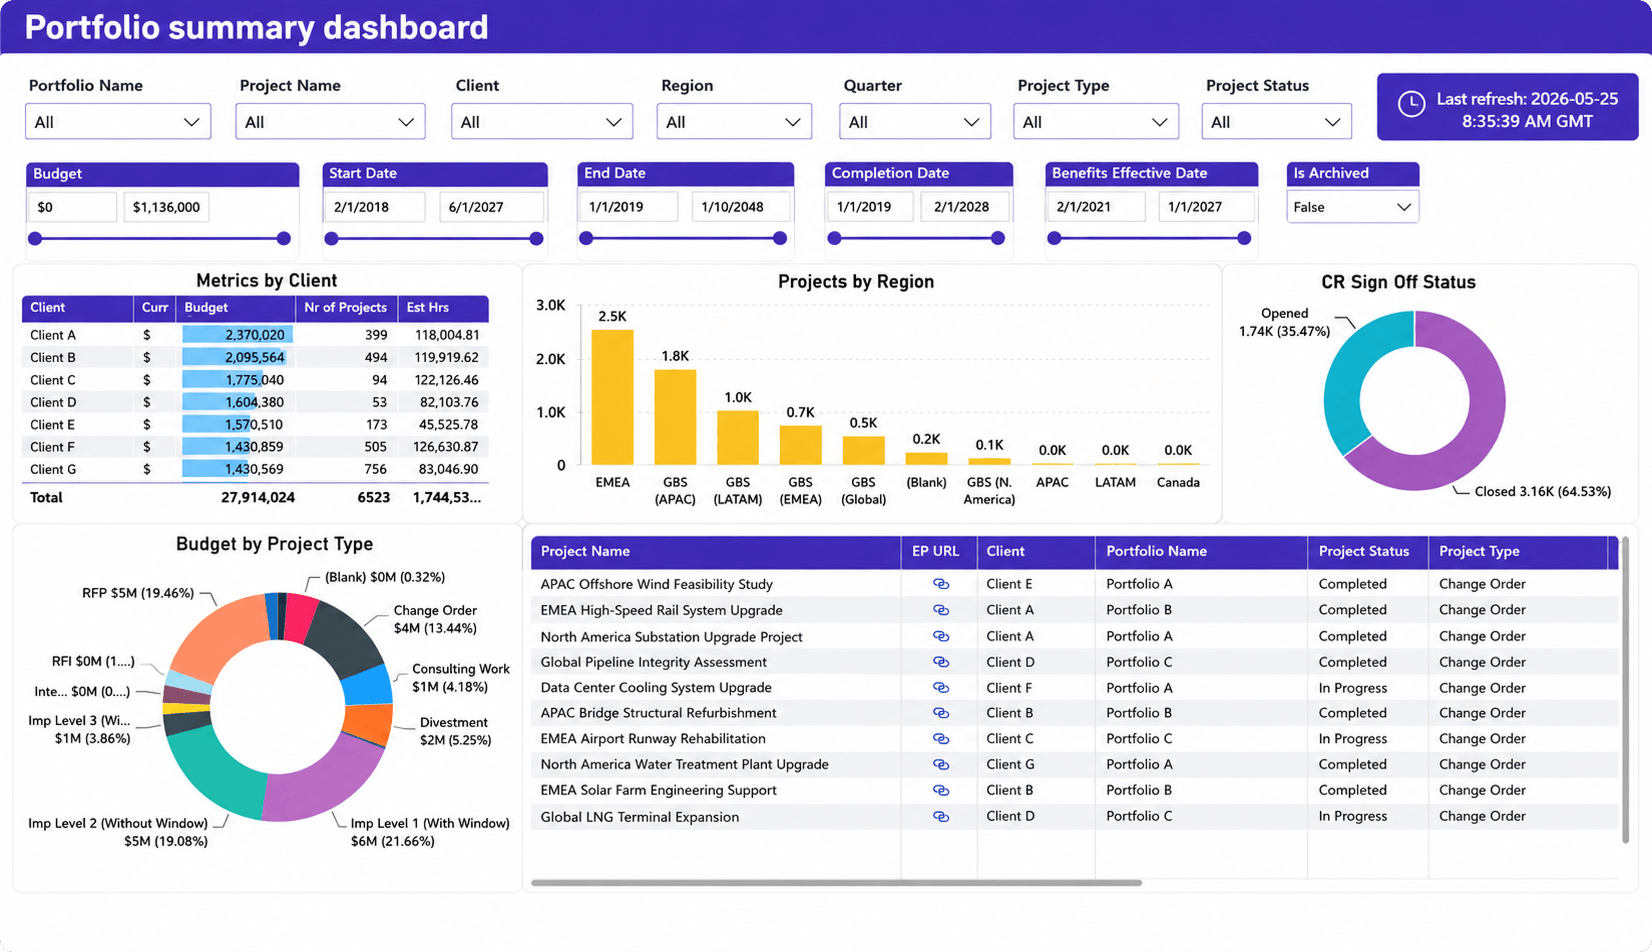
As organizations manage more projects, leaders need visibility across the entire portfolio rather than individual project reports.
Leadership teams need answers to questions such as:
- Which portfolios are performing best?
- Where are delivery risks increasing?
- Which departments have available capacity?
- Which clients generate the highest margins?
Power BI makes it easier to compare portfolios, identify delivery risks, monitor capacity, and track performance from a single dashboard.
Power BI vs Excel: feature comparison
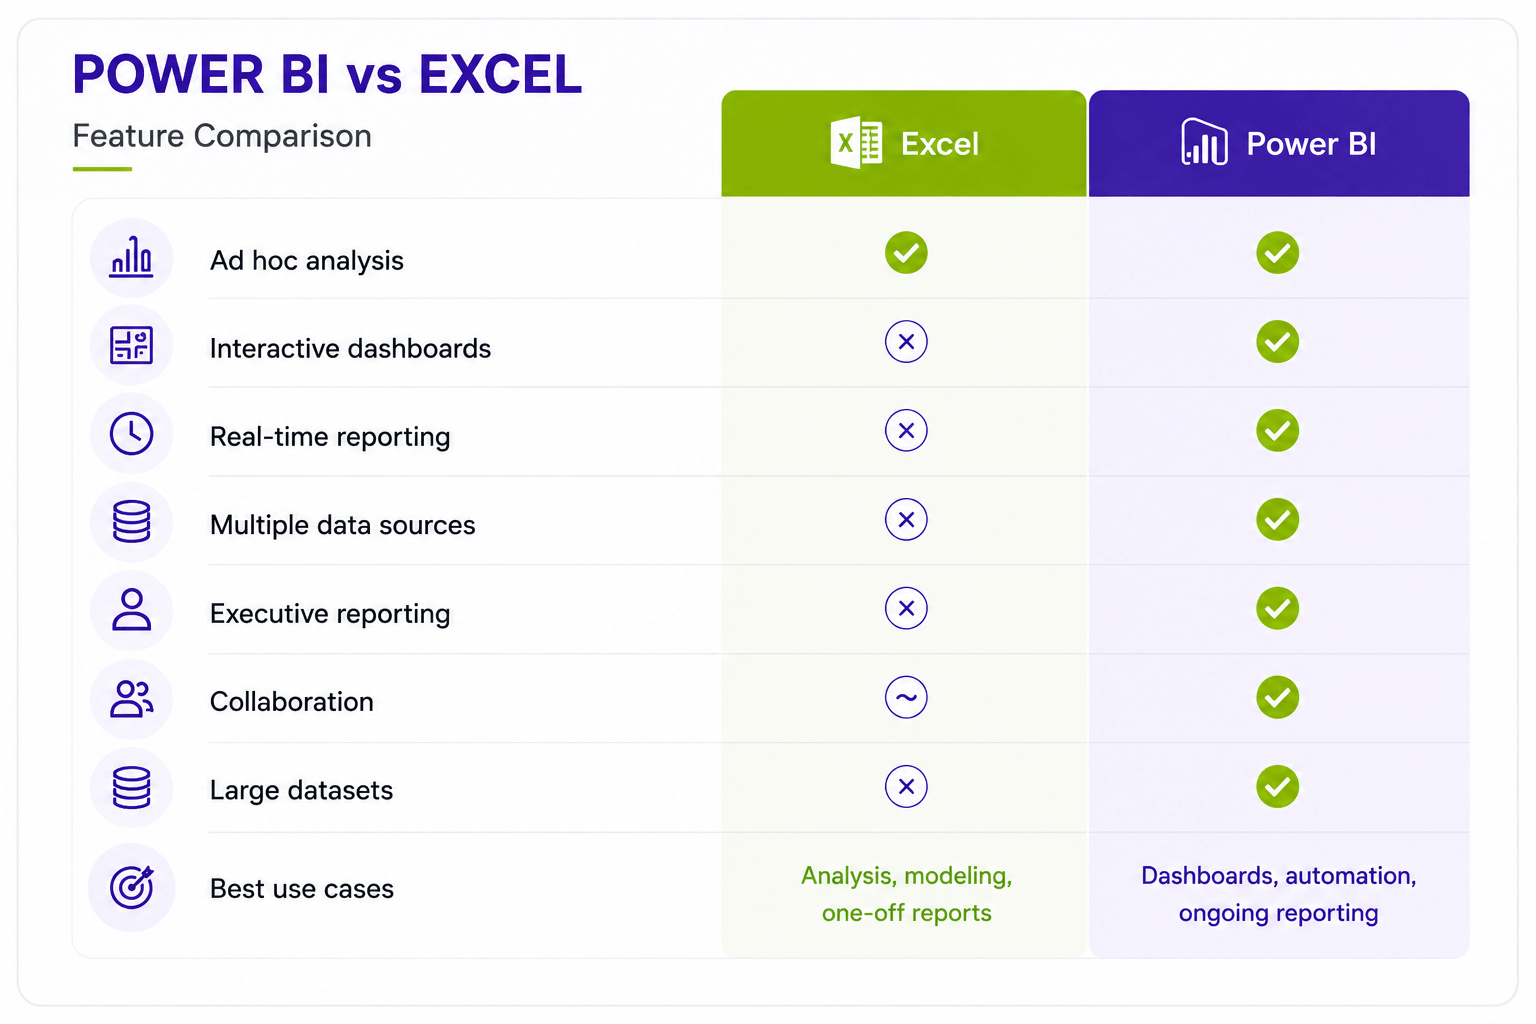
There is no clear winner across every category because the tools serve different purposes. Excel excels at analysis and flexible calculations, while Power BI is designed for scalable, automated reporting.
Many organizations use Excel to explore data and Power BI to distribute trusted reports across the business.
Which tool is better for common reporting scenarios?
The best reporting solution depends on the task. In practice, many organizations use Excel and Power BI together because each tool performs better in different situations.
Weekly project status reports
Excel works well for reporting on a small number of projects. As project portfolios grow, Power BI can automate status reporting by displaying project health, budgets, schedules, and risks in a single dashboard.
Portfolio reporting
Power BI is the stronger choice for project portfolio reporting because it consolidates data across multiple projects, allowing leaders to identify trends, compare portfolios, and monitor delivery risks without manually combining spreadsheets.
Resource utilization
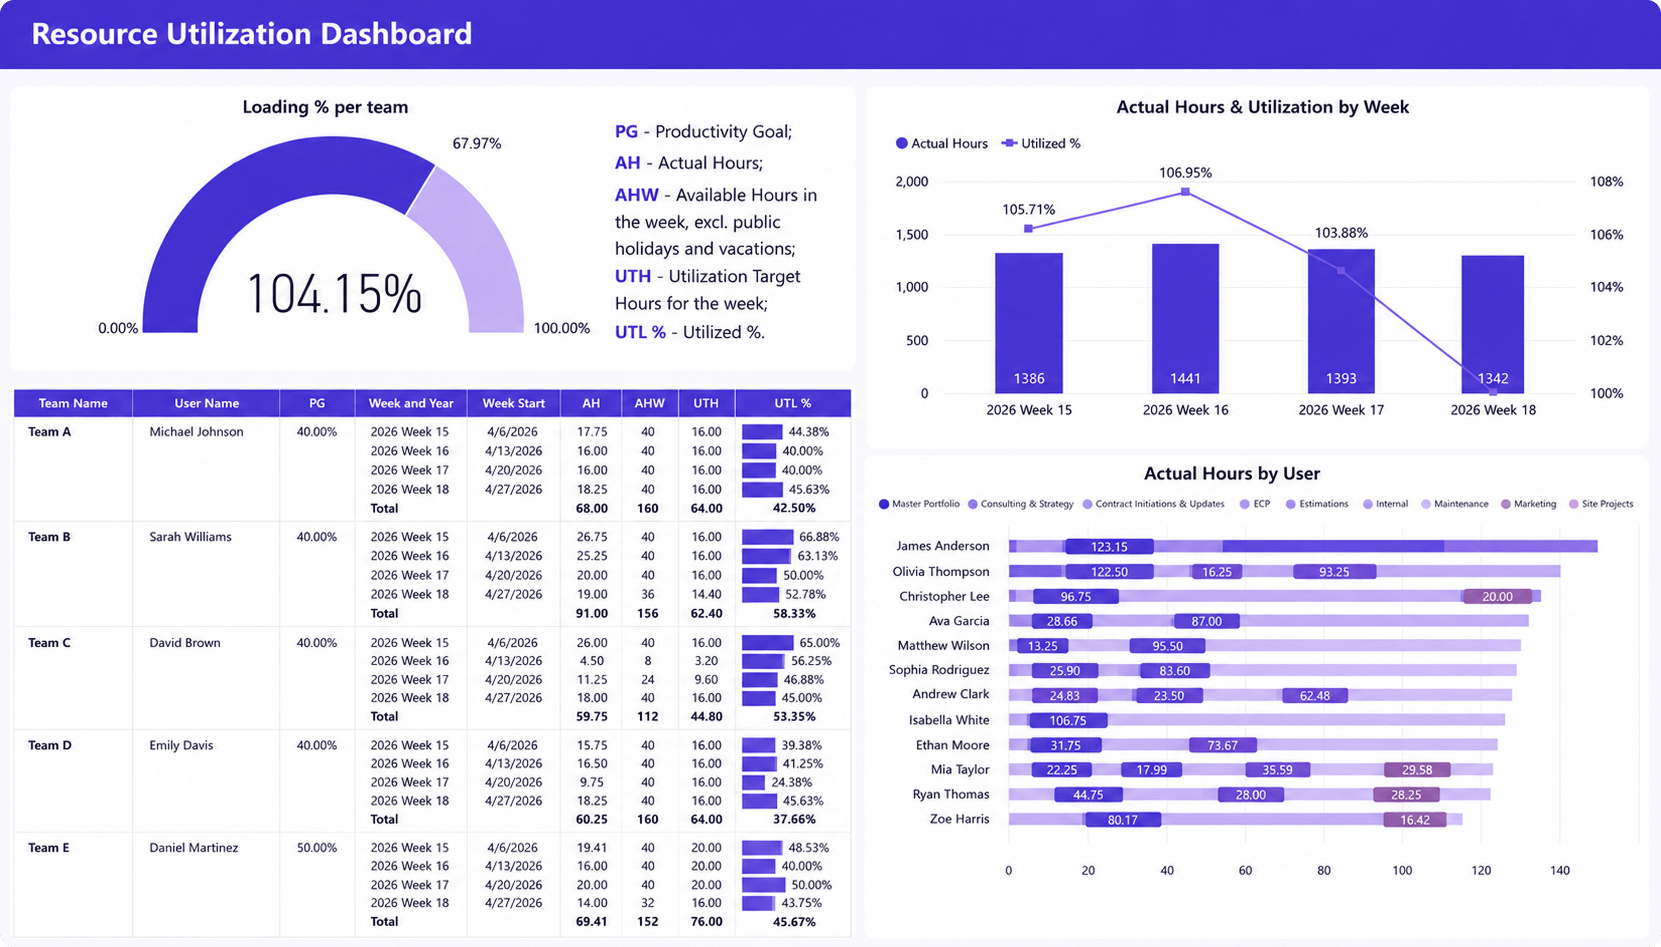
Resource reporting typically combines project assignments, capacity, availability, and time tracking. While Excel can analyze this data, Power BI makes it easier to monitor utilization trends and forecast future capacity through automatically refreshed dashboards.
Financial reporting
Excel remains the preferred tool for budgeting, forecasting, and financial modelling. Power BI is better suited for monitoring organization-wide metrics such as revenue, project profitability, budget performance, and billing trends.
Executive dashboards
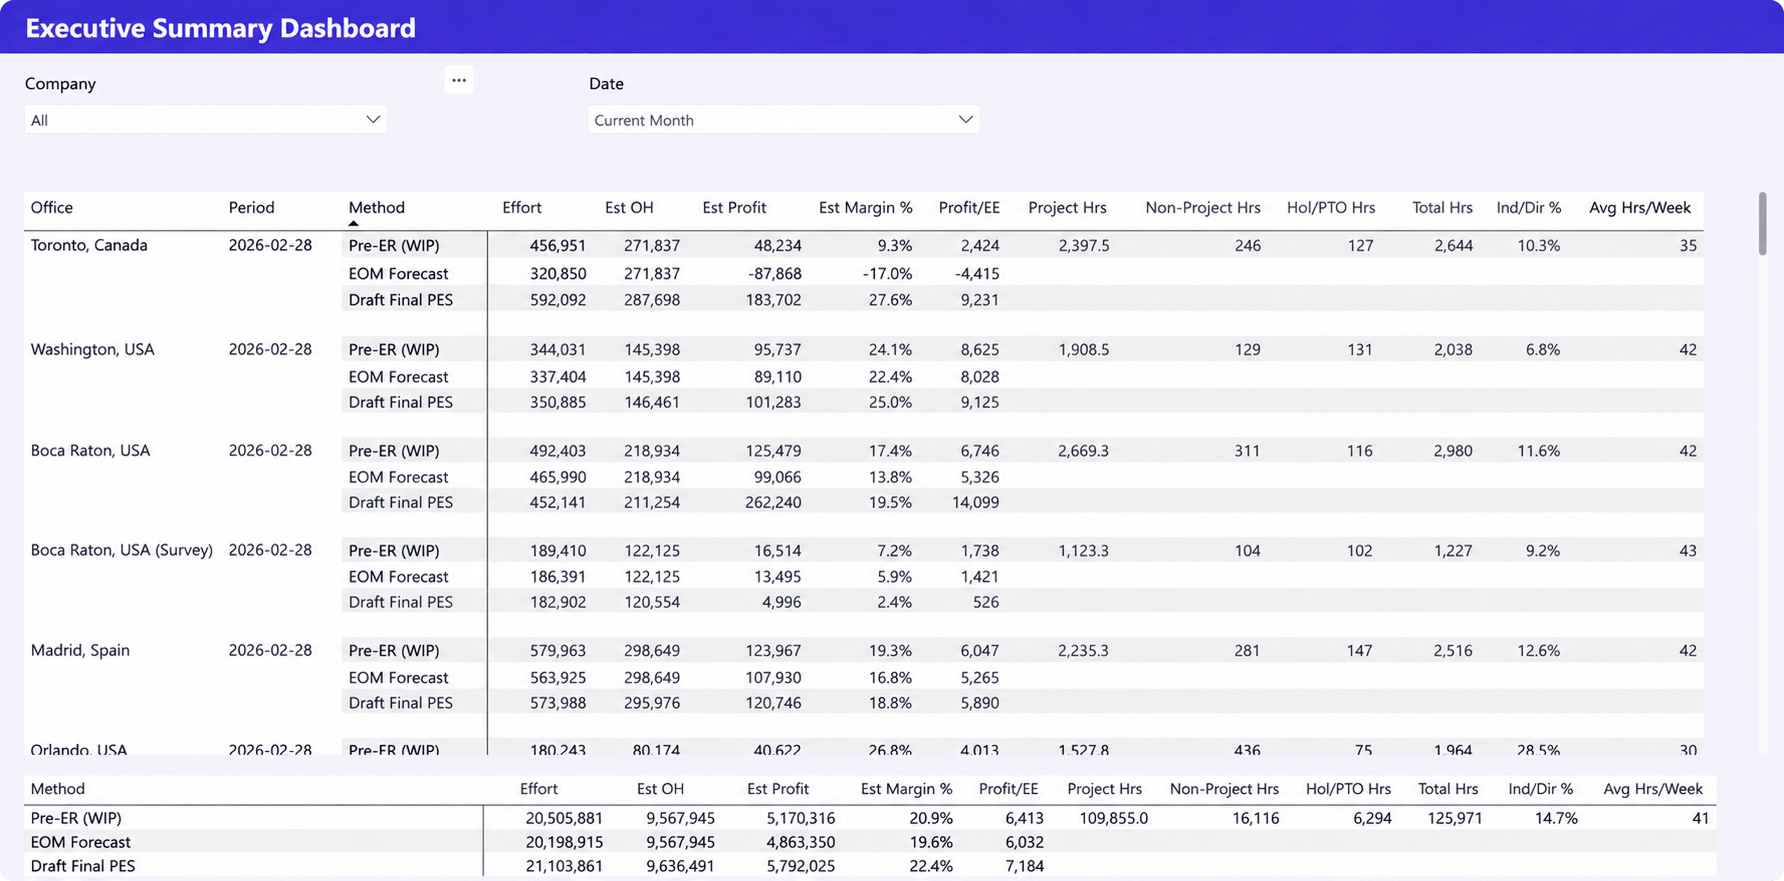
Power BI provides executives with a real-time view of project delivery, financial performance, resource capacity, and strategic KPIs. Interactive dashboards make it easier to identify issues and drill into the underlying data when needed.
Ad hoc analysis
Excel continues to be the better option for one-off analysis, custom calculations, and scenario modelling. Even organizations with mature BI environments regularly export data to Excel for deeper investigation.
When Excel is still the right choice
Power BI offers significant advantages for ongoing reporting, but that does not make Excel obsolete. In many organizations, Excel continues to be the best tool for specific reporting and analysis tasks.
Excel is particularly effective for one-off analysis where users need to answer a specific business question without building a permanent dashboard. Business analysts and finance teams can quickly manipulate data, test assumptions, and perform calculations that would be difficult to recreate in a standard reporting environment.
It also remains the preferred tool for financial modelling, budgeting, forecasting, and scenario planning. These activities often require custom formulas and frequent adjustments that are easier to manage in a spreadsheet than in a dashboard.
Even organizations that rely on Power BI for executive reporting regularly export data to Excel for deeper analysis. Rather than competing with each other, the two tools often support different stages of the reporting process.
When it’s time to move beyond Excel
Most organizations do not decide to adopt Power BI because they have outgrown Excel’s features. They do so because they have outgrown manual reporting processes.
Several signs indicate that spreadsheets are no longer the right foundation for project reporting:
- Reports take hours or days to prepare.
- Teams reconcile multiple spreadsheets before every reporting cycle.
- Executives ask for up-to-date dashboards instead of static reports.
- Project, financial, and resource data produce conflicting numbers.
- Resource planning depends on manually updated spreadsheets.
- Teams spend more time preparing reports than discussing the results.
- Decision makers no longer fully trust the numbers they receive.
These challenges are common as organizations take on more projects, expand their service offerings, or introduce additional business systems. At that point, improving reporting is no longer about creating better spreadsheets. It is about reducing manual work and providing everyone with access to consistent, reliable information.
The real challenge isn’t Excel or Power BI. It’s your data.
Many organizations assume that implementing Power BI will automatically solve their reporting problems. In reality, dashboards are only as reliable as the data behind them.
If project information lives in one system, resource planning in another, time tracking in spreadsheets, financial data in accounting software, and sales forecasts in a CRM, Power BI still needs to bring all of that information together. Without a consistent and connected data source, reporting teams may continue spending significant time preparing and validating data before dashboards can be refreshed.
A centralized project management or professional services automation platform can provide a single source of truth for project delivery, resource management, financial performance, and portfolio reporting. When Power BI connects to that centralized data source, dashboards become easier to build, more reliable, and far less dependent on manual data preparation.
For example, organizations using Birdview PSA can connect their project, resource, time tracking, and financial data to Power BI to automate reporting across projects and portfolios. Instead of consolidating spreadsheets every reporting cycle, they can build dashboards that reflect the latest operational data and help leaders focus on decisions rather than data collection.
The same principle applies regardless of the platform you use. Better dashboards begin with better data. Choosing the right reporting tool is important, but creating a reliable, centralized source of project information has an even greater impact on reporting accuracy, efficiency, and decision-making.
Conclusion
The choice between Power BI vs Excel is not about replacing one tool with another. Excel remains one of the best tools for calculations, financial modelling, and ad hoc analysis, while Power BI is better suited to automated reporting, executive dashboards, and portfolio visibility.
Many organizations achieve the best results by using both tools together. When Excel and Power BI are connected to a centralized project management or PSA platform, reporting becomes more accurate, consistent, and easier to maintain.
If your team spends more time preparing reports than acting on them, it may be time to rethink not only your reporting tools but also the way your project data is managed.
FAQ: Power BI vs Excel
Is Power BI better than Excel for project reporting?
It depends on your reporting requirements. Excel is better for calculations, financial modelling, and ad hoc analysis, while Power BI is better for automated reporting, interactive dashboards, and combining data from multiple systems. Many organizations use Excel for analysis and Power BI for ongoing business reporting.
Can Power BI replace Excel?
Not completely. Excel remains an essential tool for budgeting, forecasting, scenario planning, and exploratory analysis. Power BI complements Excel by automating reporting and presenting information through interactive dashboards. The two tools are most effective when used together.
Should project managers stop using Excel?
No. Excel continues to be valuable for project planning, data analysis, and one-off reports. However, if project managers spend significant time manually consolidating spreadsheets or preparing recurring reports, Power BI can help automate those processes and improve visibility.
When should organizations move from Excel to Power BI?
Organizations should consider Power BI when reporting becomes difficult to maintain with spreadsheets alone. Common signs include manual data consolidation, multiple versions of reports, growing project portfolios, increasing executive reporting requirements, and the need to combine project, resource, and financial data into a single view.
Can Power BI and Excel be used together?
Yes. In fact, this is how many organizations build their reporting environment. Excel is used for detailed analysis and calculations, while Power BI provides automated dashboards for executives, PMOs, operations leaders, and other stakeholders. Connecting both tools to a centralized project management or PSA platform helps ensure reports are consistent, up to date, and based on the same underlying data.