Ksenia Kartamysheva
 - Operations break between 50 and 200 employees, when project volume, hand-offs, and billing complexity exceed what spreadsheets and one person’s memory can track.
- Scalable professional services operations rest on five pillars, built in order: one source of operational truth, capacity forecasting, standardized delivery processes, financial visibility, and automated reporting.
- Average billable utilization fell to 66.4% in 2025, the lowest in the 19-year history of SPI Research’s PS Maturity Benchmark. SPI treats 70%+ utilization and 35%+ project margin as healthy, and only 17.2% of firms hit 100% of their annual margin target.
- Around 55% of PS firms do not track labor costs against projects, so they cannot tell which engagements are profitable until it is too late to fix them.
- Task tools are too shallow and enterprise PPM is too heavy for mid-sized PS firms. About 60% of firms had already adopted and abandoned a project management tool; PSA platforms cover the missing middle by unifying projects, resources, time, and financials.
- Choose a platform for adoption first: role-based views, light licenses for collaborators, mobile time entry, and native accounting and CRM integrations. QuickBooks was the most requested integration in Birdview’s call corpus.
High-growth professional services firms scale operations by consolidating projects, resources, time, and financials into one system of record, then building repeatable processes on top of it. Firms that keep running growth through spreadsheets and disconnected point tools lose visibility first, then margin. The fix is a deliberate rebuild around five pillars: a single source of truth, capacity forecasting, standardized delivery, financial visibility, and automated reporting.
Winning more work is supposed to feel like success. For the person running operations, it often feels like losing control. Every new project adds another spreadsheet tab, another chat thread, another guess about who is actually free next month. In 40+ discovery calls Birdview ran with professional services firms between March 2025 and March 2026, roughly 80% described resource planning done in spreadsheets, usually maintained by one overloaded person. One Director of Professional Services at an IT consulting firm put it plainly: “I just don’t have a handle on it. I see 10 opportunities. I don’t know who’s available.”
Those calls repeat one pattern: growth does not create new operational problems so much as expose the ones spreadsheets were hiding. This article covers where operations break as a firm grows, the five pillars that scalable firms build in order, and how to decide when the fix is a platform rather than another spreadsheet.
Why operations break between 20 and 200 employees
Operations break in this range because informal coordination stops working. At 15 people, one person can hold resource allocation in their head and a shared spreadsheet covers the rest. Somewhere between 50 and 200 employees, the volume of projects, hand-offs, and billing complexity exceeds what memory and Excel can track, and the failures start compounding.
Four failure modes came up over and over in the discovery-call corpus:
Spreadsheet dependency. The resource planning workbook that worked at 10 people becomes a liability at 50. Version conflicts, formula breakage, no real-time view, and a single owner who becomes the bottleneck. As the Head of Software at an energy consulting firm said: “Doing it through spreadsheets is not quite keeping up.”
Tool fragmentation. About 75% of the firms we spoke with ran delivery across three or more disconnected tools. The co-founder of a customer success consulting agency described the end state: “We cannot have one person doing it in Notion, one in HubSpot, and the other in a G-sheet.” When each team keeps its own records, there is no shared operational truth, and reconciling them becomes a job in itself.
No portfolio view. Individual projects may be well run while the firm as a whole flies blind. A VP at a transformer manufacturer summarized it: “We don’t have a portfolio view of these projects. We look at them as individual items.” Leadership cannot see aggregate capacity, aggregate margin, or which commitments conflict.
Manual reporting. When the data lives in five places, every status update or utilization report means exporting time logs to Excel and rebuilding the same analysis by hand. Rebuilding those reports consumes days each month, and the numbers are stale by the time anyone reads them.
Under all four sits a hidden tax: the operations leader as human middleware. Prospects told us it takes about 15 minutes to get back into focused work after each jump between tools. Multiply that across a delivery team switching contexts several times a day, and fragmentation is costing billable hours that never show up in any report. Worse, the firm’s operational knowledge lives in one person’s head, which makes that person a single point of failure.
The five pillars of scalable PS operations
Scalable professional services operations rest on five capabilities, and the order matters. Visibility comes before optimization: you cannot forecast capacity or track margin on data scattered across six tools. Treat the pillars below as a maturity sequence, not a menu.
1. One source of operational truth
Before optimizing anything, consolidate projects, tasks, time entries, and client communication into one system of record. Every improvement downstream depends on this. Capacity forecasting fails if half the team’s assignments live in a separate tracker. Profitability reporting fails if time data has to be reconciled from three exports.
A practical first step costs nothing. Inventory the current stack and count the hand-offs where someone retypes data from one tool into another. Every one of those hand-offs adds delay and gives the numbers a chance to diverge. In one call, the operations lead at a biostatistics consultancy described the result of a broken billing hand-off: “You end up with two different aging ARs, which is crazy.” That is what fragmentation does to financial data. The same thing happens, less visibly, to project and resource data.
2. Resource planning and capacity forecasting
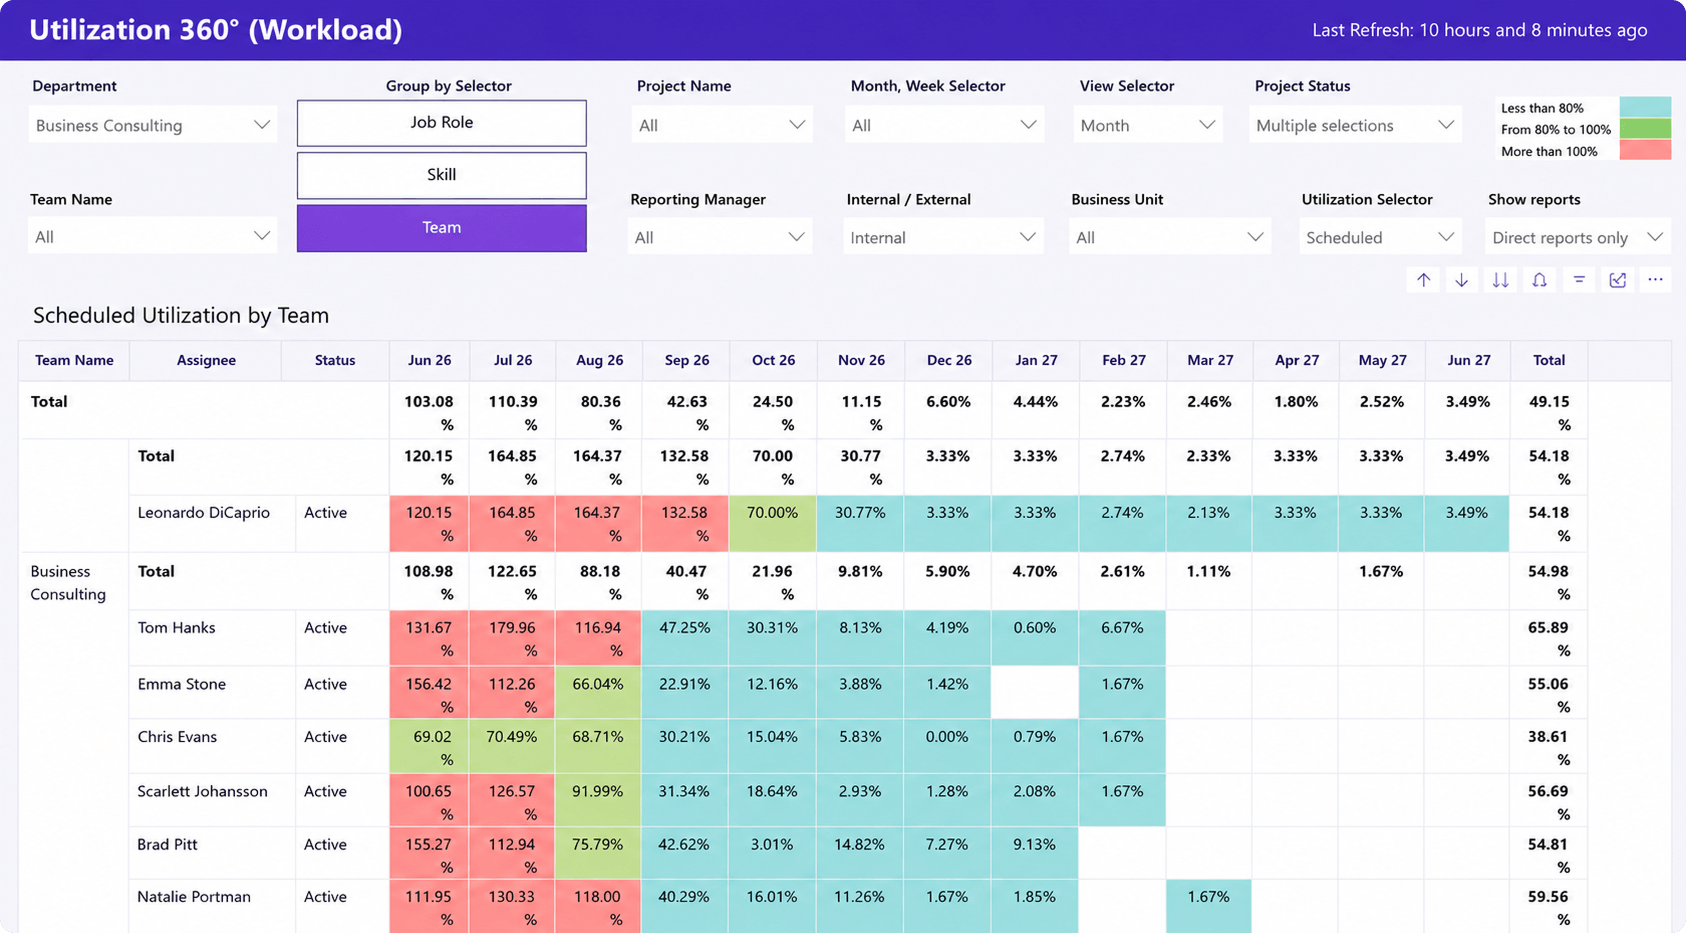
The capability that separates scaling firms from struggling ones is the jump from “who is busy today” to “who is available in six weeks.” Reactive allocation answers the first question. Only forward-looking capacity planning answers the second, and the second is the one sales, hiring, and revenue forecasting all depend on. Resource planning was the single most requested capability across our discovery-call corpus.
The industry data says most firms have room to recover here. SPI Research’s 2026 Professional Services Maturity Benchmark, published in February 2026 from data on 509 PS organizations, reported average billable utilization of 66.4% in 2025, the lowest figure in the benchmark’s 19-year history and well below SPI’s 70% healthy threshold. Utilization problems usually start before a project begins: sales commits to timelines that delivery never validated against real capacity.
One warning from practice: a resource tool that permits silent double-booking is barely better than the spreadsheet. An Engineering Director at a defense contractor described his previous system: “It’ll let you double book people. I could load somebody up with 400% of work.” A plan that tolerates 400% allocation is not a plan. Look for hard capacity visibility, where overallocation is flagged the moment it happens, not discovered when the project slips.
3. Standardized intake and delivery processes
At a small firm, project quality depends on which PM runs the job. That does not survive scale. Standardization means three concrete things: project templates that encode how the firm delivers each service type, structured intake forms so requests arrive with the information delivery needs, and a defined sales-to-delivery hand-off so closed deals become staffed projects without a scramble.
Standardization matters most for firms running mixed billing models. A firm juggling time-and-materials contracts, fixed-fee projects, and monthly retainers in the same portfolio cannot manage each one ad hoc. Consistent project structures are what make it possible to compare margin across a T&M engagement and a retainer, or to see that fixed-fee work is systematically overrunning scope. Process consistency is also insurance against knowledge walking out the door when a senior PM leaves, a risk that came up in roughly one in five of our calls.
4. Financial visibility: utilization and project profitability
Growth without profitability tracking is just growing losses faster. Around 55% of the firms in our corpus admitted they do not track labor costs against projects, which means they do not know which engagements make money. The owner of a digital agency was blunt about discovering this: “We don’t track labor costs. We’re undercharging.” He described the goal as moving “from not thinking, to look somewhere and say, this is how much it’s costing us.”
Three measures cover most of what a scaling firm needs:
- Billable utilization by person and team, against a target. SPI’s 2026 benchmark treats 70%+ as healthy; sustained readings below that usually signal a staffing or scoping problem rather than lazy consultants.
- Budget versus actuals per project, visible during the project, not after. Margin problems found at closeout are write-offs. Found in week three, they are change orders.
- Margin by client and service line, so pricing decisions rest on data. SPI benchmarks healthy project margin at 35%+, and only 17.2% of firms in the 2026 report hit 100% of their annual margin target.
The mechanical prerequisite is connecting time tracking directly to budgets and invoicing. When time entries flow straight into billing, the month-end ritual disappears. The alternative was described by an operations lead at a civil engineering firm: “Invoicing takes an entire day every month.” At a growing firm, that day becomes two, then a week, and errors creep in at every manual step.
5. Automated reporting and executive dashboards
The final pillar replaces the monthly Excel-export routine with dashboards that answer questions the moment they are asked. When project, time, and financial data already live in one system, portfolio reporting stops being an analysis project and becomes a view: live utilization, budget health across all projects, and capacity for the next quarter.
The payoff is bigger than saved hours. When executives can self-serve answers, the operations leader stops being the reporting bottleneck, and decisions get made on current numbers instead of last month’s. Firms with a BI function should check that the platform feeds their existing stack; a native Power BI connection, for example, lets the data team build custom financial and utilization reporting on live PSA data instead of exports.
When do spreadsheets and point tools stop being enough?
Spreadsheets stop being enough when coordination failures start costing real money: a double-booked lead discovered mid-project, an invoice cycle that eats days, an executive question the data cannot answer. If several of the signals below feel familiar, the problem is the operating model, not the effort:
- Resource conflicts surface after commitments are made, not before
- Invoicing or month-end reporting consumes multiple full days
- Leadership asks portfolio questions (total capacity, margin by client) that require a manual research project to answer
- Project margin is unknown until the engagement closes, if it is known at all
- One person’s departure would take the firm’s operational knowledge with them
- You already tried a lightweight PM tool and it did not stick
That last one is more common than it feels: about 60% of the firms we spoke with had already adopted and abandoned at least one project management tool. Most of those failed rollouts were a category mistake rather than a lack of effort. A PM at a credit union described the ceiling of task tools: “Asana works more like a checklist.” Meanwhile enterprise PPM suites solve portfolio visibility at a weight and cost that mid-sized firms cannot absorb.
| Category | What it does well | Where it fails a scaling PS firm |
| Task tools (Asana, ClickUp, Monday) | Task lists, lightweight collaboration | No real resource planning, no financials, no portfolio view |
| Enterprise PPM suites | Deep portfolio governance | Heavy to implement, expensive, low adoption outside the PMO |
| PSA platforms | Projects, resources, time, and financials in one system | Overkill below roughly 20 delivery staff |
Growing PS firms need the middle category. Professional services automation (PSA) platforms unify project management, resource planning, time tracking, and financials, which is precisely the combination the five pillars require. The SPI 2026 benchmark backs this up at the category level. In its data, 64.6% of high-performance organizations integrate their PSA with their core financial system, versus 53.1% of everyone else, and that integration is where real-time project margin visibility comes from.
How to choose an operations platform your team will actually use
Choose for adoption first, because the best-specified platform fails if the delivery team will not enter time in it. Three evaluation criteria pre-empt the most common failure modes we hear about from firms replacing a stalled rollout:
Adoption risk. Look for role-based views so a consultant sees a simple timesheet while operations sees the full resource plan. Check licensing for light users: collaborator or guest access matters when 50 people need to log time but only 10 need full functionality, and a client portal gives customers project visibility without another license. Mobile time entry decides whether field staff log hours daily or reconstruct the week from memory on Friday.
Perceived complexity. A platform that unifies five functions will show more surface area than a checklist app. What matters is whether it can be rolled out in stages and configured down to what each role needs. Put real weight on structured onboarding; a guided implementation is often the difference between a platform that sticks and one that joins the abandoned-tools list.
Integration reality. The platform must connect to accounting, or the invoicing problem just moves. QuickBooks was the most requested integration across our entire call corpus, ahead of Salesforce, HubSpot, and Jira. CRM integration matters nearly as much: when a closed-won deal automatically creates a staffed project, the sales-to-delivery hand-off stops depending on someone remembering to send an email. Firms in regulated industries, and many Canadian organizations, should also confirm data residency options and SOC 2 compliance before shortlisting.
This is the category Birdview PSA was built for: one platform covering projects, resource forecasting, time tracking, and project financials for mid-sized professional services firms, with the QuickBooks, CRM, and Power BI connections above available natively. Whichever vendor you evaluate, score it against the five pillars rather than a feature checklist.
Scaling is a visibility problem before it is a headcount problem
Firms that scale operations well share one trait: they fixed visibility early. Once projects, capacity, and financials live in one place, growth stops compounding chaos, because every new project lands in a system that already knows who is available and what the work should cost. Firms that skip this step hire more coordinators to manage the spreadsheets, which treats the symptom.
FAQ
What is professional services operations?
Professional services operations is the function that manages how a services firm plans, staffs, delivers, and bills client work. It covers resource allocation, capacity forecasting, project delivery processes, time tracking, and project financials. At small firms it is usually one person with spreadsheets; at scale it requires dedicated process and a shared system of record.
At what size does a PS firm need a PSA platform?
The threshold is usually 20 to 30 delivery staff or roughly 15 to 20 concurrent projects. Below that, disciplined spreadsheets can work. Above it, the coordination cost of manual planning grows faster than headcount, and firms in our discovery calls consistently described spreadsheets breaking down in the 50-employee range.
What is a good billable utilization target?
SPI Research’s 2026 benchmark treats 70%+ billable utilization as healthy, while the industry average fell to 66.4% in 2025. The right target varies by role and vertical: senior staff carry non-billable leadership work, and engineering-heavy firms often benchmark slightly lower. Sustained utilization below 70% usually signals a staffing, scoping, or pipeline problem worth diagnosing.
Can a firm fix operations with better spreadsheets instead of new software?
Discipline helps, but spreadsheets have structural limits: no real-time shared view, no connection between time data and invoicing, and total dependence on the person maintaining them. Firms can buy time with better templates. They cannot get forward capacity forecasting or live project margin out of Excel at 50+ employees.
Sources
- SPI Research, 2026 Professional Services Maturity Benchmark (19th annual edition, 509 firms): https://spiresearch.com/reports/2026-ps-maturity-benchmark/
- Certinia, Analyzing the 2026 SPI Research Professional Services Maturity Benchmark Report (2026): https://www.certinia.com/blog/analyzing-the-2026-spi-research-professional-services-maturity-benchmark-report/