Service firms run on three questions: Are your people busy enough? Are your projects making money? And what’s coming down the pipeline? Most firms can’t answer these questions until it’s too late. By the time monthly reports arrive, the damage is done. Real-time dashboards change this. They turn those three questions into something you can actually track and act on daily. This guide walks through how utilization, profitability, and forecasting dashboards work, what they actually show you, and what to do with that information.
Why these dashboards matter for service firms
The modern professional services environment is complex. You are juggling multiple projects, disparate teams, and fluctuating client demands. In this multi-project, multi-team ecosystem, relying on monthly spreadsheets or delayed reports is a recipe for error.
Service firms need real-time visibility into two core areas: people and money. For people, the question is: are we busy, and are we busy on the right things? For money, it is: are we making a profit now, and will we make a profit next month?
Dashboards answer these questions. They transform massive datasets into simple visual indicators. This allows your team to move past simple reporting and start making data-driven decisions that impact operational and financial health immediately.
The three dashboard types and what they measure
To use these dashboards effectively, we first need to define what each one is designed to measure.
Utilization dashboards
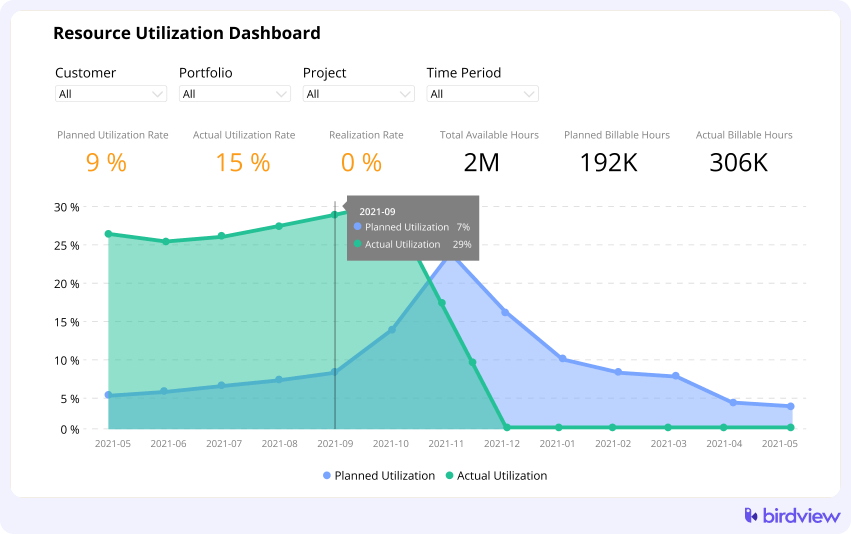
Utilization is the cornerstone metric for service firms. It measures how much of your team‘s available time is spent on productive work.
A common calculation for utilization is:
Utilization = (Actual Productive Hours / Total Available Hours) x 100
“Good” utilization varies widely by role. A target of 80% for billable consultants might be great. But a target of 50% for senior management is also acceptable, as their role involves necessary non-billable work like leadership and business development.
Key Utilization Insights:
- Productive Utilization: Hours spent on any defined work activity, billable or non-billable.
- Billable Utilization: Hours spent directly on client work that is generating revenue.
- What the dashboard includes: Capacity, scheduled hours, actual hours, and utilization rates broken down by person, team, role, and project.
What Birdview‘s utilization dashboards show:
The dashboards give you a clear view of current utilization (based on reported hours) and future utilization (based on scheduled work). You can instantly see who is over-allocated, who is under-utilized, and the billable versus non-billable split for teams or individuals.
Actions to take:
- Reassign tasks to balance workload across the team. Move lower-priority work away from overloaded people. Adjust deadlines if the alternative is burning people out.
- Shift non-billable work away from billable roles during peak periods. Can someone else handle that internal project? Can training wait until next month?
Use Birdview’s workload and resource planning tools to drag and drop hours between team members, adjust task timelines, or reallocate entire projects. Compare what you scheduled against what actually happened. If your forecasts keep missing reality, your estimates need work.
Examples of when to act
- If a team‘s average utilization stays above 90% for three weeks, reduce internal work and delay non-urgent tasks.
- If someone is scheduled above 110% capacity for the next two weeks, reassign work or adjust deadlines to avoid overload.
- If a role‘s forecasted utilization falls below 60% for the next 4–8 weeks, work with sales to bring in pipeline work or plan internal projects/training.
- If a billable role consistently misses its billable utilization target, check their non-billable workload and reprioritize.
📚 Read more: Billable utilization: Increase profits with the right strategy & tools
Profitability dashboards
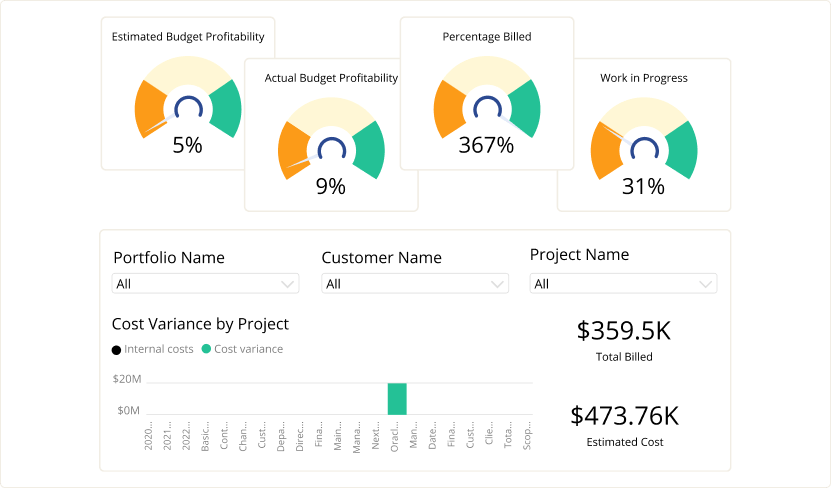
Profitability dashboards look beyond just revenue to measure the financial health of your projects and clients. They determine if the money earned from a project outweighs the total cost incurred to deliver it.
Key Profitability Metrics:
- Margin: The percentage of revenue remaining after subtracting direct costs.
- Cost vs. Revenue: Real-time tracking of labor costs (based on internal cost rates) versus recognized revenue and billings.
- Profitability by Portfolio: Margin comparison across clients, service lines, or entire project portfolios.
Profitability can fluctuate due to scope creep, resource mix changes, or inaccurate initial estimates. A strong profitability dashboard helps you understand why the margin varies across projects and resource types.
What Birdview‘s profitability dashboards show:
These dashboards provide real-time project margin tracking. They show the breakdown of actual costs (labor expenses from timesheets and cost rates) versus recognized revenue and billings. You can drill down to see profitability by project, client, or service type.
Actions to take
- When overages appear, act immediately. Adjust the billing model if the contract allows it. Introduce change orders for scope additions. Don’t let small overruns pile up into big losses.
- Review your resource mix. Can you shift more hours to mid-level staff without sacrificing quality? Can you reduce senior oversight on routine tasks?
- Cut non-billable work on projects already running tight. Every internal meeting or admin task on a struggling project makes the margin worse.
- Use historical performance data in Birdview to revisit your estimates and pricing. If web design projects consistently run 20% over estimate, your estimates are wrong. Fix them for next time.
Birdview’s project accounting tracks cost rates, billable rates, and profitability as hours get logged. You don’t need to wait for month-end reports to see problems developing.
Examples of when to act
- If a project‘s gross margin drops below target or falls more than 5 points since the last review, pause extra scope, reassess profitability, and agree on a change order before continuing.
- If senior roles are logging more hours than expected, shift routine work to mid-level staff and reserve senior time for complex tasks.
- If a project exceeds planned hours by more than 10% in two consecutive sprints, hold a margin review and update estimates and pricing for future work.
- If multiple projects for the same client show low margins, review and adjust the overall commercial model for that client.
📚 Read more: Boosting your bottom line: how PSA software improves project profitability
Forecasting dashboards
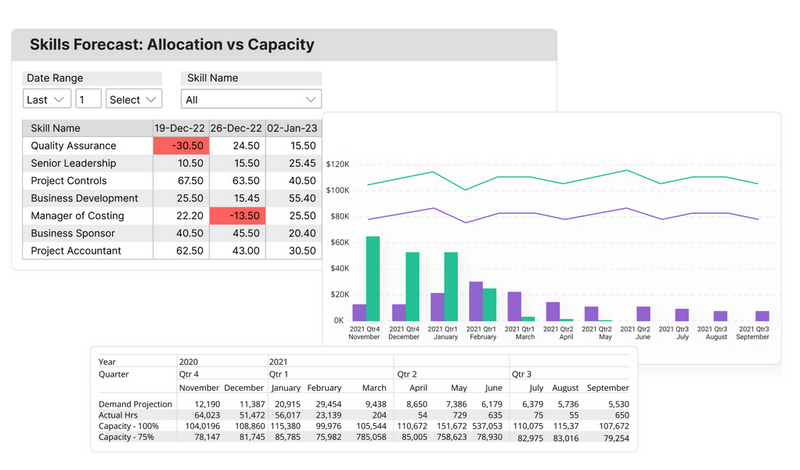
Forecasting is about looking ahead. These dashboards use current data to predict future capacity needs, resource allocation demands, and financial outcomes.
Key Forecasting Insights:
- Future Demand: How many hours of work are scheduled in the next weeks or months, broken down by skill or role.
- Capacity Gaps: Predictions of upcoming resource shortages (need to hire) or surpluses (need to fill the pipeline).
- Forecasted Revenue/Cost: Projected future financials based on current projects, estimated effort, and contract rates.
Forecasting is vital for proactive planning. It allows you to address potential staffing issues or budget challenges long before they become crises.
What Birdview‘s forecasting dashboards show:
These dashboards project resource demand against available capacity weeks or months into the future. They show forecasted revenue based on scheduled work and associated contract rates. When integrated with your CRM, they also incorporate pipeline opportunities to paint a full picture of future resource needs.
Actions to take
- Run scenarios before making decisions. What happens if you hire two more developers? What if you delay Project B to fit in Project A? Test it in Birdview before committing.
- Pull potential work from your pipeline into the resource forecast. If that $200K opportunity closes, do you have the team to deliver it? Validate capacity before signing contracts.
- Identify skill gaps early. If you need a specific expertise in six weeks and nobody on staff has it, start recruiting or training now.
- Keep forecasts accurate by ensuring project managers update their estimates regularly. Stale data produces worthless forecasts. Make estimate updates part of the weekly routine.
Birdview’s capacity management tools align staffing plans with upcoming demand. You can model different futures and pick the one that works.
Examples of when to act
- If the forecast shows a shortage of more than 1 FTE in a critical role within 4–8 weeks, begin hiring, bring in contractors, or rescope work before the crunch hits.
- If a team is projected to have over 20% surplus capacity next month, schedule training or internal projects, or ask sales to prioritize deals that match that team‘s skills.
- If a large, high-probability deal is expected to close soon, confirm that the required roles have enough capacity before committing to delivery.
- If next quarter‘s forecasted revenue is below target, use forecast and pipeline data to decide whether to push sales, adjust pricing, slow hiring, or reduce discretionary spend.
📚 Read more: Capacity forecasting: how do you forecast your team‘s capacity?
How utilization, profitability, and forecasting dashboards work together
On their own, each dashboard helps you fix one type of problem. Together, they form a single control system for your firm. These dashboards aren’t separate tools. They’re part of one system.
Utilization drives profitability. Too low and you’re leaving revenue on the table. Too high and people burn out, quality drops, and costs spike from mistakes and rework.
Forecasting prevents utilization and profitability crises. You can’t fix a capacity shortage the day it arrives. You need to see it coming weeks ahead.
Service firms should check all three dashboards weekly, not monthly. Monthly is too slow. By the time you spot a problem in last month’s report, you’re already deep into this month’s version of the same problem.
Birdview centralizes these dashboards using consistent data across project management, resource planning, and finance. When one person logs hours, all three dashboards update. You’re looking at the same numbers, not three different versions of the truth.
Practical workflow: a weekly dashboard review routine for service firms
To turn insight into action, your firm needs a consistent management rhythm. Here is an example of a weekly routine:
| Day | Dashboard Focus | Action Taken |
| Monday morning | Utilization | Review team members flagged as over-allocated for the current week. Rebalance tasks and communicate workload shifts before the week gets underway. |
| Mid-week (Wednesday) | Profitability | Check all actively running projects, focusing on those where the margin has dropped by more than $5\%$ since the last review. Course-correct immediately: initiate change control, or speak to the project manager about cost containment. |
| Friday afternoon | Forecasting | Review capacity demands for the next 4-8 weeks. If gaps (surplus or shortage) appear, finalize hiring decisions, move non-billable training activities into surplus time slots, or contact sales to push more pipeline work. |
How Birdview PSA enhances utilization, profitability, and forecasting analysis
Birdview is designed to solve the data consistency problem by housing all project data in one place.
- Real-Time Margin Analysis: Automated project accounting tracks cost and billable rates against actual hours, giving you a true, real-time margin without waiting for the accounting department.
- Connected Forecasting: Integrating your CRM pipeline with Birdview allows sales opportunities to feed directly into the forecasting dashboard. This immediately shows the impact of a potential deal on future resource capacity.
- Unified Data: Unified data means using the same allocation data for resource planning, utilization, and labor cost calculations. This keeps your financial and operational reports based on a single source of truth.
Turning insight into action with Birdview PSA
Dashboards only matter when they change what you do. The best dashboard in the world is useless if nobody acts on what it shows.
Build a routine. Make dashboard reviews part of your operational rhythm, not a special event. Train your team to read the data and understand what actions to take.
Start with one dashboard if three feels overwhelming. Get comfortable with utilization first, then add profitability, then forecasting. Better to use one well than use three poorly.
The goal isn’t perfect data. It’s better decisions, made sooner, based on reality instead of hunches. That’s what keeps service firms profitable, sustainable, and growing.
If you want to see how these dashboards work in practice, try Birdview for free. Explore utilization, profitability, and forecasting dashboards with your own data.