Running projects without Business Intelligence (BI) is like driving blindfolded–delays stack up, budgets spiral, and teams struggle to keep pace. BI clears the fog with real-time dashboards, interactive reports, and deep data insights, giving you the power to visualize, analyze, and interpret project performance. With Birdview PSA, you can forecast project success, track resources, and monitor finances with detailed views into labor costs, project expenses, and profitability. If you’re still tangled in spreadsheets, you’re complicating things–ditch the chaos, take control, and manage projects confidently using Birdview PSA. 🚀
What is (BI) in project management: Why it matters, and how Birdview PSA make a difference
Business Intelligence (BI) helps project managers turn raw data into actionable insights. Instead of guessing, they can track real-time performance, spot risks early, and adjust plans before small issues turn into major problems.
Without BI, project tracking feels like navigating in the dark.
Delays go unnoticed, budgets spiral out of control, and resources get misallocated. With BI, managers get clear visibility into schedules, costs, and team workload–all in one place.
👉 BI tools, such as Birdview PSA, take this a step further. They provide interactive dashboards, automated reports, and real-time data visualization.
Instead of sifting through spreadsheets, managers can access key project metrics instantly.
- Need to compare planned vs. actual costs? Check a report.
- Want to know which tasks are slowing down progress? View a live dashboard.
Data isn‘t useful unless it drives better decisions. BI removes the guesswork and puts control back in your hands.
If you’re managing projects without it, you’re leaving success to chance.
What are the three areas of BI?
| Area of BI | Description |
| 1. Data Analysis & Reporting | Overview: Manually collecting and analyzing project data wastes time and leads to errors. BI automates the process by pulling data from multiple sources and transforming it into visual dashboards.
Benefits: Instead of piecing together numbers from different reports, you get a clear, up-to-date snapshot of project progress. Key Features: – Real-time project progress visualization – Instant insights on resource allocation, overdue tasks, and budget status |
| 2. Predictive & Prescriptive Analytics | Overview: Project risks don‘t have to catch you off guard. Predictive analytics identifies trends and warns about potential issues like delays, cost overruns, or staffing shortages before they happen.
Benefits: React proactively by fixing problems before they arise. Key Features: – Predictive analytics to foresee project issues – Prescriptive analytics to recommend solutions (e.g., task reassignment, workload adjustments, deadline shifts) |
| 3. Strategic Planning & Optimization | Overview: BI enhances strategic planning by tracking resource usage and highlighting inefficiencies.
Benefits: Real-time tracking allows for smarter resource allocation and better planning. Key Features: – Optimize resource allocation based on real-time data – Track spending daily and take action before costs escalate – Improve budgeting accuracy and avoid last-minute surprises |
How BI helps in goal alignment, productivity enhancement, and cost control
Now let‘s learn how BI helps align goals, uplift productivity, and control costs by giving teams real-time insights to make smarter decisions.
🔷 Keeping projects aligned with business goals
A project without clear direction wastes time and money. BI connects project work to business objectives, making it easier to track progress. Instead of waiting for quarterly reviews to discover gaps, managers get real-time updates on KPIs, milestones, and resource allocation.
With BI dashboards, teams don‘t have to spend hours preparing reports. Leadership sees a live view of progress, risks, and results. If a project starts drifting off course, adjustments happen immediately, not weeks later.
🔷 Improving productivity without overloading teams
BI helps managers find and fix inefficiencies before they slow things down. If tasks take longer than expected, BI pinpoints the bottlenecks. If one team member is overloaded while another has capacity, BI makes it easy to rebalance the workload.
Instead of wasting time on manual reporting, teams work on what actually moves projects forward. BI automates tracking, updates dashboards instantly, and eliminates the need for constant check-ins.
Less time spent on admin tasks means more time spent delivering results.
Explore ▶️ Power BI (Business Intelligence) reports
🔷 Preventing budget overruns
Budgets go off track when spending isn‘t monitored in real time. BI compares planned vs. actual costs throughout the project, flagging unexpected spikes before they become unmanageable. Instead of discovering a problem after the money is gone, managers adjust spending as the project unfolds.
BI also helps teams avoid repeated financial mistakes.
If a certain phase consistently runs over budget, BI highlights the trend. With that insight, managers adjust forecasts and spending habits instead of making the same costly errors again.
What should be the business intelligence roadmap for project management?
Follow these steps to set up a BI system that keeps projects on track, helps teams stay organized, and makes decision-making easier.
Step 1: Define what BI needs to fix
BI should solve real project issues, not just collect data for the sake of it. Before setting up dashboards or picking tools, identify the biggest challenges.
👉 Are projects running past deadlines?
👉 Are budgets unpredictable?
👉 Are managers struggling to track team performance?
Meet with stakeholders to focus on the right priorities. If executives want financial forecasts, BI should highlight spending patterns.
If project managers need real-time tracking, dashboards should focus on task progress and workload distribution.
Avoid tracking unnecessary metrics–cluttered dashboards only create confusion.
Step 2: Identify reliable data sources
Good BI depends on good data. If the numbers aren‘t accurate, the insights won‘t be useful. Identify which internal and external data sources matter most.
Pull internal data from project timelines, budgets, resource allocation, and risk assessments. Supplement it with external sources like vendor pricing, industry benchmarks, and client feedback.
Before integrating data into BI tools, standardize collection methods to prevent inconsistencies.
Step 3: Choose BI tools that fit the business
Not every BI tool works for every project. Some focus on visualization, while others provide advanced analytics.
If your team already works with Microsoft 365, Power BI might be a natural choice. If AI-driven forecasting is important, look for platforms with strong predictive analytics.
Integration matters!
A BI tool that doesn‘t connect with project management software creates more problems than it solves. Choose a platform that automates reporting, updates dashboards in real time, and reduces manual effort.
Explore ▶️ Top 30+ AI project management tools in 2025
Step 4: Train teams and make BI part of daily operations
A BI system only works if teams actually use it. If dashboards feel overwhelming or reports don‘t seem useful, people will ignore them.
Make training hands-on and relevant. Use real project data instead of generic examples. Show project managers how BI can help them track overdue tasks, spot budget risks, and improve planning.
Assign BI champions within teams to answer questions and keep adoption on track.
Step 5: Monitor, adjust, and improve
BI isn‘t a one-time setup. Once teams start using it, track what works and what doesn‘t. If a dashboard isn‘t providing value, simplify it. If a report isn‘t being used, replace it with something more actionable.
Gather regular feedback.
If teams struggle with a report, tweak the layout. If a process feels too manual, automate it. Keep improving BI so it stays useful and helps teams make better decisions.
How does Birdview PSA support BI in project management?
1️⃣ Real-time data visibility
Guesswork has no place in project management. If you‘re constantly chasing updates or struggling to see where a project stands, something needs to change.
Birdview PSA gives you live project dashboards and real-time reports, so you‘re never stuck waiting for outdated information.
Track resource allocation, financials, and project progress in one place. No more manual updates or miscommunication. Set up automated alerts to catch potential roadblocks before they slow you down.
Managers can skip the spreadsheet deep dives. Teams stay aligned with the latest data. Everyone knows exactly what‘s happening–without endless back-and-forth emails.
2️⃣ Advanced forecasting & predictive analytics
Planning projects shouldn‘t feel like a guessing game. If you‘re tired of missed deadlines and unexpected resource shortages, Birdview PSA‘s AI-powered forecasting can help.
The system analyzes past project data to predict completion times with better accuracy. Instead of scrambling to adjust schedules at the last minute, you‘ll know in advance if a project is veering off track.
AI also helps distribute resources smarter. No more overloading teams or stretching budgets too thin. When risks start creeping in, predictive analytics highlight them early, so you can make adjustments before small issues turn into big problems.
Stay ahead of delays. Let AI do the heavy lifting while you focus on keeping things moving.
3️⃣ Customizable BI dashboards & reports
Standard reports don‘t always cut it. Sometimes you need high-level financial summaries, and other times you need a deep dive into billable hours or project profitability.
Birdview PSA gives you over 300 pre-configured dashboards and reports, plus the flexibility to build custom reports that fit your needs.
- Executives get the big-picture data.
- Project managers see workload distribution.
- Teams track individual tasks.
Everyone gets exactly what they need–without sorting through information that doesn‘t matter to them.
Key BI features in Birdview PSA for project management
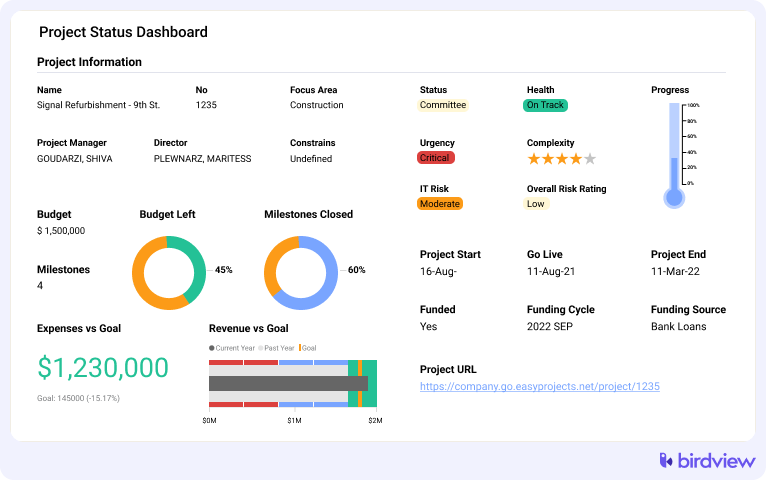
✅ Project performance analytics
Birdview PSA gives you real-time KPIs in one place, so you always know what‘s on track and what‘s falling behind. Spot delays before they turn into major problems.
Compare actual progress to the plan and fix bottlenecks before they slow everything down. Keep an eye on profitability by tracking revenue against costs and adjusting where needed.
✅ Resource utilization & capacity planning
Overworked teams burn out. Underutilized teams waste money. Neither helps your projects. Birdview PSA helps you balance workloads by showing real-time availability. No more scrambling to find available resources or stretching teams too thin.
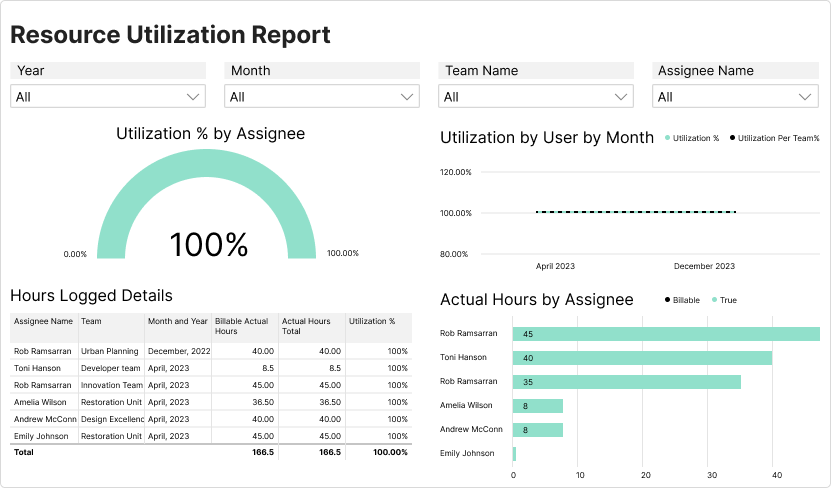
Adjust allocations on the fly, keep work evenly distributed, and make sure no one is drowning in tasks while others sit idle.
Explore ▶️ Resource underutilization
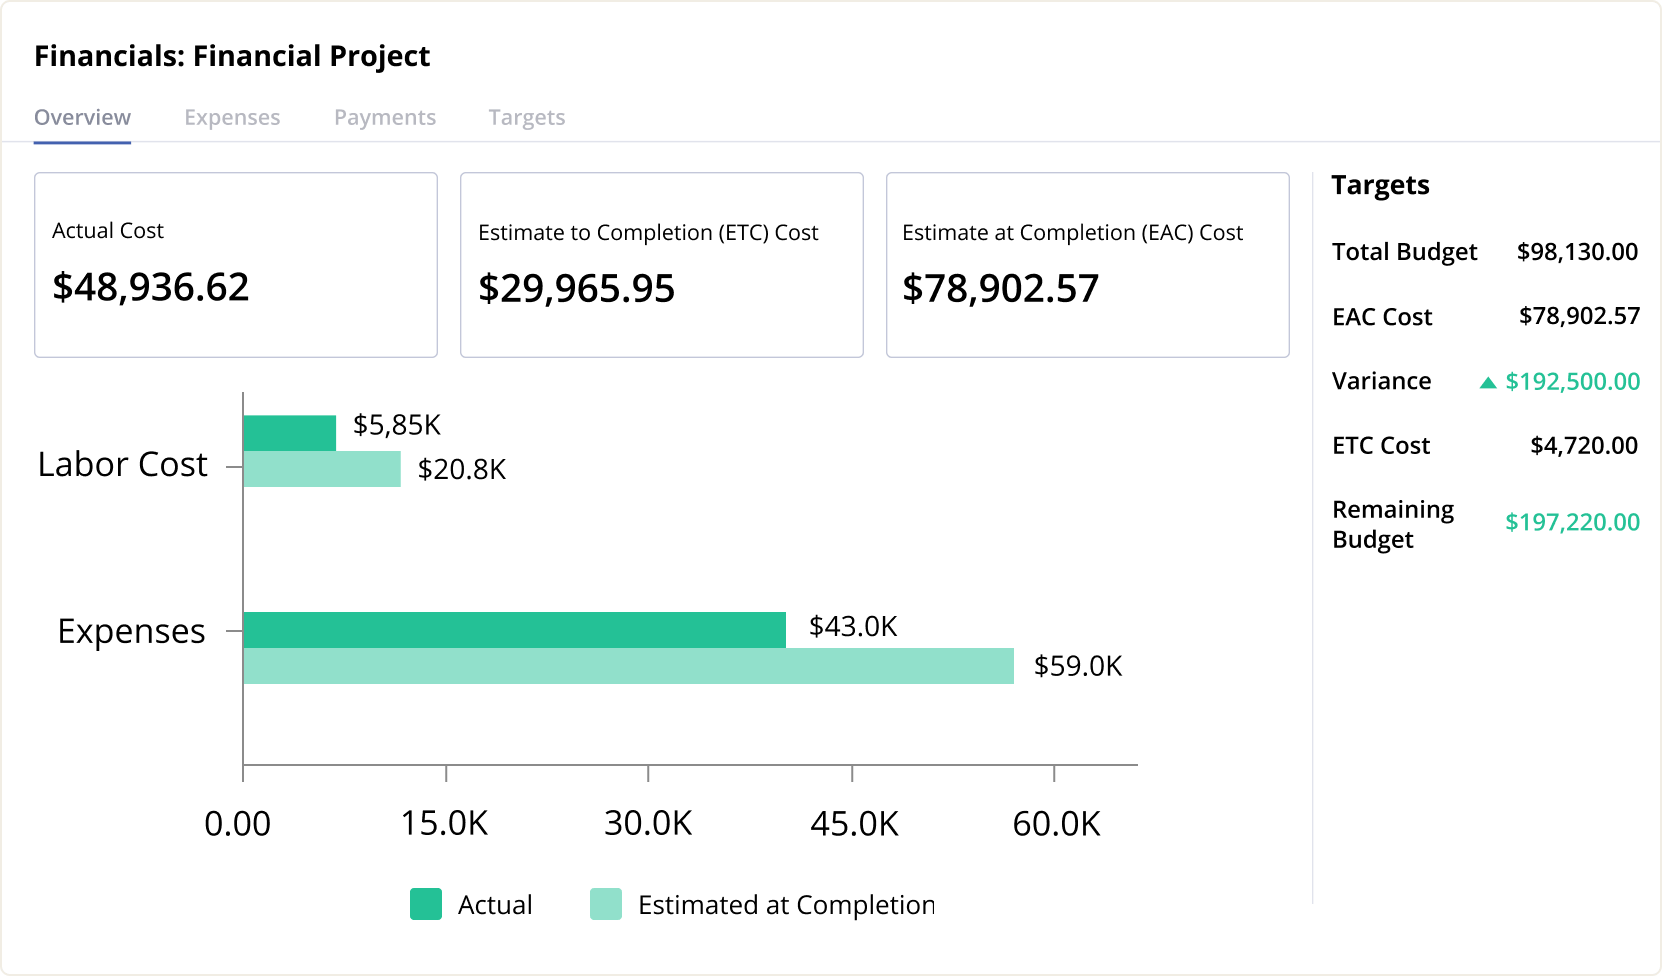
✅ Financial tracking & budget optimization
Untracked expenses pile up fast. Birdview PSA keeps every cost, billable hour, and invoice in check. Set budget limits and get alerts before spending gets out of hand. Compare planned vs. actual costs, so you always know where money is going.
Use revenue forecasting to plan ahead instead of reacting to surprises. Stay on top of project financials without digging through endless spreadsheets.
✅ Portfolio management for multiple projects
Managing one project is tough. Managing ten? That‘s chaos–unless you have the right tools. Birdview PSA lets you group projects into project portfolios, giving you a high-level view of everything.
See which projects need attention, where resources are stretched, and what‘s bringing in the most revenue. Shift priorities as needed and make better calls on where to focus time and budget.
Integrating Birdview PSA with other BI tools
💡 Seamless integrations with 5,000+ apps
No more switching between platforms. Birdview PSA integrates with Power BI, QuickBooks, Salesforce, and thousands of other apps. Pull project data into Power BI for deeper insights.
Sync with QuickBooks to track costs without extra work. Align projects with sales in Salesforce. Everything stays connected, so you get the full picture without the hassle.
Business intelligence project plan: How to plan a successful BI project?
A BI project needs a clear plan from the start. Without one, teams end up with dashboards no one uses, reports full of bad data, and more confusion than clarity.
A well-structured approach keeps everything on track and makes sure BI actually helps teams make smarter decisions.
Step 1: Talk to stakeholders and identify needs
BI only works when it solves real business problems. Before setting up dashboards or choosing tools, talk to the people who will use the system. Executives, department heads, and end-users all have different needs.
Their input helps shape BI so it delivers useful insights.
Ask questions like:
👉 What reporting challenges slow down decision-making?
👉 What business goals should BI support?
👉 What data do you currently track, and what‘s missing?
👉 How do you generate reports today, and what are the biggest frustrations?
👉 Where do you see the biggest gaps in visibility?
These conversations highlight real pain points and keep BI from becoming just another unused tool.
Step 2: Map how data moves through the business
BI should fit into existing workflows, not disrupt them. Mapping out how teams collect, store, and share data helps uncover bottlenecks and areas where BI can make an immediate difference.
Start by outlining:
👉 Where data comes from and how it’s collected.
👉How teams currently access and analyze information.
👉 What manual processes slow things down.
This step prevents surprises later. If BI doesn‘t align with how teams work, adoption will be low. A clear map also helps teams see exactly how BI will improve daily operations.
Step 3: Build and test a prototype
Instead of launching a full BI system all at once, start with a small-scale version. Build a prototype that includes core reports and dashboards, then test it with real users.
Focus on:
👉 Making sure reports pull accurate data from the right sources.
👉 Checking if dashboards present insights in a way that‘s easy to understand.
👉 Gathering feedback and adjusting before rolling out the full system.
Skipping this step leads to dashboards that look great but don‘t actually help teams make decisions. Testing early avoids costly fixes later.
Benefits of BI for project managers and teams
| Benefit | How It Helps | Why It Matters |
| Increasing productivity with data-driven insights | Automates reporting, eliminates manual data entry, and flags delays early. | Teams stop wasting time on spreadsheets and focus on getting work done. |
| Improving performance while reducing risks | Predicts project slowdowns, budget issues, and recurring bottlenecks. | Managers make adjustments before small problems turn into major setbacks. |
| Enhancing resource transparency and allocation | Shows real-time workloads, availability, and where teams are stretched too thin. | Leaders shift resources as needed instead of making last-minute fixes. |
| Delivering real value through efficient sourcing and cost management | Tracks vendor performance, spending patterns, and where money is going. | Teams catch unnecessary expenses early and make smarter financial decisions. |
Key aspects of business intelligence in project management
Focus on the following core areas to build a BI system that actually helps teams stay on track.
▶️ Data gathering & preparation
Bad data leads to bad decisions. If reports pull from outdated, incomplete, or inconsistent sources, teams waste time fixing errors instead of solving problems.
Standardize how teams collect and store data. Remove duplicates, fill in missing values, and validate accuracy before feeding information into BI tools.
Automate data entry where possible to cut down on manual mistakes. The cleaner the data, the better the insights.
▶️ Requirement analysis
BI should solve real project challenges, not just collect numbers. Without clear goals, teams end up with dashboards packed with irrelevant data that no one uses.
Work with stakeholders to pinpoint what matters.
- Are deadlines slipping?
- Is the budget unpredictable?
- Are resources stretched too thin?
Focus BI efforts on answering these questions instead of cluttering reports with unnecessary metrics.
▶️ Architecture design
BI needs to grow with the business. A rigid setup creates bottlenecks and forces teams to rebuild the system when projects expand.
Choose a structure that scales. Connect BI tools to project management software, financial systems, and external data sources.
Use cloud-based platforms for real-time access. Keep data storage flexible so teams don‘t have to overhaul everything when new projects roll in.
▶️ Development & implementation
A BI system should make project management easier, not more complicated. If dashboards feel overwhelming or reports take forever to generate, teams won‘t use them.
Keep dashboards clear and focused. Highlight the most important KPIs, keep navigation simple, and automate data updates to eliminate manual reporting.
Test everything with real project data before rolling it out across the team.
▶️ User training & adoption
A BI tool is useless if no one uses it. If teams don‘t trust the data or find the system too complicated, they‘ll stick to old methods.
Make training hands-on. Use real project data instead of generic examples. Show project managers how to track overdue tasks, spot budget risks, and adjust workloads in real time.
Assign BI champions in each department to answer questions and encourage adoption.
▶️ Monitoring & continuous improvement
BI isn‘t a one-time setup. A system that works today might not meet project needs tomorrow.
Check how teams use BI.
If a report isn‘t being used, simplify it. If dashboards don‘t help with decision-making, adjust them. Gather feedback regularly and refine the system to keep it valuable.
A good BI setup adapts to business needs instead of becoming outdated.
Common BI project management methodologies
BI projects need a structured approach to stay on track. Choosing the right methodology shapes how teams develop, implement, and scale BI systems.
Each approach comes with benefits and challenges. Picking the right one depends on project complexity, timelines, and how much flexibility teams need.
1️⃣ Agile BI approach – Adapting to changing project needs
Agile BI breaks projects into smaller, iterative phases. Instead of waiting months for a final product, teams release updates regularly. Feedback drives improvements, keeping BI systems aligned with business needs.
Pros:
- Delivers quick insights by releasing BI features in smaller increments.
- Adapts easily to new requirements without disrupting the entire project.
- Encourages collaboration between teams and stakeholders.
Cons:
- Requires constant involvement from users to refine each iteration.
- Lacks a fixed end date, which can lead to scope creep if not managed.
- Can be difficult to track long-term progress without proper planning.
2️⃣ Waterfall methodology for BI – A structured, phased approach
Waterfall follows a linear process. Teams complete one phase before moving to the next. This method works best when BI requirements are clear from the start.
Pros:
- Provides a structured roadmap with defined timelines.
- Reduces uncertainty since each phase gets completed before the next begins.
- Works well for BI projects with strict compliance or documentation needs.
Cons:
- Makes it hard to adjust BI features once a phase is completed.
- Slows down delivery since teams must wait for each step to finish.
- Increases the risk of outdated reports if requirements shift during development.
3️⃣ Incremental approach to BI – Scaling over time
Instead of launching a full BI system at once, teams roll out features gradually. This method balances structure with flexibility, allowing teams to test and expand BI capabilities as needed.
Pros:
- Reduces risk by allowing teams to adjust BI features between releases.
- Keeps users engaged by delivering improvements at regular intervals.
- Makes BI adoption easier since teams don‘t have to learn everything at once.
Cons:
- Requires long-term commitment since BI development never truly “ends.”
- Can lead to inconsistent reporting if different parts of the system evolve at different speeds.
- Needs strong coordination to avoid gaps between different BI modules.
4️⃣ Iterative and agile BI (scrum-based) – Fast development with frequent adjustments
Scrum-based BI follows Agile principles but organizes work into short sprints. Teams complete specific BI tasks within a set timeframe, review progress, and adjust before starting the next sprint.
Pros:
- Speeds up delivery by focusing on small, high-priority BI improvements.
- Encourages frequent collaboration between developers and users.
- Makes it easy to adjust BI dashboards, reports, and data models as business needs change.
Cons:
- Can overwhelm teams if priorities shift too often.
- Requires strong leadership to keep sprints focused.
- Needs constant feedback from users, which can slow down teams if they wait for approvals.
Frequently asked questions (FAQs)
What is applied business intelligence for project managers?
Applied business intelligence (BI) for project managers involves using real-time dashboards and analytics to track project timelines, resources, and budgets. It enables proactive risk identification and informed decision-making, reducing reliance on manual reports and outdated information.
How can BI be used to improve project decision-making?
BI uses real-time data and predictive analytics to forecast potential delays or budget overruns. By identifying trends from past projects, managers can address recurring issues proactively, improving resource allocation and overall decision-making efficiency.
What are the key benefits of integrating BI with project management tools?
Integrating BI with tools like Birdview PSA consolidates project data into a single platform, reducing manual reporting errors and enhancing collaboration. Real-time insights ensure alignment across teams and facilitate quicker, informed decisions, effectively managing resources and preventing bottlenecks.
Final say
AI, machine learning, and automation have completely changed how project managers handle Business Intelligence (BI).
If you’re still relying on outdated reports, manual tracking, and last-minute fixes, you’re adding unnecessary stress to your workflow.
BI tools now provide real-time insights, flagging risks before they escalate, predicting delays, and keeping budgets in check. Instead of reacting to problems after they derail your plans, you can catch and fix them early.
▶️ Birdview PSA takes it even further with AI-driven forecasting, automated reporting, and seamless integrations with tools like Power BI and QuickBooks. No more digging through spreadsheets or chasing updates.
Get real-time visibility, balance workloads, and keep projects on track without the guesswork.
It‘s time to stop putting out fires and start managing with confidence.