Leonid Kostin
 - A resource utilization dashboard provides real-time visibility into workforce performance, helping organizations balance workloads, improve staffing decisions, and optimize capacity across projects.
- Tracking multiple utilization metrics is essential. Billable utilization, capacity utilization, resource availability, allocation percentage, and forecast utilization each provide different insights needed for effective resource planning.
- Utilization is about more than keeping employees busy. Sustainable utilization balances billable work, future capacity, employee wellbeing, and project profitability.
- Connected operational data makes utilization reporting actionable. Combining project schedules, resource allocations, time tracking, and capacity planning creates a single source of truth for better decision-making.
- Organizations that monitor utilization proactively can reduce resource conflicts, improve forecasting, increase billable work, and deliver projects more consistently without relying on spreadsheets or reactive staffing decisions.
For professional services organizations, people are the business. Revenue depends on having the right consultants, engineers, developers, designers, or specialists working on the right projects at the right time. Yet many operations leaders still struggle to answer fundamental questions:
- Which consultants are overloaded?
- Who has available capacity next month?
- Are our highest-value skills being fully utilized?
- Which teams are consistently underutilized?
- Will we have enough people to deliver projects already in the pipeline?
Without clear answers, staffing becomes reactive. Managers rely on spreadsheets, manually update resource plans, and discover capacity problems only after projects begin to slip or employees become overwhelmed.
A resource utilization dashboard brings these answers together in one place. By combining resource allocation, workload, capacity, availability, and time tracking data, it provides a real-time picture of how effectively an organization’s workforce is being used. Instead of reacting to staffing issues after they affect project delivery, operations teams can identify risks early, balance workloads, and make better planning decisions.
This guide explains what a resource utilization dashboard is, which metrics matter most, the different dashboard views organizations should use, and how utilization reporting supports better operational performance.
Why resource utilization matters for service firms
For service organizations, utilization is one of the strongest indicators of operational health. Since employee time represents the majority of delivery costs, every staffing decision directly affects revenue, profitability, and client satisfaction.
Resource utilization measures how effectively available working time is being used. But utilization is about much more than keeping people busy. High-performing organizations aim to maximize productive work while maintaining enough flexibility to absorb new projects, respond to client changes, and prevent employee burnout.
Without visibility into utilization, organizations often experience problems such as:
- inconsistent workloads across teams
- overallocated specialists becoming delivery bottlenecks
- highly skilled consultants sitting on the bench
- reactive staffing decisions
- delayed hiring because future demand isn’t visible
- spreadsheet-based reporting that becomes outdated within days
These challenges appear repeatedly as organizations grow. In Birdview’s analysis of customer discovery conversations, outgrowing spreadsheets, difficulty forecasting resource demand, and limited visibility into capacity consistently emerge as leading operational pain points, especially among consulting, engineering, and IT services firms.
The cost isn’t limited to operational inefficiency.
Poor utilization contributes to:
- lower billable revenue
- missed project deadlines
- higher employee turnover
- increased write-offs
- rushed hiring decisions
- reduced project profitability
A well-designed utilization dashboard helps organizations detect these issues before they become financial problems.
What is a resource utilization dashboard?
A resource utilization dashboard is a reporting dashboard that combines resource allocation, workload, availability, capacity, and time tracking data into a single operational view.
Instead of reviewing multiple spreadsheets or separate project reports, managers can immediately understand:
- how busy each employee is
- whether teams have available capacity
- which specialists are overallocated
- where future staffing gaps are likely to occur
- how utilization trends change over time
Unlike a simple workload report, a utilization dashboard connects operational metrics across multiple projects and planning horizons.
For example, a resource manager might notice that a consulting team is currently operating at 82% billable utilization. On its own, that number provides limited insight. When combined with allocation schedules, upcoming project demand, approved vacation, and future pipeline work, the dashboard reveals whether the team can realistically accept additional projects or whether new staffing decisions are required.
This broader context transforms utilization reporting from historical measurement into a decision-making tool.
What makes an effective utilization dashboard?
An effective resource utilization dashboard does more than display KPIs–it helps managers make better staffing decisions by providing complete, up-to-date operational visibility.
Real-time visibility
Resource plans change constantly. Real-time reporting ensures managers always have an accurate view of workloads, allocations, and availability.
Actionable utilization metrics
The best dashboards focus on metrics that drive decisions, helping managers identify underutilized resources, overloaded teams, staffing gaps, and capacity constraints.
Capacity forecasting
Forecast utilization combines planned allocations, project schedules, approved leave, and future demand to identify staffing shortages before they affect project delivery.
Cross-project visibility
Employees often work across multiple projects. A centralized dashboard provides a complete view of their commitments, helping prevent resource conflicts and double-booking.
Early risk identification
Utilization trends help managers spot workload imbalances, declining capacity, and future bottlenecks early enough to rebalance resources before delivery is affected.
The most important resource utilization dashboards
Organizations rarely rely on a single dashboard. Different operational decisions require different views of the same resource data.
Together, the following dashboards provide a comprehensive picture of workforce performance.
Resource utilization dashboard
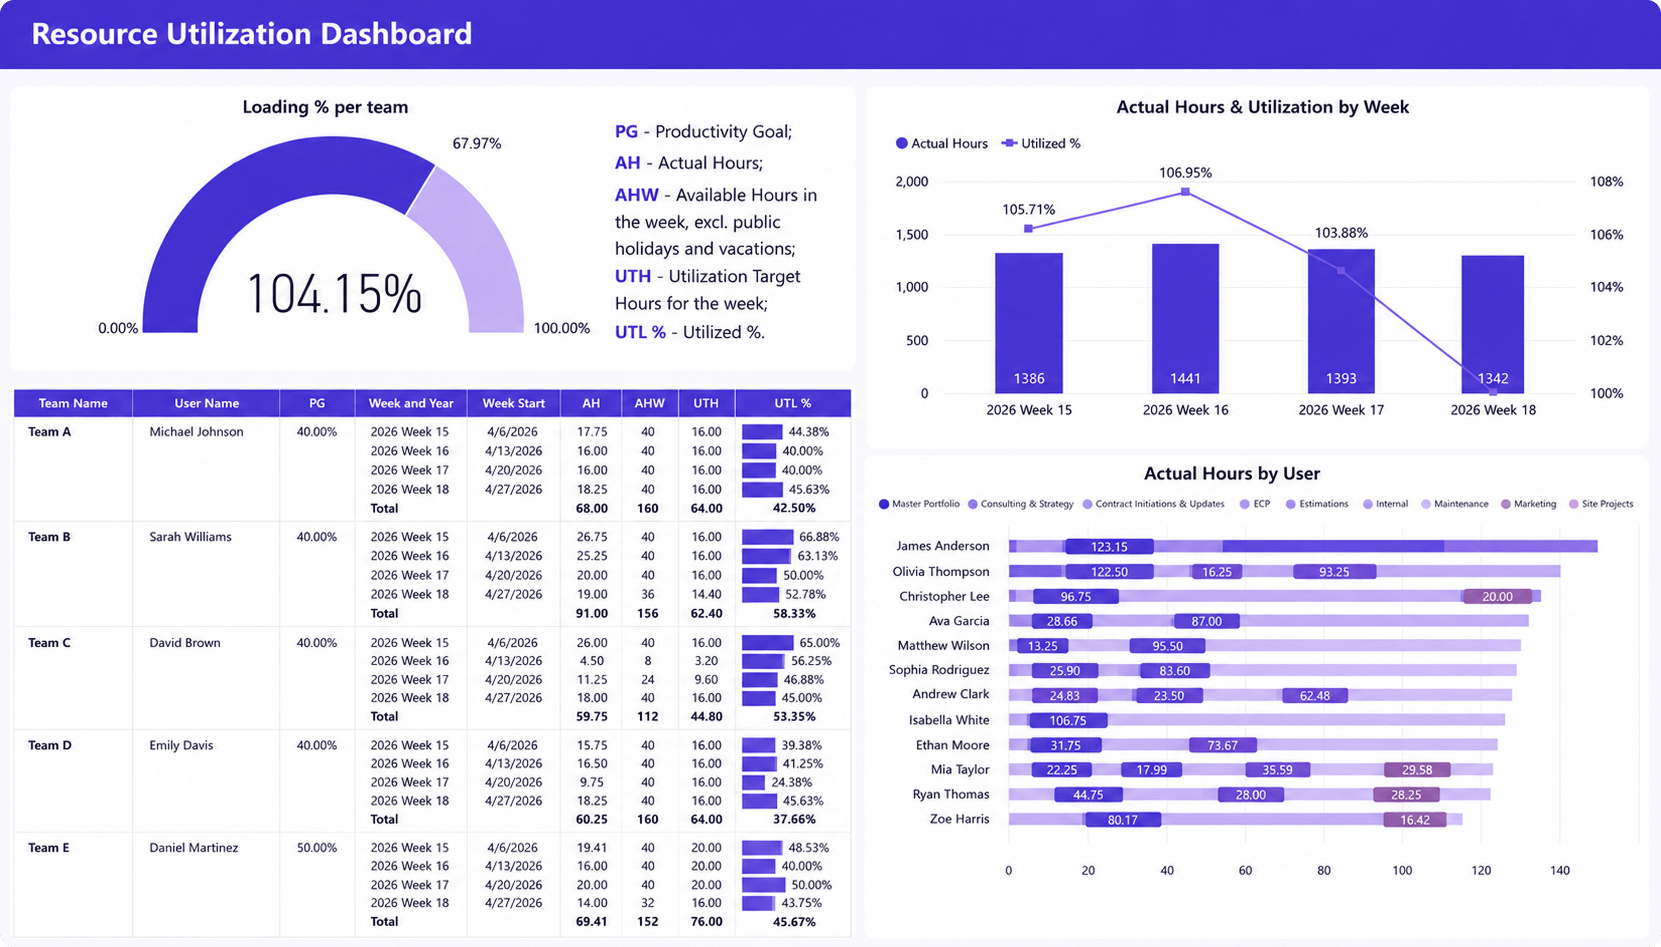
What it shows
- Resource utilization percentage by employee and team
- Utilization trends over time
- Actual hours worked versus utilization targets
- Productivity goals compared to actual performance
- Hours logged across projects and portfolios
Why it matters
Provides a complete view of how effectively teams are utilizing available capacity. By comparing actual utilization with productivity targets across employees and teams, managers can identify underutilized resources, monitor workload trends, and make data-driven staffing decisions.
Billable vs. non-billable utilization dashboard
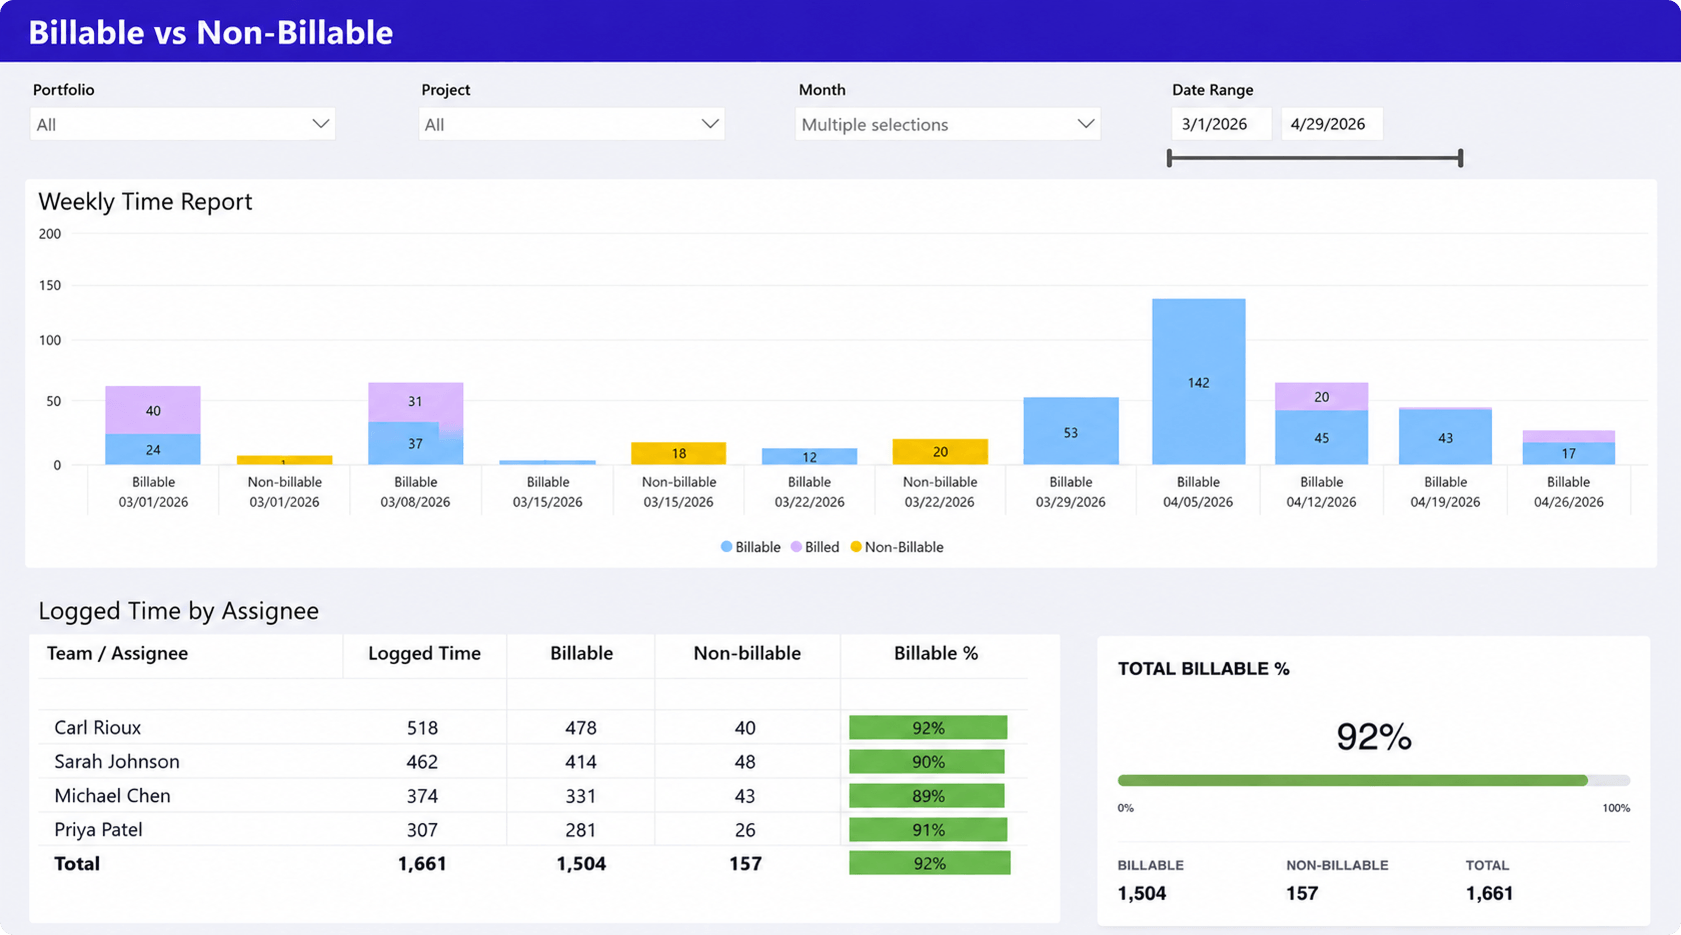
What it shows
- Billable versus non-billable hours
- Weekly billable time trends
- Logged time by employee or team
- Billable utilization percentage by assignee
- Overall billable utilization across the organization
Why it matters
Shows how effectively working hours are converted into billable work instead of internal activities. By tracking billable versus non-billable time across employees and teams, managers can identify utilization trends, improve resource allocation, and increase revenue without adding headcount.
Capacity planning dashboard
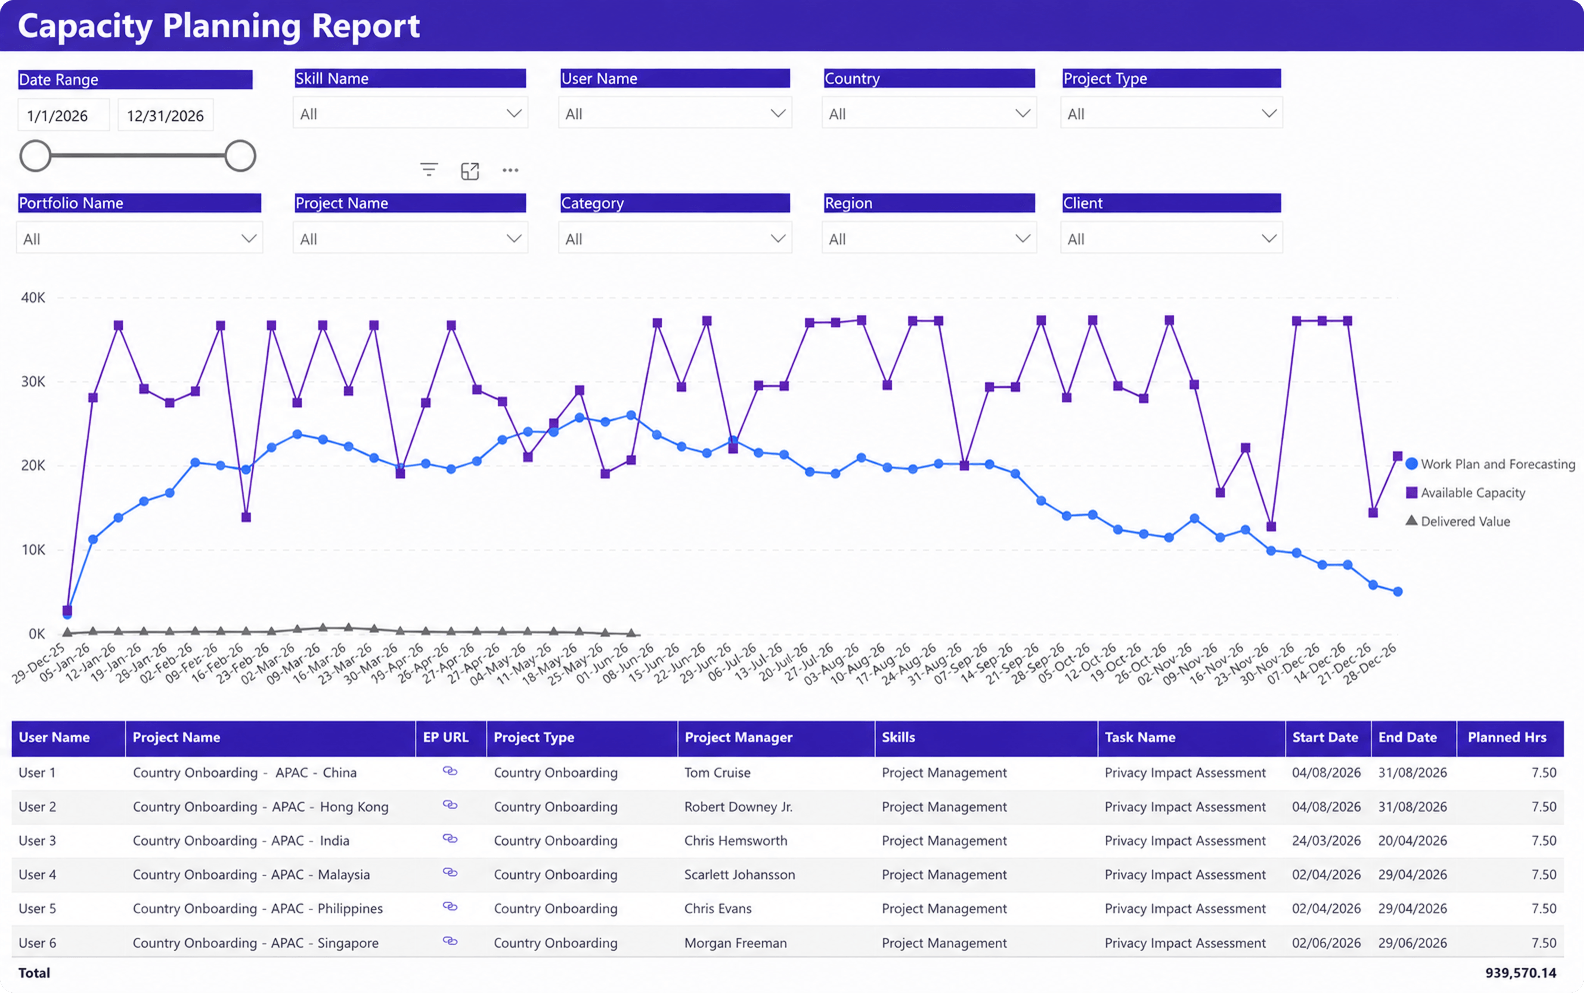
What it shows
- Available capacity by employee, role, or team
- Hard and soft resource allocations
- Remaining availability
- Capacity versus allocated hours
- Capacity trends over time
Why it matters
Shows whether teams have enough capacity to meet current and future demand. By comparing available capacity with planned allocations, managers can identify staffing shortages, avoid overallocation, and make more informed resource planning decisions.
Demand projections dashboard
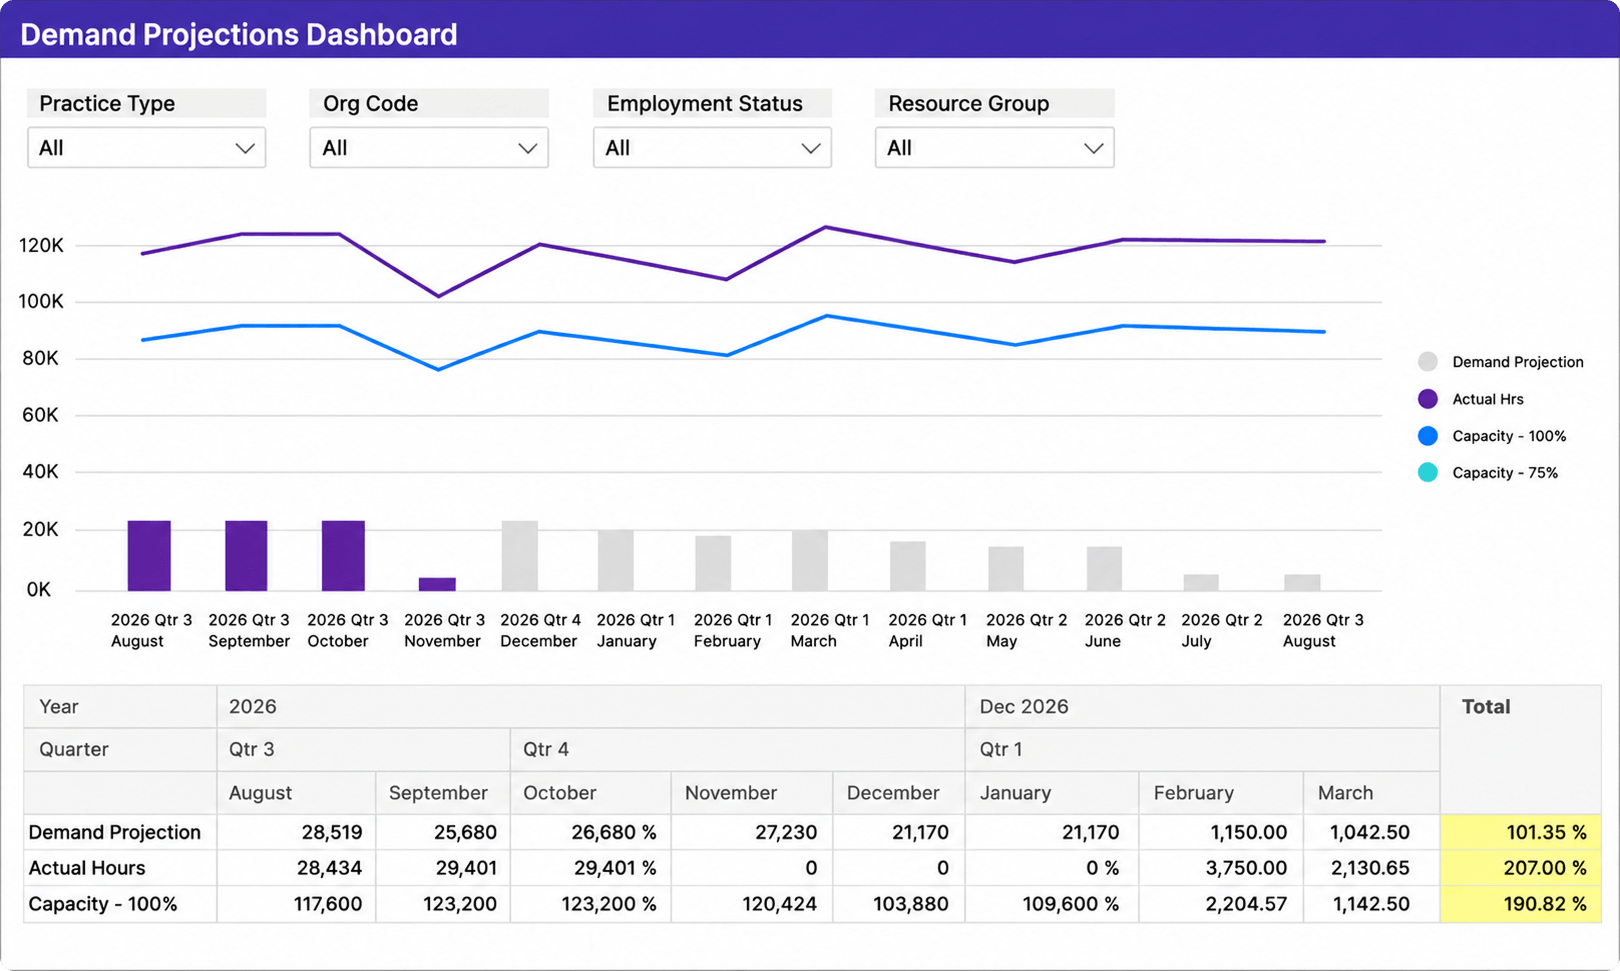
What it shows
- Forecasted resource demand over time
- Demand compared to actual hours worked
- Forecast demand versus available capacity
- Capacity trends by month or quarter
- Projected staffing gaps
Why it matters
Helps managers anticipate future resource demand and compare it against available capacity. By identifying upcoming staffing gaps early, organizations can make better hiring, allocation, and project planning decisions before delivery is affected.
The most important resource utilization metrics
Dashboards are only as valuable as the metrics they track. These KPIs provide the clearest picture of resource performance, capacity, and staffing needs.
Billable utilization
Measures the percentage of available working time spent on billable client work. It helps organizations evaluate how effectively employees contribute to revenue-generating projects.
Capacity utilization
Measures how much available workforce capacity has been allocated. It helps determine whether teams have room for additional work or require additional staffing.
Resource availability
Shows how much unallocated capacity remains after current commitments, helping managers assign new work without creating resource conflicts.
Allocation percentage
Measures the percentage of an employee’s capacity assigned across projects. Monitoring allocation helps identify both overloaded and underutilized resources.
Bench utilization
Tracks unassigned resources and bench time to help organizations reduce idle capacity and redeploy employees more effectively.
Workload balance
Measures how evenly work is distributed across teams, making it easier to identify imbalances that can lead to burnout or underutilization.
Forecast utilization
Estimates future resource demand using planned allocations, project schedules, and available capacity, helping managers anticipate staffing shortages.
Utilization by role
Breaks utilization down by job role, team, or department to highlight where demand exceeds available expertise and support hiring and staffing decisions.
Common utilization mistakes service firms make
Even organizations with mature reporting often make the same utilization mistakes. Avoiding them is just as important as tracking the right metrics.
Treating 100% utilization as the goal
Running every employee at full capacity leaves little room for meetings, training, business development, or unexpected client work. Sustainable utilization balances productivity with enough flexibility to maintain delivery quality and prevent burnout.
Looking only at historical utilization
Historical reports explain what has already happened. Combining them with forecast utilization and upcoming project demand helps managers anticipate staffing issues before they affect delivery.
Ignoring future capacity
Approving projects without confirming future resource availability often leads to overloaded teams, delayed starts, and rushed hiring. Capacity planning should be part of ongoing utilization reporting, not a separate exercise.
Measuring utilization without profitability
High utilization doesn’t always mean strong financial performance. Reviewing utilization alongside realization rates, labor costs, and project profitability provides a more complete view of business performance.
Managing utilization in spreadsheets
As organizations grow, spreadsheets quickly become outdated and difficult to maintain. Centralized reporting provides a single source of truth for utilization, capacity, and resource planning, helping teams make faster and more reliable staffing decisions.
How utilization dashboards improve operational performance
The value of a resource utilization dashboard isn’t in the reports it generates–it’s in the operational decisions it supports. By providing real-time visibility into workloads, capacity, and resource demand, utilization dashboards help organizations allocate people more effectively and respond to changes before they impact project delivery.
Better workload balancing
A centralized view of resource commitments helps managers identify overloaded and underutilized employees across projects. This makes it easier to rebalance work, prevent bottlenecks, and distribute workloads more evenly.
Improved staffing decisions
Forecast utilization highlights future capacity shortages before they become delivery issues. Managers can reassign resources, adjust project schedules, or begin hiring early instead of reacting when projects are already underway.
Higher billable utilization
Utilization dashboards reveal opportunities to reduce bench time, eliminate resource conflicts, and shift more available hours toward billable client work, improving revenue without increasing headcount.
Reduced burnout
By monitoring workloads and allocation levels, managers can identify employees who are consistently over capacity and rebalance assignments before burnout affects delivery quality or retention.
More accurate forecasting
Combining utilization, capacity, and project demand provides a more reliable view of future staffing needs, helping organizations plan resources with greater confidence as project portfolios change.
Utilization dashboards require connected operational data
Even the best-designed dashboard cannot compensate for disconnected data. Many organizations attempt to measure utilization using information pulled from separate spreadsheets, project management tools, time tracking systems, HR platforms, and financial applications.
Each system tells only part of the story.
For example:
- the project management tool shows planned assignments
- the time tracking system shows actual hours worked
- HR manages vacation and employee availability
- finance tracks billable rates and project profitability
- sales forecasts upcoming project demand
If these systems aren’t connected, utilization reporting quickly becomes inconsistent.
A resource manager may believe a consultant has available capacity because the resource plan hasn’t been updated. Meanwhile, another project manager has already assigned that consultant to a new engagement, approved vacation hasn’t been reflected, or submitted time entries reveal significantly more effort than originally estimated.
This is why growing service organizations often struggle with spreadsheet-based reporting. As project volume increases, keeping multiple data sources synchronized becomes nearly impossible, resulting in outdated reports and reactive staffing decisions.
The most effective utilization dashboards bring together:
- project schedules
- resource allocations
- approved time off
- time tracking
- workload planning
- capacity forecasts
- project financials
When these data sources are connected, utilization metrics become more than historical reports. They become operational decision tools.
For example, within Birdview PSA, resource managers can combine planned allocations, approved leave, time tracking, project schedules, and capacity planning into a single reporting environment. Rather than switching between separate spreadsheets and reporting tools, managers can identify workload imbalances, forecast staffing shortages, and evaluate utilization trends using connected operational data. This isn’t simply about creating better reports; it’s about ensuring the information used for staffing decisions reflects the current state of project delivery.
Conclusion
Resource utilization is one of the most important indicators of operational performance for professional services organizations, but it cannot be managed effectively through isolated metrics or static spreadsheets.
A modern resource utilization dashboard provides a complete picture of workforce performance by connecting utilization, workload, capacity, allocations, forecasting, and project data. Instead of relying on historical reports, operations leaders gain the visibility needed to balance workloads, improve staffing decisions, reduce bench time, anticipate future demand, and protect project profitability.
The most successful organizations also recognize that utilization should never be optimized in isolation. Sustainable utilization balances revenue generation with employee wellbeing, future capacity, and long-term delivery success.
If your organization still relies on spreadsheets or disconnected reporting, evaluating how a centralized PSA platform supports utilization reporting can be a valuable next step. Bringing resource planning, capacity management, time tracking, and project reporting together gives operations teams the visibility they need to make faster, more confident staffing decisions.
FAQ
What is a resource utilization dashboard?
A resource utilization dashboard is a reporting tool that combines resource allocation, workload, capacity, availability, and utilization data into a single view. It helps operations leaders monitor workforce performance, identify staffing risks, balance workloads, and make better resource planning decisions.
Which utilization metrics matter most?
The most valuable resource utilization metrics typically include billable utilization, capacity utilization, resource availability, allocation percentage, bench utilization, workload balance, forecast utilization, and utilization by role or department. Together, these KPIs provide a complete view of workforce performance rather than relying on a single utilization percentage.
How do dashboards improve resource planning?
Resource utilization dashboards improve planning by providing real-time visibility into current workloads, future capacity, and staffing demand. This allows organizations to identify resource shortages early, rebalance assignments, improve forecasting, and make proactive hiring decisions before project delivery is affected.
What is the difference between billable and capacity utilization?
Billable utilization measures the percentage of available working time spent on revenue-generating client work. Capacity utilization measures how much of an employee’s total available capacity has been allocated, regardless of whether the work is billable. Both metrics are important because they answer different operational questions.
How often should utilization be reviewed?
Most organizations benefit from monitoring utilization continuously through real-time dashboards, with operational reviews conducted weekly and strategic utilization trends reviewed monthly or quarterly. Forecast utilization should also be reviewed regularly to identify future staffing risks before they impact project delivery.