Leonid Kostin
 - A PMO dashboard provides a centralized view of project, resource, financial, and portfolio data, helping PMOs monitor performance and make informed decisions.
- Portfolio visibility improves when project information is standardized and connected across planning, resource management, budgeting, and reporting.
- The most valuable PMO dashboards include portfolio summary, project scorecard, capacity planning, budget performance, resource and capacity, and portfolio financial performance dashboards.
- Tracking KPIs such as portfolio health, budget variance, capacity availability, forecast accuracy, and strategic initiative progress helps PMOs identify risks before they affect delivery.
- Manual reporting and disconnected systems make it difficult to prioritize projects, provide accurate executive updates, and maintain consistent portfolio governance.
- Real-time dashboards enable PMOs to spend less time preparing reports and more time improving portfolio performance, supporting executive decisions, and aligning projects with strategic goals.
Managing a single project is challenging enough. Managing dozens or even hundreds of projects across multiple teams, business units, and strategic initiatives requires an entirely different level of visibility.
For PMO Directors and Portfolio Managers, success isn’t measured by the status of one project. It’s measured by how effectively the entire portfolio supports organizational goals. That means understanding which projects are on track, where resources are constrained, how budgets are performing, and which risks require immediate attention.
Unfortunately, obtaining that level of insight is difficult when project data is spread across spreadsheets, disconnected project management tools, financial systems, and manual status reports. By the time executive reports are compiled, the information is often already outdated.
A PMO dashboard solves this challenge by bringing project, resource, financial, and portfolio data together in one place. Instead of spending hours collecting updates from project managers, PMOs can monitor portfolio performance in real time, identify issues earlier, and provide executives with consistent, data-driven reporting.
In this guide, you’ll learn what makes an effective PMO dashboard, explore eight essential dashboard examples, discover the KPIs every PMO should monitor, and see how integrated reporting improves portfolio governance and executive decision-making.
Why PMOs need portfolio visibility
PMOs oversee multiple projects, programs, and strategic initiatives simultaneously. Their role extends beyond individual project delivery to ensuring the entire portfolio aligns with business objectives, resources are used effectively, and risks are addressed before they affect outcomes.
Without centralized visibility, project information is often spread across spreadsheets and disconnected systems, making it difficult to monitor portfolio performance, prioritize work, and provide executives with timely updates.
A portfolio dashboard brings project, resource, financial, and risk data into a single view, helping PMOs identify trends, improve governance, and make faster, data-driven decisions.
Common portfolio visibility challenges
Many PMOs face similar reporting challenges, including:
- Inconsistent project reporting
- Fragmented portfolio data
- Manual executive reporting
- Delayed status updates
- Competing project priorities
These issues make it difficult to identify risks early, compare project performance consistently, and prioritize initiatives with confidence.
What makes an effective PMO dashboard?
Not every dashboard supports portfolio governance. While project dashboards help teams monitor individual initiatives, PMO dashboards provide a portfolio-level view that supports planning, prioritization, and executive decision-making.
The most effective PMO dashboards share five key characteristics.
Portfolio-level visibility
PMOs need a complete view of projects, resources, budgets, and risks across the organization. A good PMO dashboard should help answer questions like:
- Which projects need attention today?
- Where are capacity constraints?
- Which strategic initiatives are slipping?
- What should executives know this week?
Consistent project reporting
Standardized health indicators and KPIs ensure every project is measured consistently, making portfolio reporting more reliable and comparisons more meaningful.
Executive-ready summaries
Executives need a high-level overview of portfolio performance, strategic progress, major risks, and key financial metrics without reviewing detailed project reports.
Early risk identification
Effective dashboards highlight leading indicators such as schedule delays, budget variance, resource constraints, and dependency risks so PMOs can act before issues impact the portfolio.
Real-time reporting
Automatically updated dashboards provide current portfolio information, reducing manual reporting and enabling faster, more confident decision-making.
The 6 PMO dashboards every portfolio manager should have
No single dashboard can answer every portfolio management question. Instead, high-performing PMOs rely on a collection of dashboards, each designed to support a specific aspect of governance, planning, or executive reporting.
Together, these dashboards provide a complete picture of portfolio performance, from strategic alignment and financial health to delivery risks and future capacity.
Portfolio summary dashboard
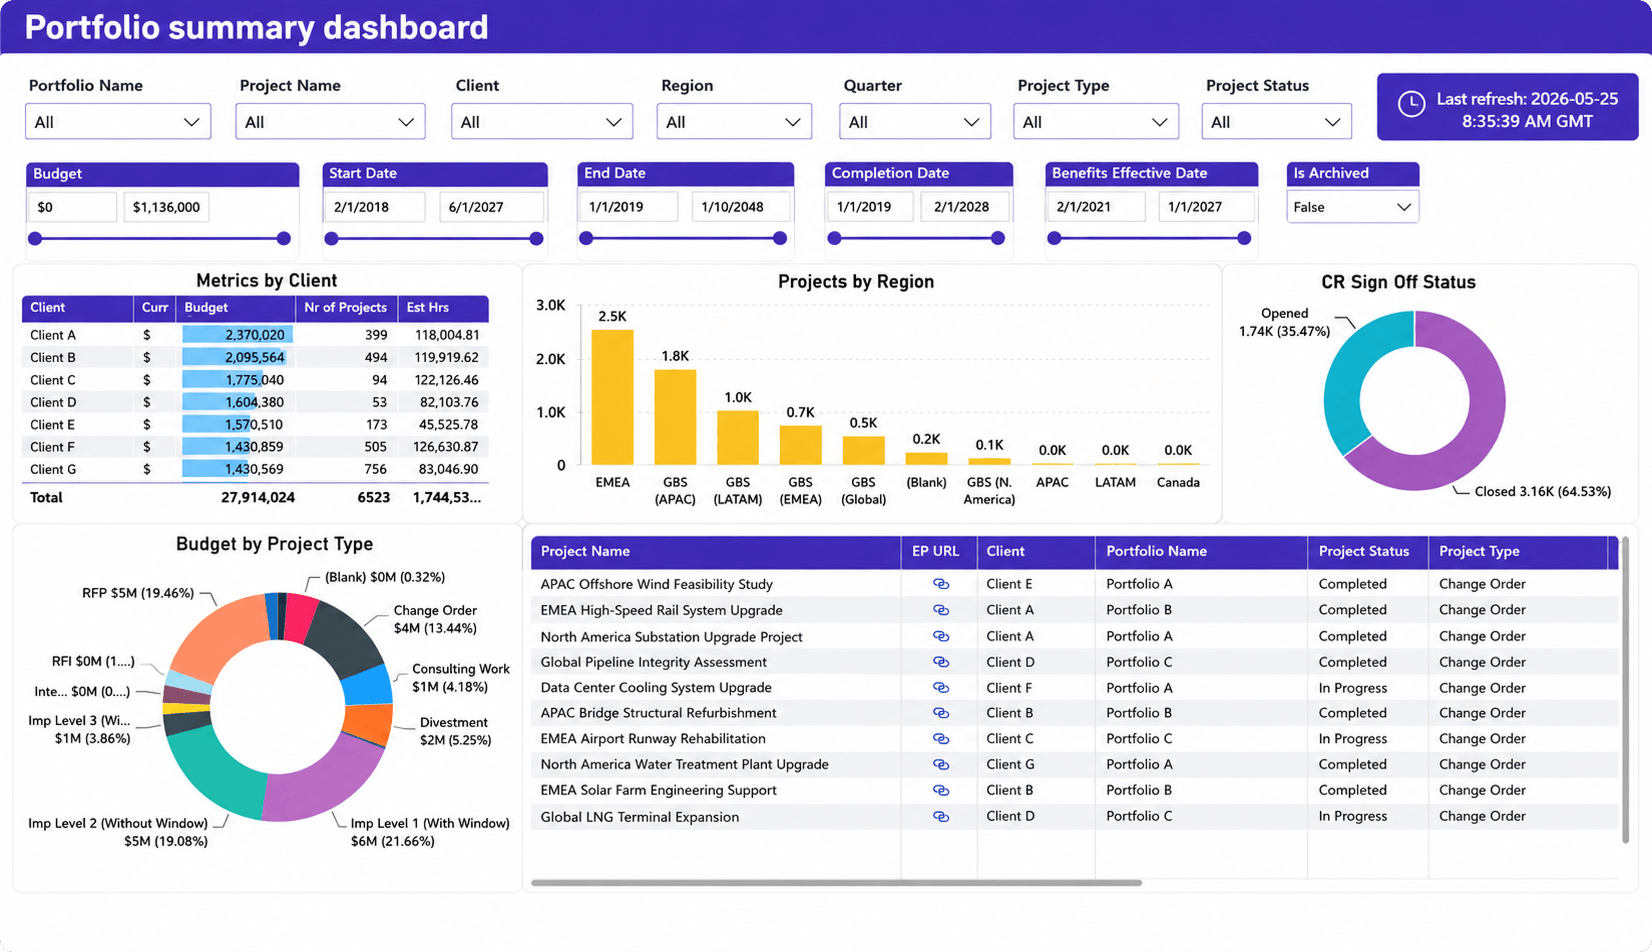
The Portfolio Summary Dashboard gives PMOs a centralized view of projects across the organization. It combines project, portfolio, budget, and timeline information into a single dashboard, making it easier to monitor overall portfolio performance and support executive reporting.
What it shows
- Active projects across portfolios
- Project and portfolio status
- Budgets by client or project type
- Projects by region or business unit
- Project timelines and completion dates
- Change request status
Why it matters
This dashboard provides a high-level view of the entire portfolio, helping PMOs quickly identify trends, prioritize attention, and monitor project performance without reviewing individual project reports. Interactive filters also make it easy to analyze the portfolio by client, region, project type, or reporting period.
Project scorecard dashboard
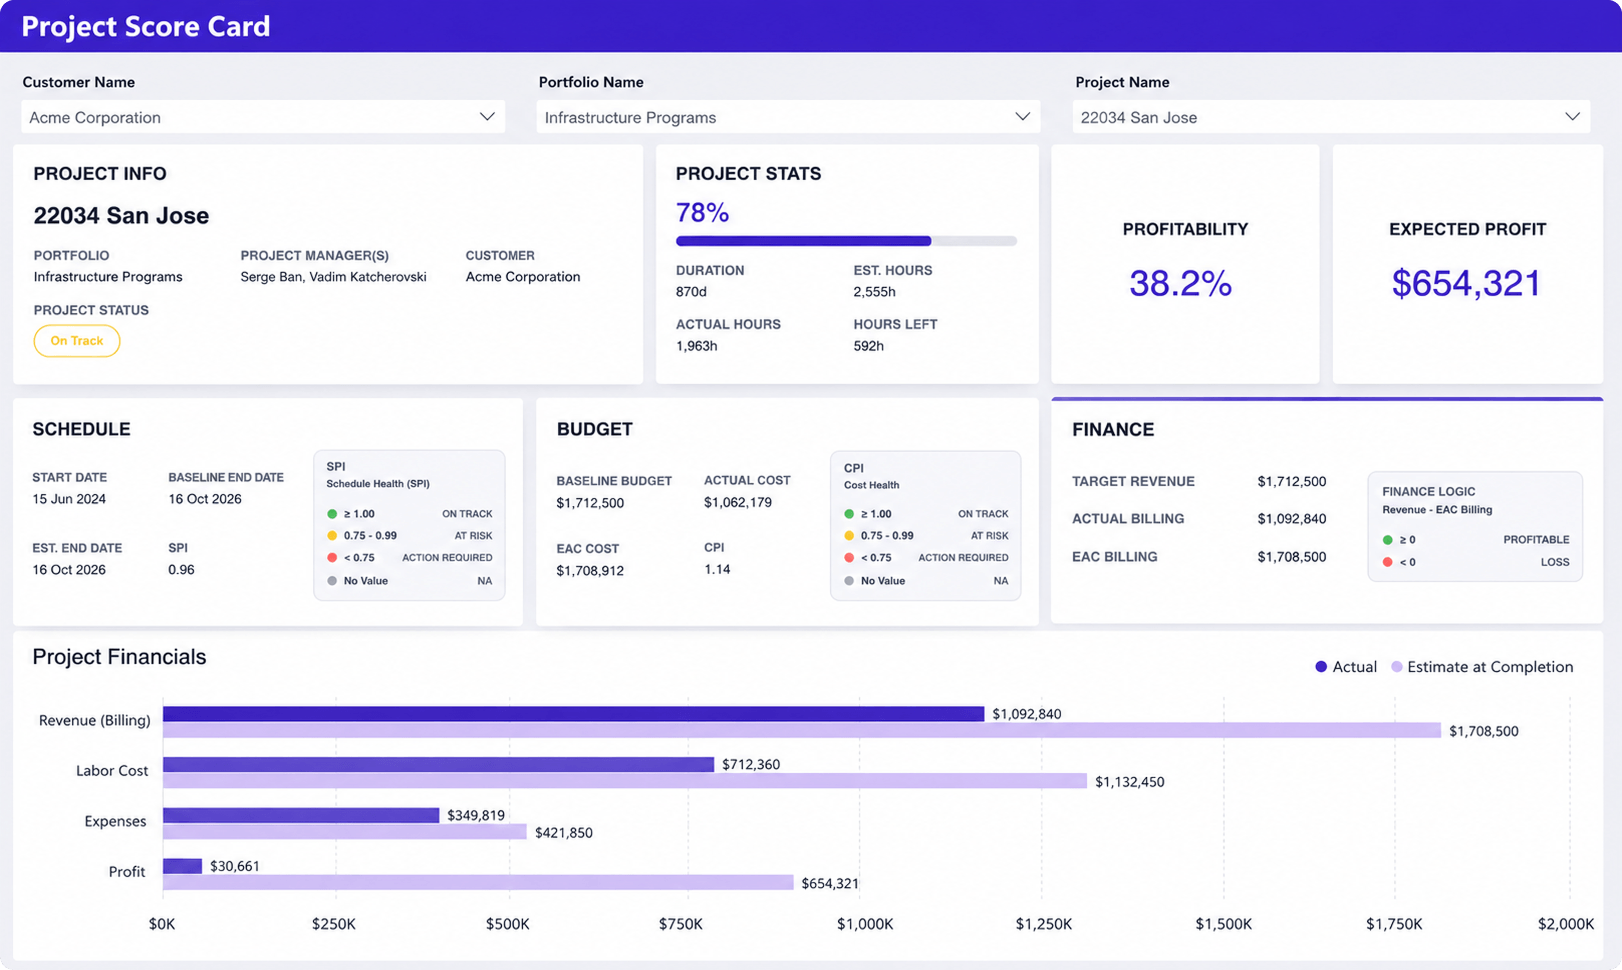
The Project Scorecard Dashboard provides a detailed view of an individual project’s performance, combining schedule, budget, financial, and delivery metrics into a single scorecard. It helps PMOs quickly evaluate project health and identify projects that need attention.
What it shows
- Project status and completion progress
- Schedule and budget performance
- Revenue, costs, and profitability
- Planned vs. actual financials
- Key delivery and financial KPIs
Why it matters
When a project requires closer review, this dashboard gives PMOs the context behind its performance. By combining operational and financial metrics in one place, it helps identify delivery issues early, evaluate project profitability, and support informed decisions before problems affect the wider portfolio.
Capacity planning dashboard
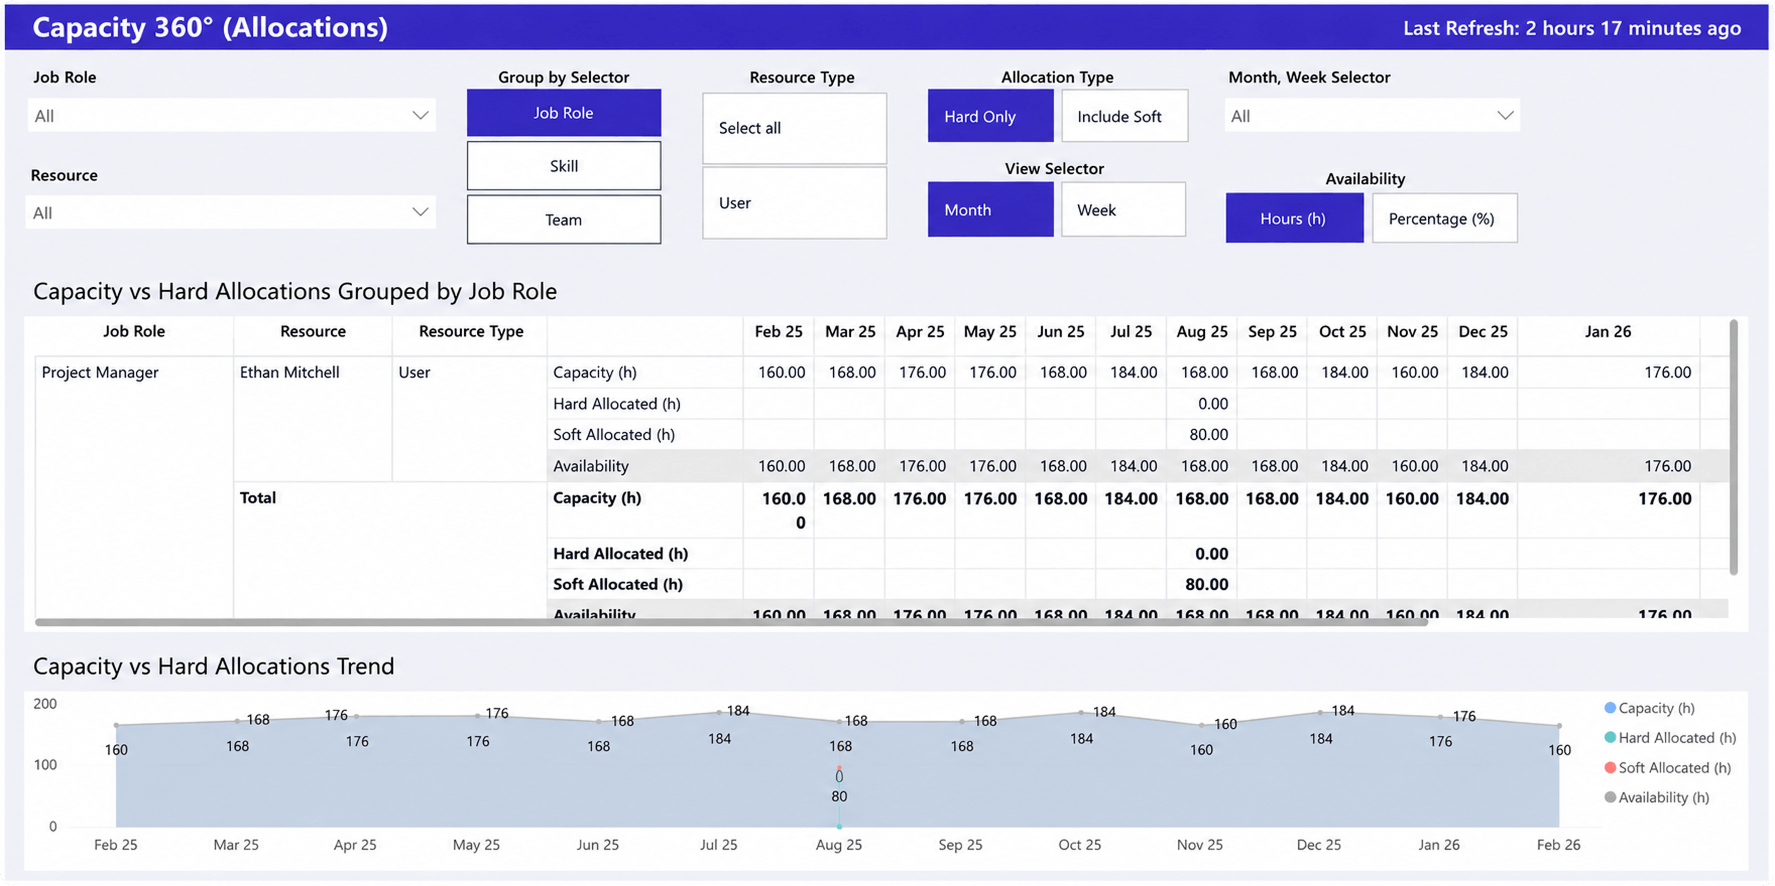
The Capacity Planning Dashboard gives PMOs visibility into current and future resource capacity across the portfolio. It compares available capacity with planned allocations, helping portfolio managers identify shortages, avoid overallocation, and make better staffing decisions before projects are affected.
What it shows
- Capacity vs. allocated hours
- Hard and soft allocations
- Resource availability
- Capacity trends over time
- Capacity by job role or resource
Why it matters
This dashboard helps PMOs determine whether the organization has the capacity to deliver planned work. By highlighting future resource constraints, it supports portfolio planning, prioritization, and hiring decisions before capacity issues impact project delivery.
Budget performance dashboard
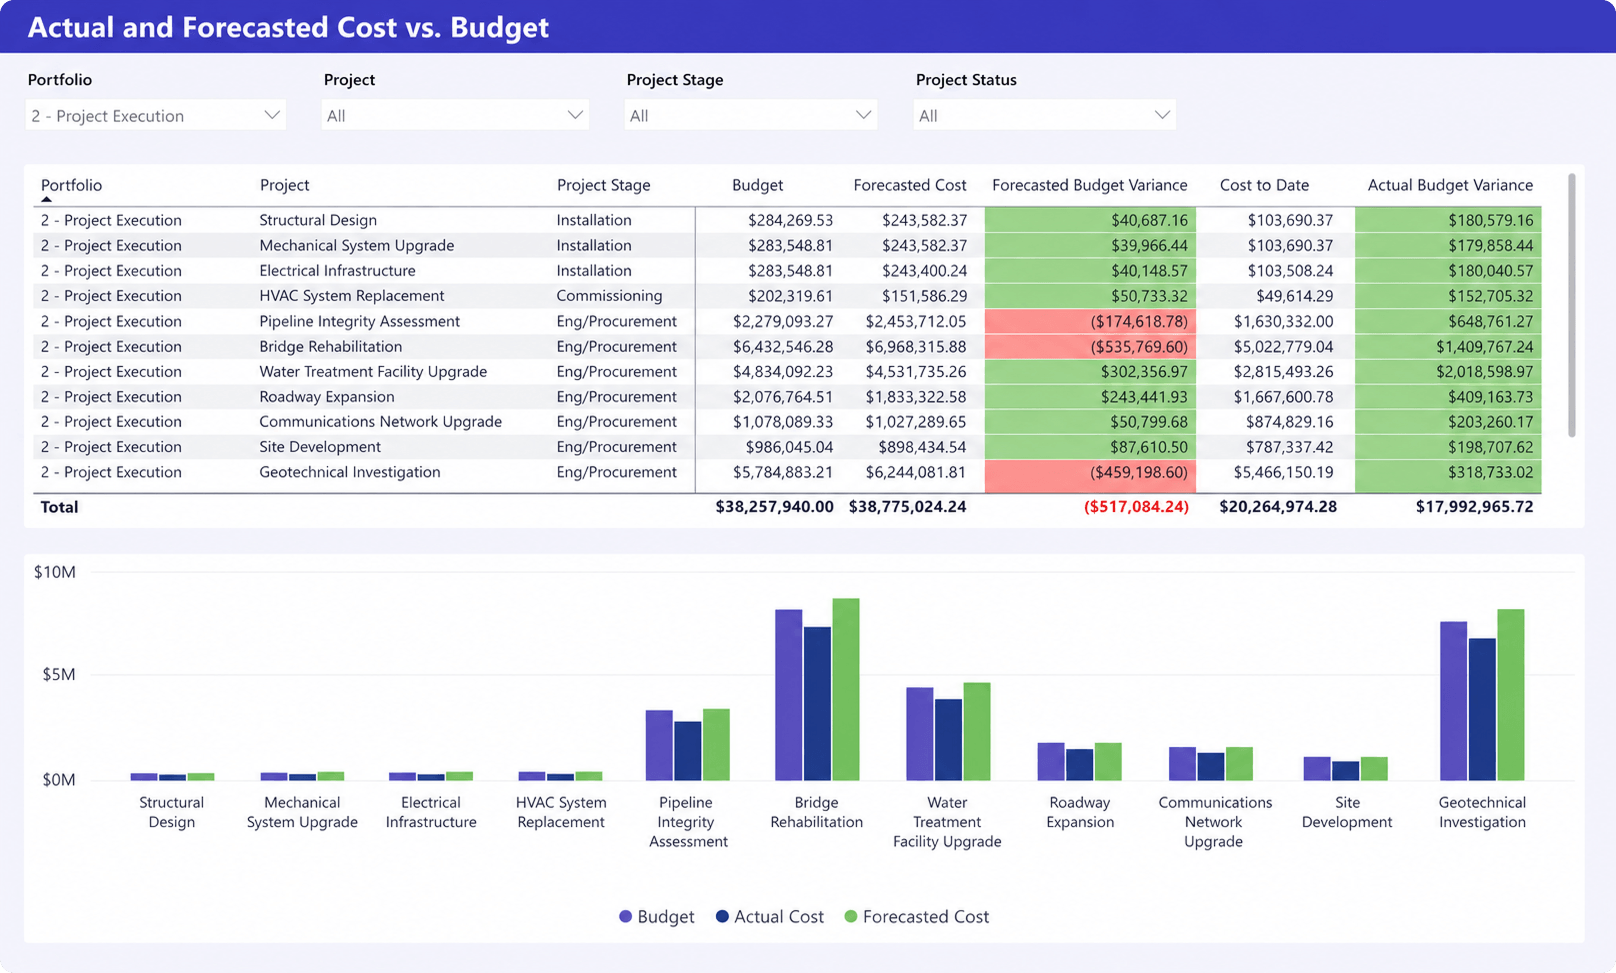
The Budget Performance Dashboard helps PMOs monitor actual and forecasted project costs against approved budgets across the portfolio. It provides early visibility into budget variances, allowing portfolio managers to identify projects at risk of exceeding planned spending.
What it shows
- Budget vs. actual costs
- Forecasted project costs
- Budget variance
- Cost to date
- Project budget performance
Why it matters
By comparing actual and forecasted costs with project budgets, this dashboard helps PMOs identify potential overruns before they impact the portfolio. It supports better financial oversight, more accurate forecasting, and informed decisions about project funding and resource allocation.
Portfolio resource and capacity dashboard
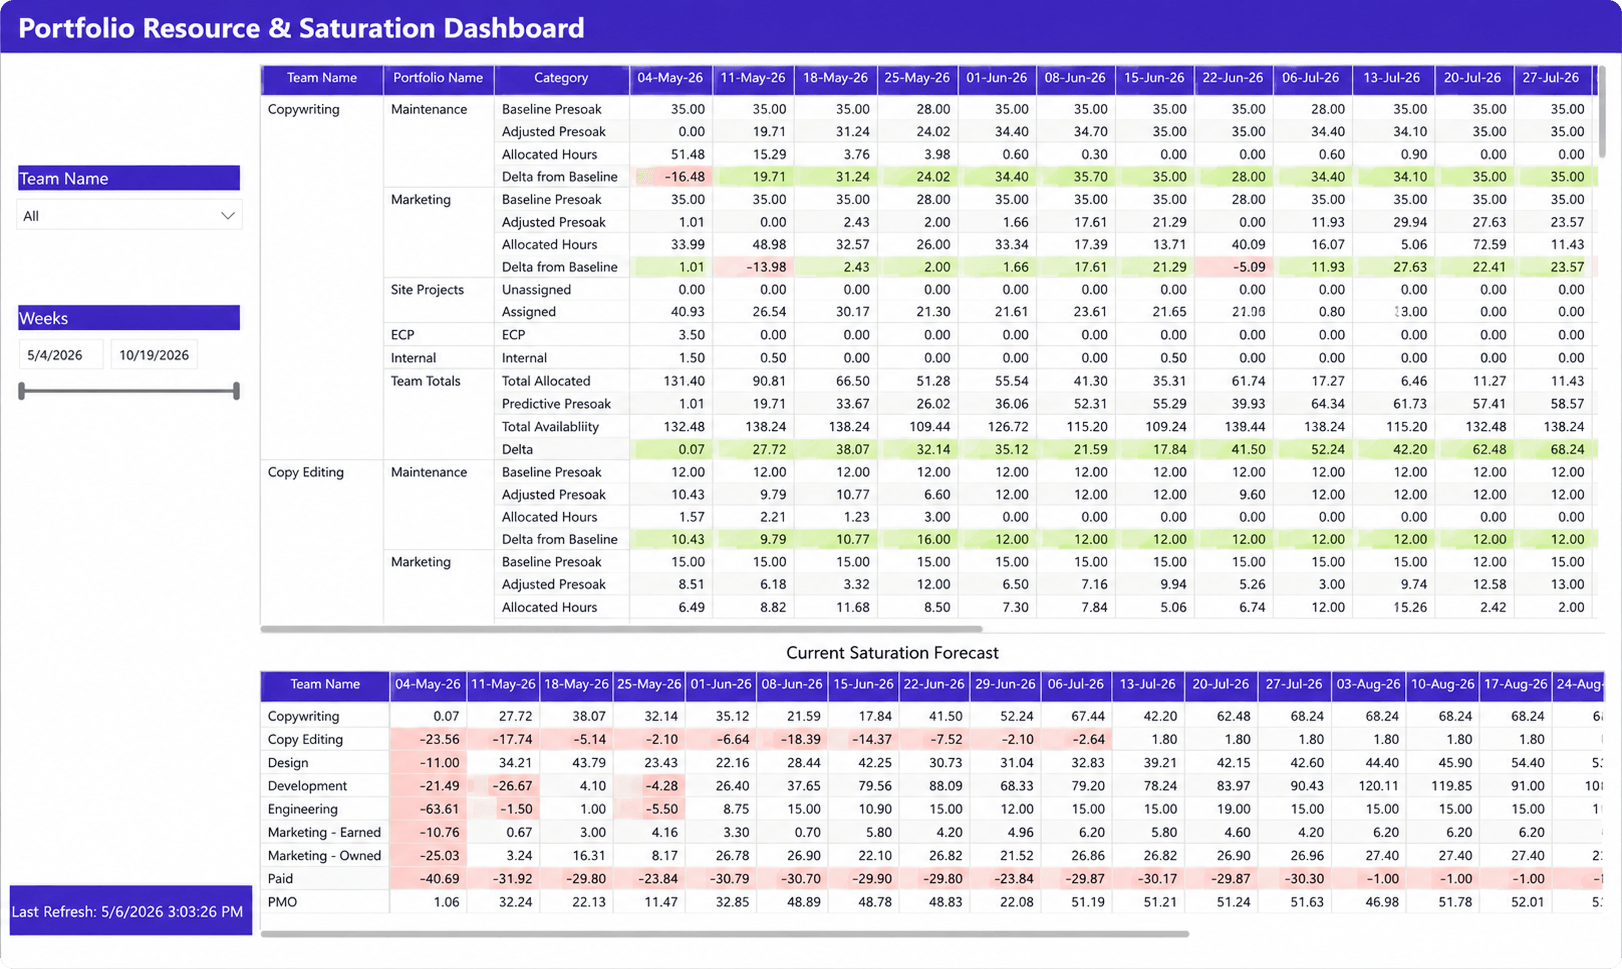
The Portfolio Resource and Capacity Dashboard helps PMOs monitor team capacity and forecast resource demand across the project portfolio. It highlights where teams are overallocated or underutilized, allowing portfolio managers to balance workloads before delivery is affected.
What it shows
- Team capacity and allocations
- Resource availability
- Capacity variances
- Forecasted team saturation
- Capacity trends over time
Why it matters
This dashboard helps PMOs identify future resource constraints across portfolios and teams. By forecasting capacity shortages and excess availability, it supports better portfolio planning, prioritization, and staffing decisions before resource issues impact project delivery.
Portfolio financial performance dashboard
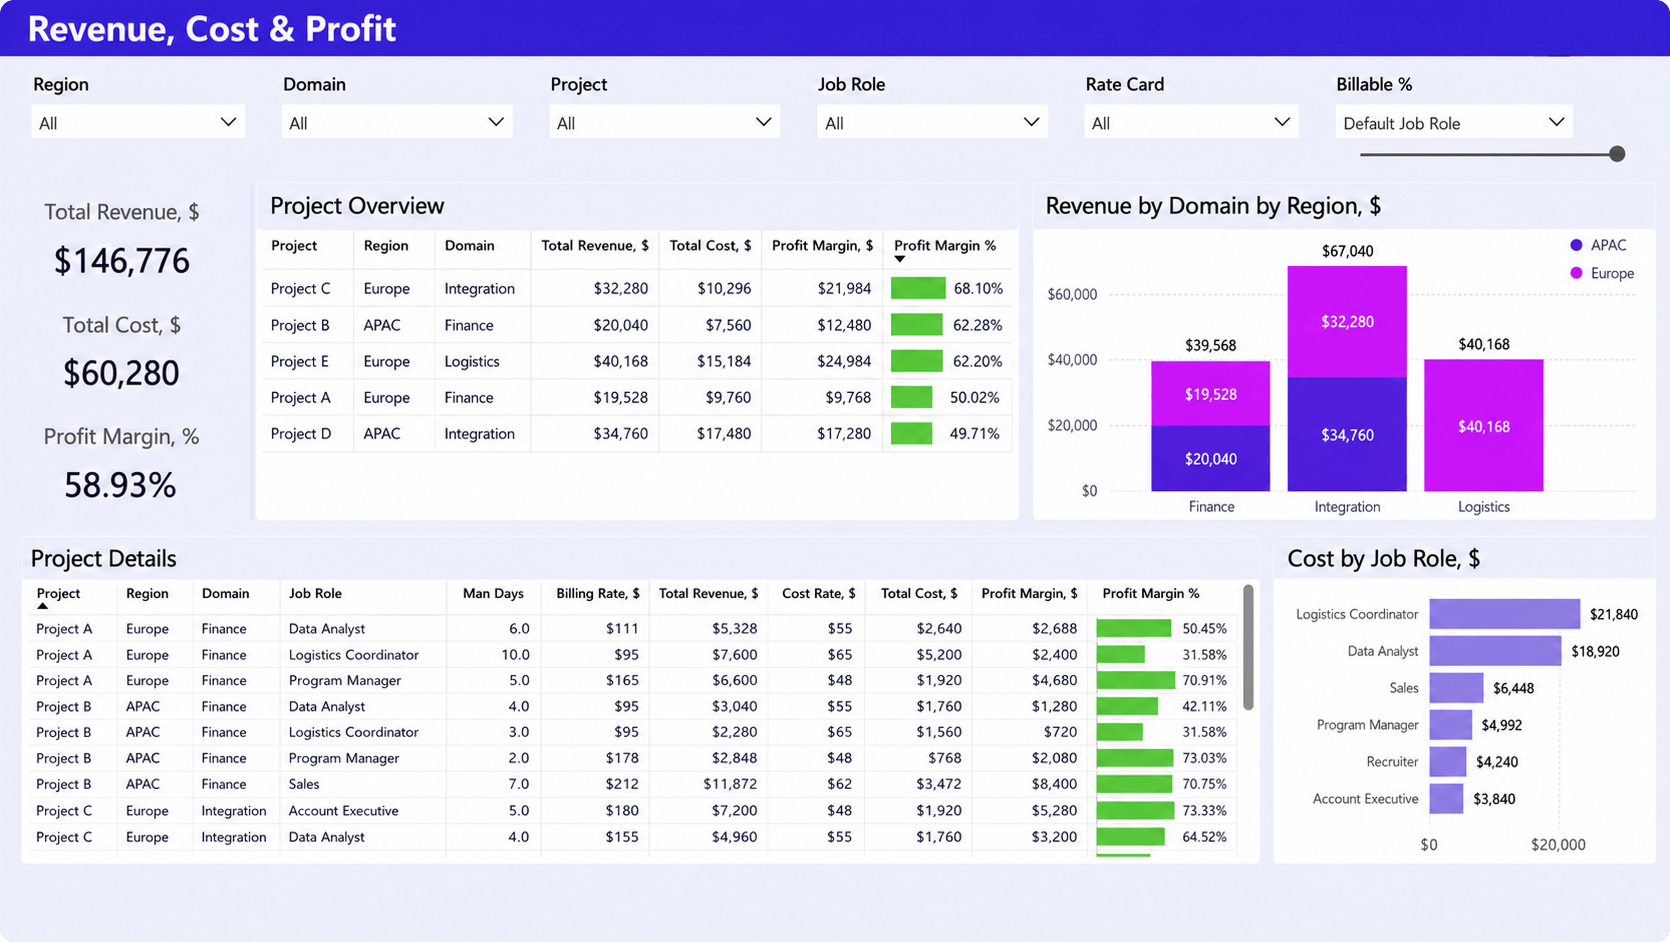
The Portfolio Financial Performance Dashboard gives PMOs visibility into the financial health of projects across the portfolio. It combines revenue, costs, and profit margins into a single view, helping leaders evaluate project performance and identify opportunities to improve portfolio profitability.
What it shows
- Revenue, costs, and profit margins
- Financial performance by project
- Revenue by portfolio or business area
- Cost by job role
- Project financial details
Why it matters
This dashboard connects project delivery with financial outcomes, helping PMOs identify projects with declining margins, compare financial performance across the portfolio, and support investment and prioritization decisions using both operational and financial data.
The most important PMO KPIs
The value of a PMO dashboard depends on the metrics it tracks. While organizations may monitor dozens of indicators, a small set of KPIs provides the clearest view of portfolio performance, delivery risks, and strategic progress. These metrics help PMOs identify issues early, prioritize initiatives, and provide executives with reliable, data-driven reporting.
Portfolio health
Portfolio health provides a high-level view of how projects are performing across the organization by tracking the number of projects that are on track, at risk, or critical. It helps PMOs quickly identify where leadership attention is needed.
On-time project delivery
This KPI measures the percentage of projects delivered according to schedule. A declining delivery rate often signals planning, resource, or governance issues that should be addressed before they affect the wider portfolio.
Budget variance
Budget variance compares planned budgets with actual project costs, helping PMOs identify projects that are exceeding planned spending and take corrective action before overruns impact portfolio performance.
Resource utilization
Resource utilization shows how effectively teams are being used across the portfolio. Combined with capacity data, it helps PMOs balance workloads, identify underutilized resources, and avoid overallocation.
Capacity availability
Capacity availability measures how much resource capacity remains for upcoming work. It helps PMOs determine whether new initiatives can be delivered with existing teams or whether priorities, timelines, or staffing plans need to change.
Portfolio risk exposure
This KPI tracks the number and severity of risks across the portfolio, giving PMOs visibility into where delivery is most vulnerable. Monitoring risk exposure helps prioritize mitigation efforts and reduce the likelihood of project disruptions.
Forecast accuracy
Forecast accuracy compares projected timelines, budgets, and resource needs with actual outcomes. Improving this metric enables more reliable planning and increases confidence in portfolio forecasts.
Strategic initiative progress
Strategic initiative progress measures how projects contribute to broader business objectives by tracking milestones, budgets, and overall completion. It helps PMOs demonstrate that the portfolio is delivering measurable business value rather than simply completing projects.
Why PMO reporting often fails
Technology isn’t usually the biggest reporting problem.
The real issue is that portfolio information is often fragmented across multiple systems, spreadsheets, and reporting methods. As organizations grow, manual reporting processes that once worked for a handful of projects become increasingly difficult to maintain.
The result is a PMO that spends more time assembling reports than generating insights.
Project data is inconsistent across teams
Different project managers often use different reporting standards.
One team may define “on track” based on schedule, while another considers budget performance. Some update project information daily, others only before steering committee meetings.
This inconsistency makes portfolio reporting unreliable because projects are no longer measured against the same criteria.
Standardized reporting frameworks ensure every project contributes comparable data to portfolio dashboards.
Reporting is built manually in spreadsheets
Many PMOs still export data from multiple systems before combining everything into Excel or presentation slides.
This approach creates several challenges:
- Duplicate work
- Manual data entry
- Version control issues
- Reporting delays
- Increased risk of human error
As organizations grow, spreadsheet-based reporting becomes increasingly difficult to scale.
This challenge is particularly common among organizations that have outgrown spreadsheets but haven’t yet adopted integrated portfolio reporting.
Financial and delivery information are disconnected
Project delivery data often lives in one platform while financial information exists somewhere else.
As a result, PMOs can answer questions like: “Are projects on schedule?” or “Are we within budget?” but struggle to answer: “Which delayed projects pose the greatest financial risk?”
Without connected data, delivery and financial decisions remain disconnected.
Executives receive reports that are already outdated
Traditional reporting cycles often require several days to prepare.
By the time reports reach executive leadership:
- Project statuses have changed.
- New risks have emerged.
- Resources have shifted.
- Budgets have been updated.
This delay reduces confidence in reporting and slows decision-making.
Real-time dashboards eliminate much of this lag by automatically updating as project information changes.
PMOs spend more time creating reports than analyzing them
Perhaps the greatest hidden cost of manual reporting is the opportunity cost.
Highly experienced PMO leaders should be focused on governance, portfolio optimization, and strategic planning, not copying project updates into PowerPoint presentations every Friday.
Modern dashboards automate data collection so PMOs can spend their time interpreting insights, facilitating executive discussions, and improving portfolio outcomes.
In the final part, we’ll cover how PMO dashboards strengthen portfolio governance, why connected project data is essential for reliable reporting, and include a complete FAQ, meta title, meta description, URL slug, and FAQ schema.
How PMO dashboards improve portfolio governance
PMO dashboards help organizations make faster, more informed portfolio decisions. By providing consistent, real-time reporting, they strengthen governance across every stage of project delivery.
Standardize project reporting
Using common KPIs and health indicators ensures projects are measured consistently, making portfolio reviews more objective and reducing reporting inconsistencies across teams.
Improve portfolio prioritization
Real-time visibility into project health, resource capacity, budgets, and strategic alignment helps PMOs prioritize initiatives based on data rather than assumptions.
Identify delivery risks earlier
Dashboards surface early warning signs such as schedule delays, budget overruns, resource constraints, and unresolved issues, allowing PMOs to take corrective action before portfolio performance is affected.
Support executive decision-making
Executive dashboards summarize portfolio health, strategic progress, financial performance, and key risks, giving leadership the information needed to make timely decisions.
Increase reporting confidence
By connecting project, resource, and financial data in one place, dashboards reduce manual reporting and provide executives with a trusted, up-to-date view of portfolio performance.
Portfolio visibility starts with connected project data
Many organizations believe they have a reporting problem when they actually have a data problem.
No dashboard can provide meaningful insights if the underlying information is incomplete, inconsistent, or scattered across disconnected systems.
This is why the most effective PMO dashboards are built on connected operational data rather than manual reporting processes.
Ideally, project information should flow automatically from the systems teams use every day, including:
- Project plans
- Resource schedules
- Time tracking
- Financial management
- Portfolio planning
- Risk registers
- Forecasting tools
When these systems operate independently, PMOs spend valuable time exporting data, reconciling inconsistencies, and validating reports before executives can use them.
When they’re connected, dashboards update automatically as project information changes, giving PMOs continuous visibility into portfolio performance.
For example, platforms such as Birdview PSA combine project planning, resource management, financial tracking, and portfolio reporting within a single environment. Instead of manually consolidating information from multiple applications, PMOs can monitor portfolio health, capacity, budgets, and strategic initiatives through customizable dashboards built on shared project data.
Regardless of the reporting platform an organization chooses, the principle remains the same: the quality of a dashboard depends on the quality and connectivity of the data behind it.
As portfolios grow larger and more complex, connected data becomes the foundation for reliable governance, accurate forecasting, and informed executive decision-making.
Conclusion
A successful PMO isn’t measured by the number of reports it produces. It’s measured by the quality of the decisions those reports enable.
Modern PMO dashboards help portfolio leaders move beyond manual status reporting by providing real-time visibility into project performance, resource capacity, financial health, delivery risks, and strategic progress.
Together, the eight dashboards covered in this guide create a comprehensive reporting framework that enables PMOs to:
- Monitor portfolio performance in real time
- Standardize reporting across projects
- Detect delivery risks earlier
- Improve resource and investment decisions
- Strengthen portfolio governance
- Provide executives with reliable, data-driven insights
As organizations grow, spreadsheets and disconnected reporting processes become increasingly difficult to maintain. Investing in integrated portfolio reporting allows PMOs to spend less time preparing reports and more time improving delivery outcomes.
If your organization is looking to improve portfolio visibility, explore how connected reporting platforms such as Birdview PSA can centralize project, resource, financial, and portfolio data into customizable dashboards that support both day-to-day governance and executive decision-making.
FAQ: PMO dashboards
What is a PMO dashboard?
A PMO dashboard is a reporting tool that consolidates project, portfolio, resource, financial, and governance data into a single view. It helps PMO leaders monitor portfolio performance, identify risks, track strategic initiatives, and provide executives with real-time insights for better decision-making.
What should a portfolio dashboard include?
A portfolio dashboard should include project health, portfolio status, budget performance, resource capacity, delivery progress, risks, issues, strategic initiative tracking, and key PMO KPIs. Together, these metrics provide a complete view of portfolio performance.
Which KPIs should PMOs track?
The most valuable PMO KPIs typically include portfolio health, on-time project delivery, budget variance, resource utilization, capacity availability, portfolio risk exposure, forecast accuracy, and strategic initiative progress. These metrics help measure both project execution and portfolio performance.
How do dashboards improve portfolio governance?
Dashboards improve portfolio governance by standardizing reporting, providing real-time visibility into project performance, identifying risks earlier, supporting objective prioritization, and enabling executives to make faster, data-driven decisions using consistent portfolio information.
What is the difference between a PMO dashboard and an executive dashboard?
A PMO dashboard provides detailed operational visibility into projects, resources, risks, and portfolio performance for PMO leaders and portfolio managers. An executive dashboard presents a higher-level summary of strategic KPIs, portfolio health, financial performance, and major risks, allowing senior leadership to make informed business decisions without reviewing project-level details.