Leonid Kostin
 - A project profitability dashboard combines project, financial, resource, and billing data into a single view, giving finance and operations teams real-time visibility into project performance.
- The most effective profitability dashboards monitor margins, budgets, labor costs, revenue, and forecasts, helping organizations identify financial risks before they affect project outcomes.
- Essential dashboard types include project profitability overview, revenue and cost analysis, budget vs. actual, profit forecasting, and revenue recognition dashboards.
- Tracking KPIs such as gross margin, project margin, budget variance, labor cost, billable utilization, realization rate, and forecast margin provides a clear picture of project financial health.
- Many organizations struggle to measure profitability because project, resource, time tracking, billing, and accounting data remain disconnected across multiple systems.
- Integrated reporting helps finance leaders move beyond historical reporting by improving forecasting, reducing revenue leakage, and supporting faster, data-driven financial decisions.
- The most valuable profitability dashboards they help teams understand why profitability is changing and what actions to take to improve it.
Every professional services firm wants to deliver profitable projects. Yet many finance and operations leaders struggle to answer a seemingly simple question:
Which of our projects are actually making money right now?
The answer is often buried across accounting software, project management tools, time tracking systems, and spreadsheets. By the time the data is consolidated, it’s too late to influence project outcomes.
A project profitability dashboard brings project, financial, resource, and billing data into one view, allowing leaders to monitor margins, costs, budgets, revenue, and forecasts in real time. Instead of explaining past performance, they can identify risks early and make better financial decisions.
In this guide, you’ll learn what makes an effective project profitability dashboard, explore real dashboard examples, and discover the metrics that matter most.
Why project profitability is difficult to measure
Many organizations don’t know whether a project is profitable until it’s complete. By then, budget overruns, rising labor costs, write-offs, or poor utilization have already reduced margins.
A project profitability dashboard solves this by combining project, financial, resource, and billing data into a single reporting layer, giving finance and operations teams real-time visibility throughout project delivery.
Common challenges include:
- Disconnected project and financial systems
- Delayed reporting
- Hidden labor costs
- Margin erosion
- Manual spreadsheets
- Limited forecasting visibility
These issues often leave leaders reacting to financial results instead of improving them.
What makes a good project profitability dashboard?
An effective project profitability dashboard does more than report financial results. It combines project, resource, time tracking, billing, and financial data to give leaders a complete view of project performance.
The best dashboards should:
- connect project and financial data
- visualize trends over time instead of static reports
- highlight budget overruns, declining margins, and other exceptions
- support operational decisions, not just financial reporting
Rather than simply showing historical results, a profitability dashboard should help finance and operations teams identify risks early enough to protect project margins.
The most important project profitability dashboards
No single dashboard captures every aspect of project profitability. Finance and operations leaders typically rely on several complementary dashboards to monitor margins, costs, budgets, revenue, and forecasts throughout the project lifecycle.
Together, the following dashboards provide a comprehensive view of project profitability across the entire project lifecycle.
Project profitability overview dashboard
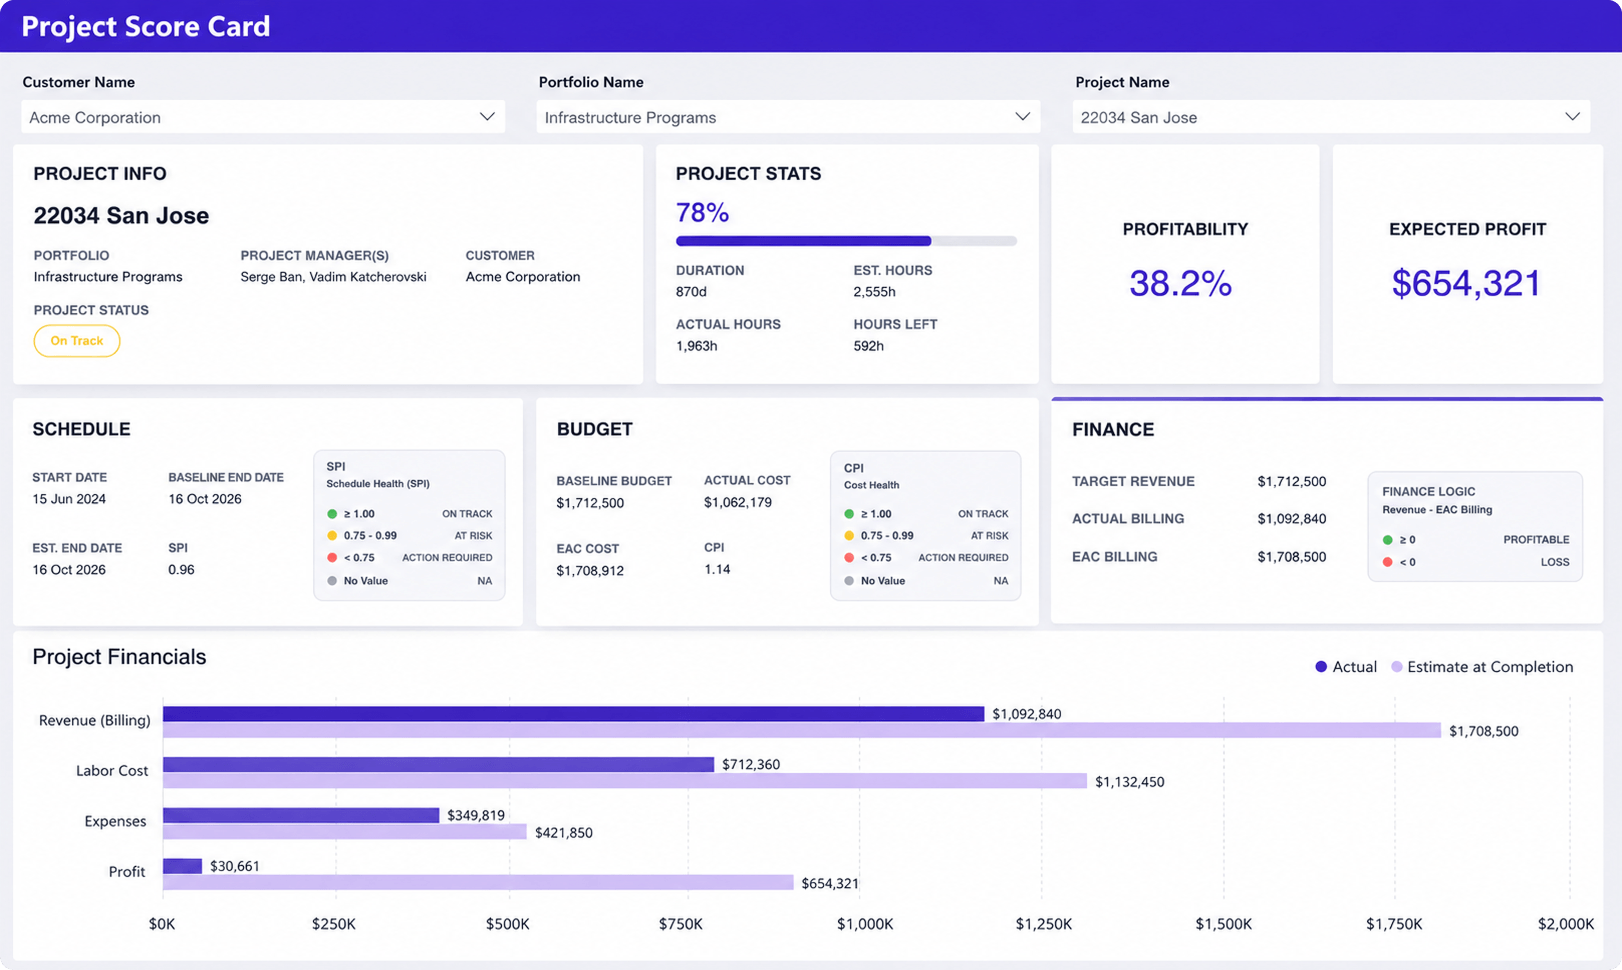
What it shows
This project scorecard combines project progress with key financial metrics, including profitability, expected profit, revenue, labor costs, expenses, budget performance, and actual versus forecast results. It provides a single view of both project health and financial performance.
Why it matters
This dashboard helps leaders determine whether a project is on track to meet its financial goals. By monitoring profitability, costs, budgets, and forecasts together, teams can identify risks early and take corrective action before project margins are affected.
Revenue, cost, and profit dashboard
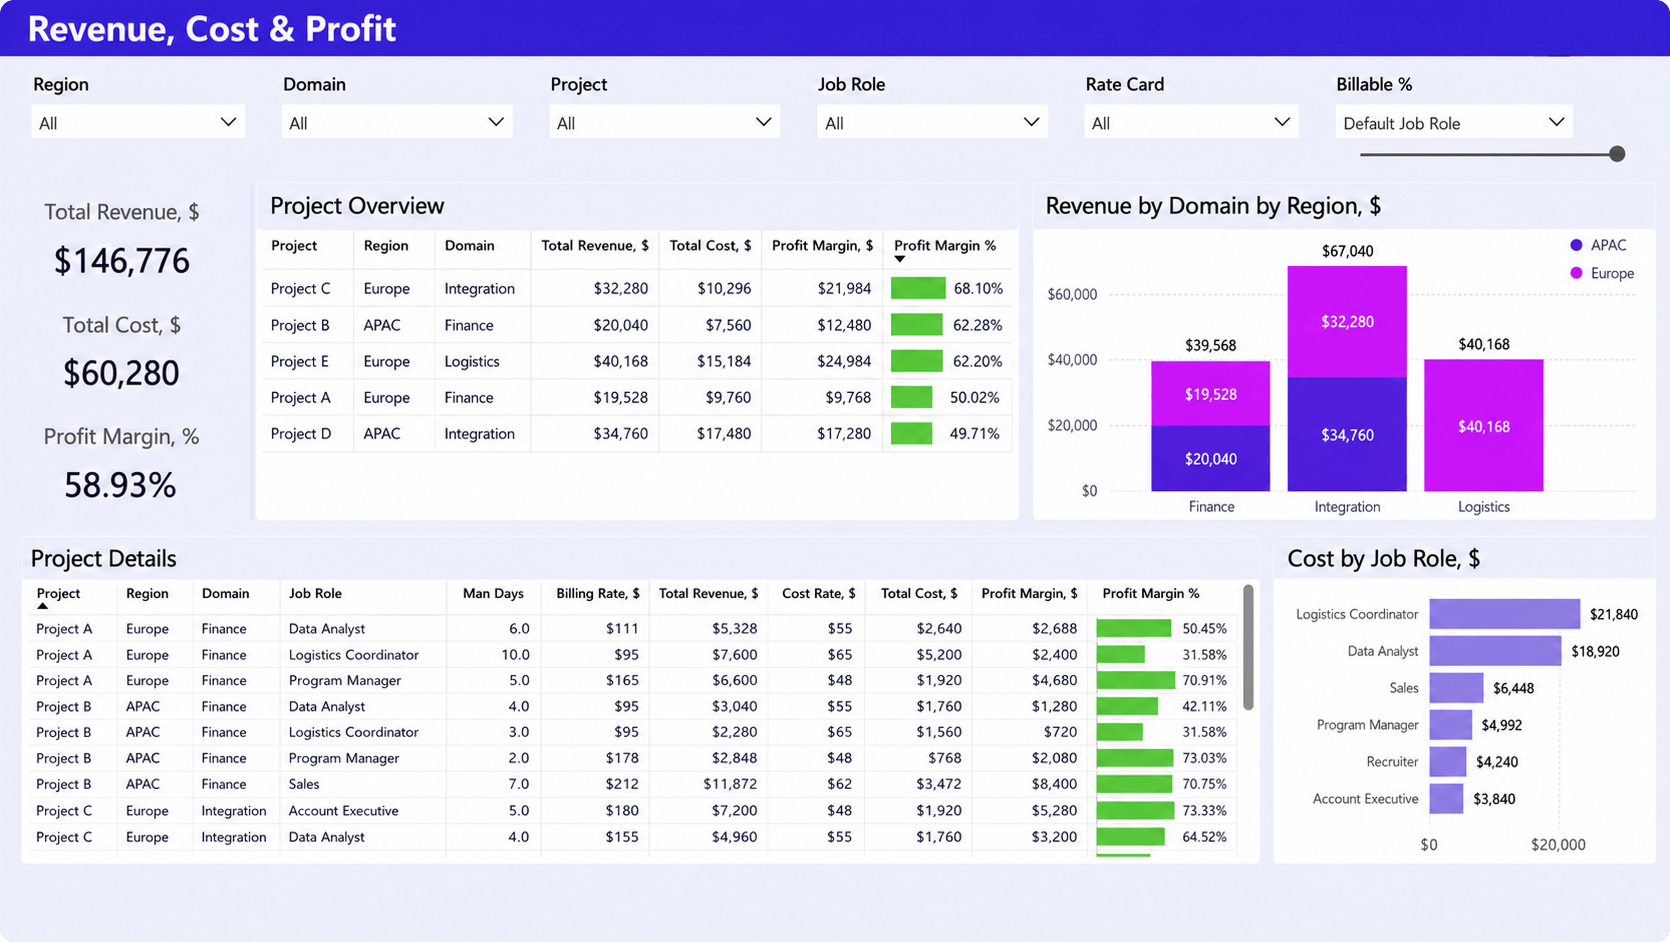
What it shows
This dashboard compares revenue, costs, and profit margins across projects, regions, domains, and job roles. It provides an overview of financial performance while allowing leaders to analyze profitability by project and identify the biggest cost drivers.
Why it matters
Understanding how revenue and costs contribute to project profitability helps finance teams identify the most profitable projects, services, and resource groups. These insights support better pricing, staffing, and investment decisions while helping improve overall project margins.
Budget vs. actual cost dashboard
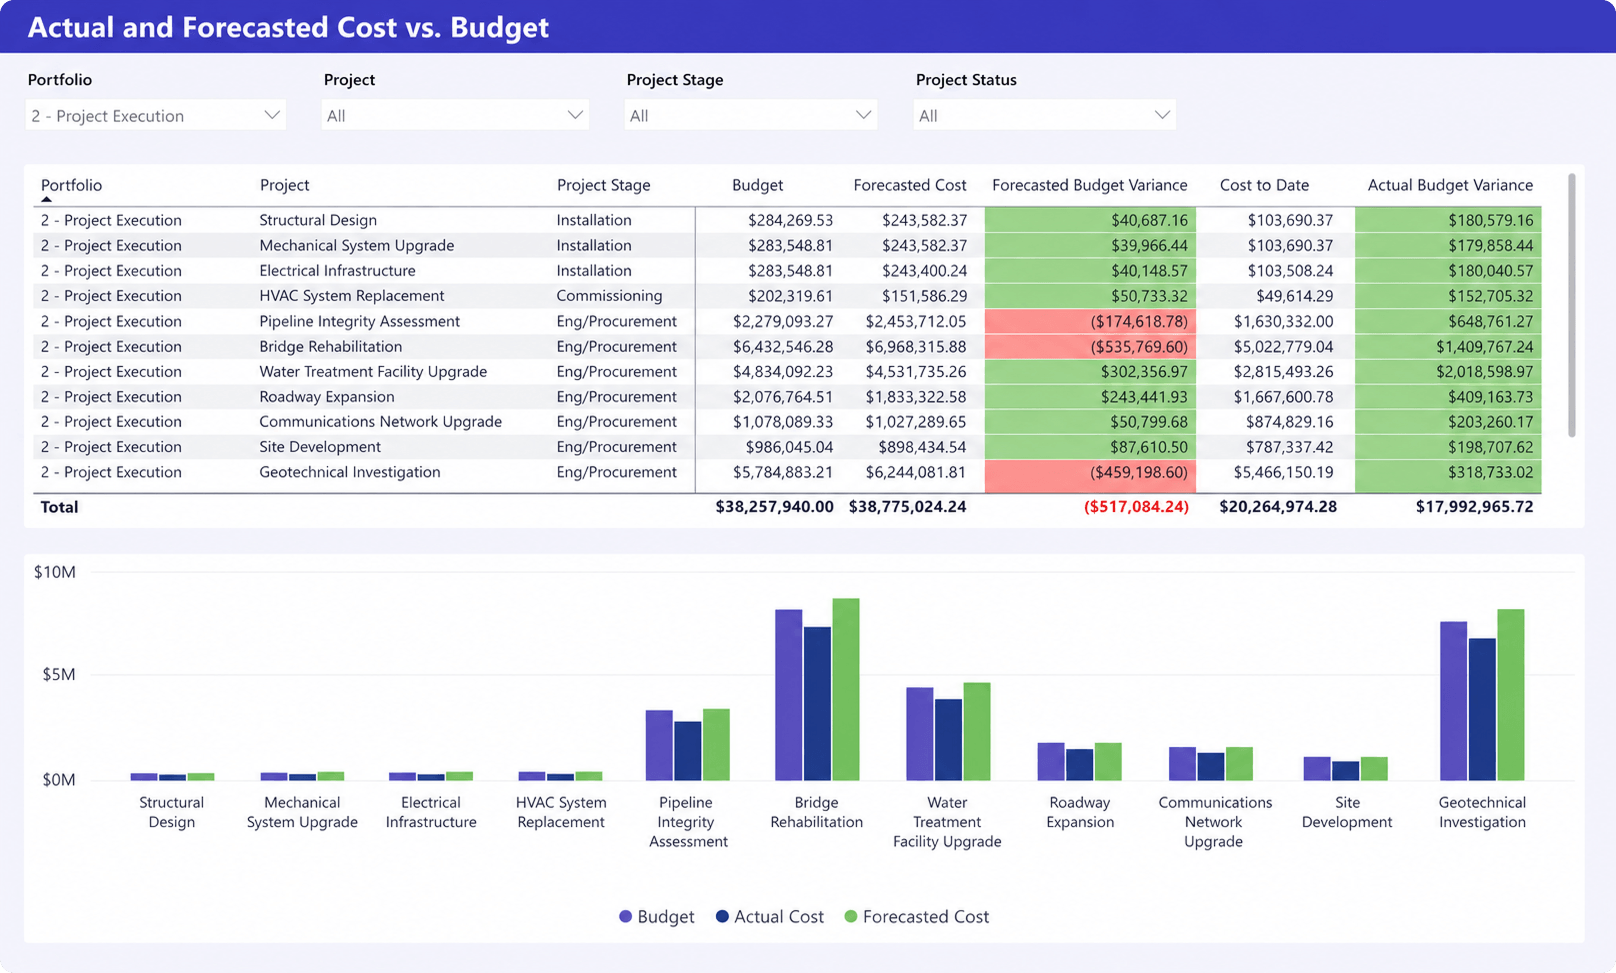
What it shows
This dashboard compares project budgets with actual and forecasted costs, highlighting budget variance, cost to date, and projected overruns or savings for each project. Color-coded variances make it easy to identify projects that require attention.
Why it matters
Comparing actual and forecasted costs against budgets helps finance teams identify potential overruns before they affect project margins. With early visibility into budget variance, leaders can take corrective action to keep projects financially on track.
Profit forecast dashboard
What it shows
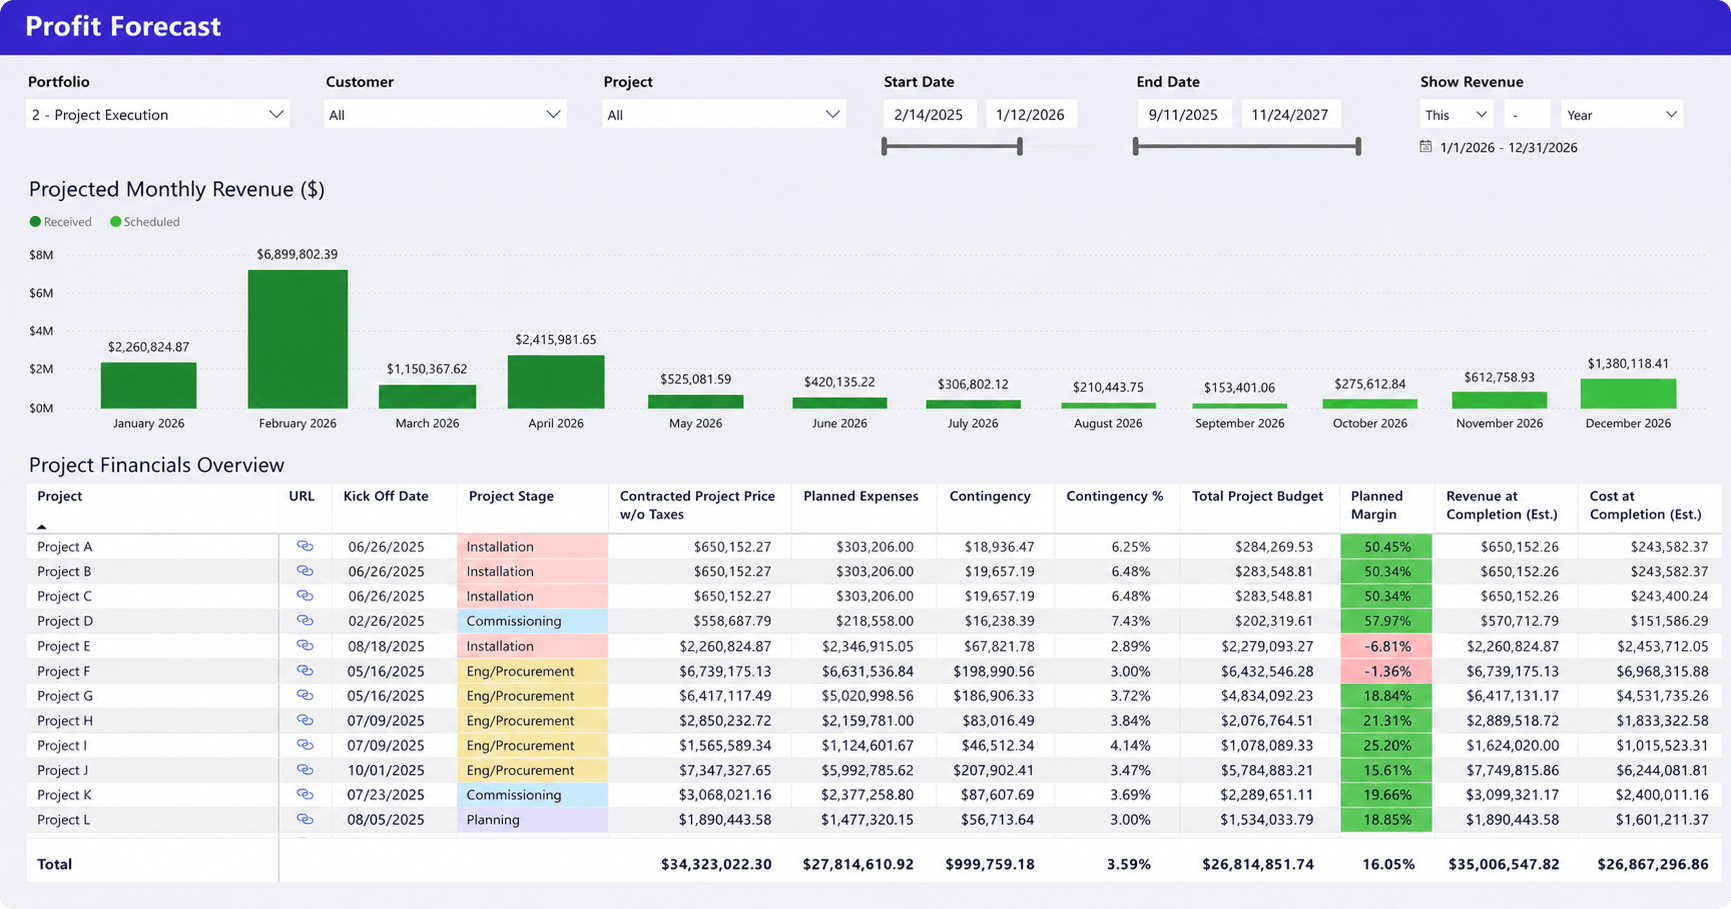
This dashboard forecasts future project revenue, costs, and margins across the portfolio. It compares estimated revenue at completion, projected costs, planned margins, and project budgets, helping leaders evaluate expected financial performance before projects are complete.
Why it matters
Forecasting profitability allows finance teams to identify projects that are likely to miss margin targets before issues affect financial results. By comparing projected revenue, costs, and margins, leaders can adjust budgets, staffing, or project plans early to improve overall profitability.
Revenue recognition dashboard
What it shows
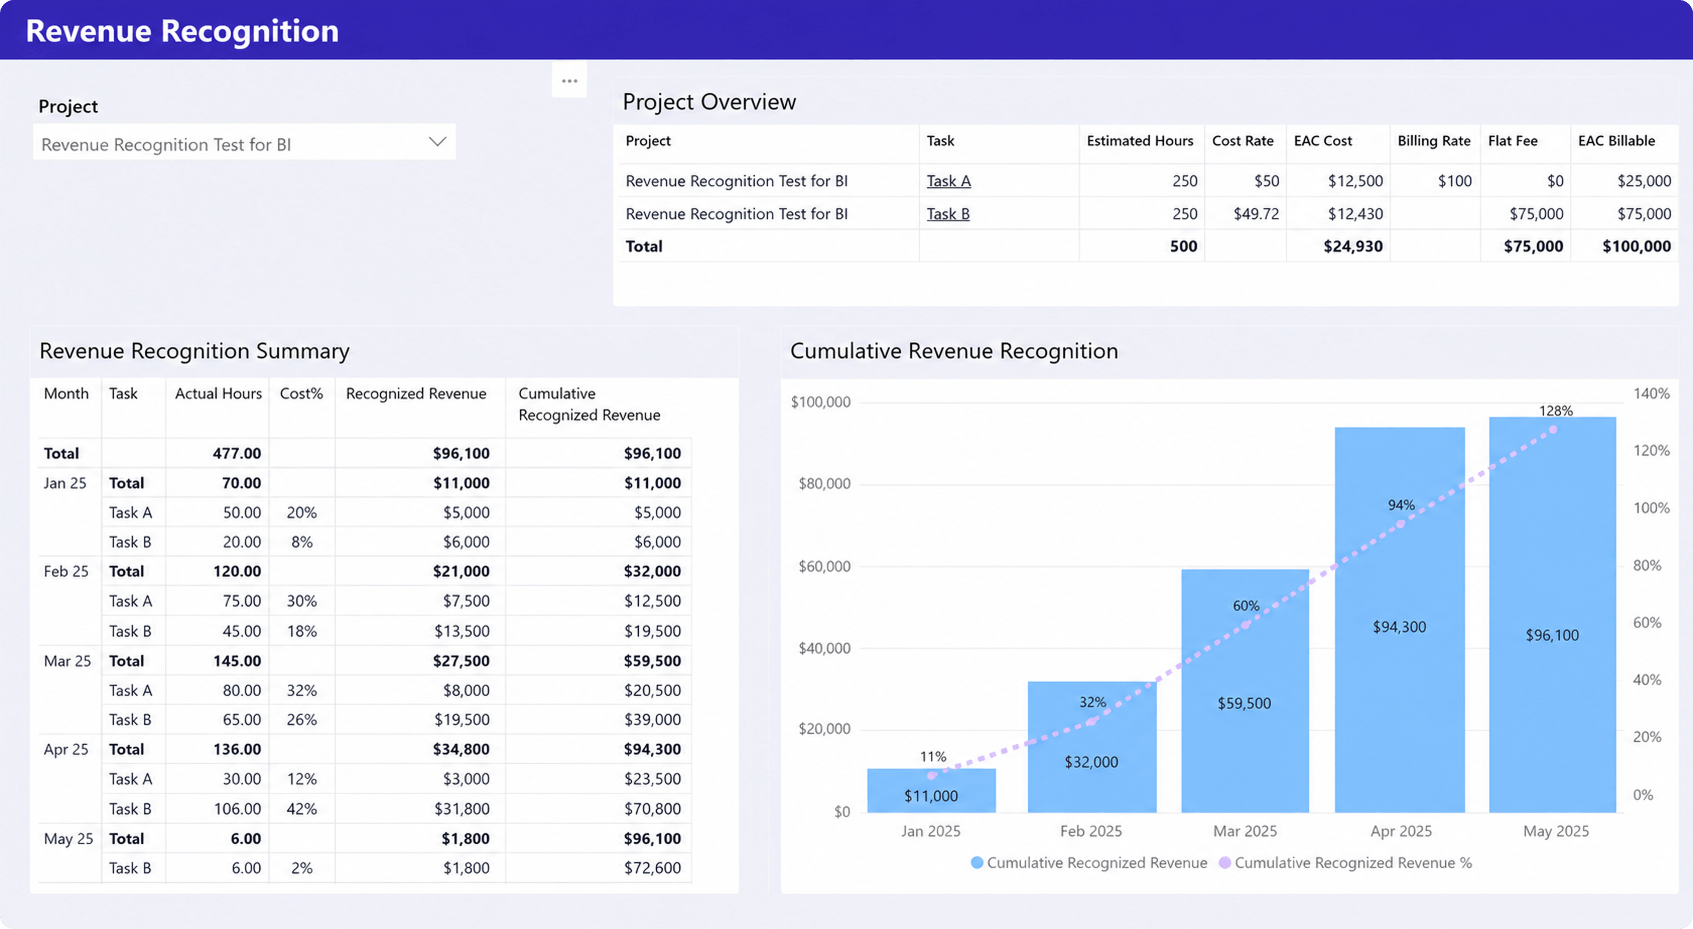
This dashboard tracks recognized revenue throughout the project by comparing estimated costs, billable value, actual hours, and cumulative recognized revenue over time. It also provides a project-level breakdown of revenue recognition progress.
Why it matters
Accurate revenue recognition gives finance teams a clearer view of project financial performance throughout delivery. By comparing recognized revenue with project progress, leaders can improve financial reporting, identify discrepancies early, and produce more reliable profitability forecasts.
The most important project profitability metrics
Dashboards are only as valuable as the metrics they display. While organizations may track dozens of financial KPIs, a small group of indicators consistently provides the clearest picture of project profitability.
Gross margin
Measures the percentage of revenue remaining after direct project costs. It is one of the clearest indicators of overall project profitability and helps identify declining financial performance across projects.
Project margin
Measures the profitability of an individual project, making it easier to compare financial performance across engagements and evaluate pricing and delivery efficiency.
Budget variance
Compares planned and actual project costs to identify budget overruns or savings before they significantly affect project margins.
Labor cost
Tracks labor expenses by project, role, or employee. Since labor is typically the largest delivery cost, monitoring it helps control project profitability.
Billable utilization
Measures the percentage of available time spent on billable work. Higher utilization generally improves profitability by increasing revenue generated from existing resources.
Realization rate
Compares billable work performed with the revenue actually invoiced. Low realization often indicates write-offs, discounts, or unbilled work that reduce profitability.
Revenue per project
Measures the revenue generated by each project, helping organizations compare the financial performance of different services, clients, or project types.
Forecast margin
Estimates expected project profitability using current costs, budgets, and remaining work, allowing teams to address financial risks before project completion.
Why project profitability reporting often fails
Many organizations already produce profitability reports. The challenge is that those reports often arrive too late or lack the information needed to influence project outcomes.
The issue is rarely a lack of data. More often, the data exists but is fragmented across disconnected systems, making it difficult to build an accurate, real-time view of project financial performance. This is a common challenge for growing professional services firms that have outgrown spreadsheets and point solutions but have not yet connected project delivery with finance.
Financial and delivery data are disconnected
Project managers work in one system. Finance teams work in another. Resource managers often rely on separate planning tools, while time tracking may exist somewhere else entirely.
As a result, understanding project profitability requires manually combining data from multiple sources. By the time reports are complete, the information is already outdated.
Costs are tracked too late
Labor costs, contractor expenses, travel costs, and project changes often appear in reports days or weeks after they occur. Without continuous visibility, finance teams cannot identify margin erosion while projects are still in progress.
Instead, they discover the problem after budgets have already been exceeded.
Reporting relies on spreadsheets
Many organizations still export reports from multiple systems and combine them manually in spreadsheets.
Besides consuming valuable time, spreadsheet-based reporting increases the likelihood of inconsistent calculations, version-control issues, and reporting delays. It also makes it difficult to scale reporting as the organization grows.
Teams focus on project status instead of financial performance
Many project dashboards emphasize schedule, milestones, and task completion.
While these metrics are important, they don’t answer the questions finance leaders care about:
- Are we still on budget?
- Is project margin declining?
- Are labor costs increasing faster than expected?
- Will this project achieve its target profitability?
Without financial KPIs, project health can appear strong even as profitability deteriorates.
Leaders only discover problems after the project ends
This is perhaps the biggest reporting failure. When profitability reviews happen only after project completion, the organization can learn from the outcome, but it cannot change it.
Effective project profitability dashboards shift reporting from retrospective analysis to proactive financial management by identifying risks while there is still time to respond.
How profitability dashboards improve financial decision-making
Project profitability dashboards help finance and operations teams move from reactive reporting to proactive decision-making. By combining financial and operational data, they enable organizations to:
Identify margin erosion earlier
Monitor changes in project margins throughout delivery and address issues before they significantly affect profitability.
Improve project pricing
Analyze historical margins across projects and clients to refine pricing, estimates, and future project budgets.
Reduce revenue leakage
Identify unbilled work, delayed approvals, write-offs, and low realization rates before they impact revenue.
Increase forecasting accuracy
Combine project progress, labor costs, budgets, and resource plans to produce more reliable revenue and profitability forecasts.
Support portfolio investment decisions
Compare project and client profitability to prioritize investments and focus resources on the highest-value opportunities.
Project profitability starts with connected operational data
A project profitability dashboard is only as good as the data behind it.
Many organizations manage projects, resources, time tracking, billing, and accounting in separate systems. As a result, finance teams spend time reconciling reports instead of analyzing profitability, while project managers lack visibility into financial performance.
The most effective dashboards combine project planning, resource management, time tracking, billing, and financial data into a single reporting layer. This allows leaders to monitor project margins, budget performance, labor costs, revenue, and forecasts using one source of truth.
Integrated PSA platforms make this possible by connecting operational and financial data. For example, Birdview PSA combines project management, resource planning, time tracking, budgeting, billing, and Power BI reporting, allowing organizations to monitor project profitability without manually consolidating data from multiple systems.
Conclusion
A project profitability dashboard is far more than a financial report.
It gives finance and operations leaders a real-time view of the factors that determine whether projects generate healthy margins or gradually lose profitability. By combining project, resource, financial, and billing data into a single dashboard, organizations can identify risks earlier, improve forecasting, reduce revenue leakage, and make better operational decisions before financial problems become permanent.
While every organization will tailor its reporting to its own business model, the most effective dashboards consistently focus on the metrics that influence profitability most: margins, costs, budgets, labor, utilization, revenue, and forecasts.
If your profitability reports still rely on disconnected systems or manual spreadsheets, it’s worth evaluating whether your reporting provides enough visibility to influence project outcomes, not just explain them afterward.
An integrated PSA platform with built-in BI reporting can make that transition significantly easier by connecting project delivery and financial performance into a single source of truth.
FAQ: Project profitability dashboards
What is a project profitability dashboard?
A project profitability dashboard is a reporting tool that combines project, financial, resource, and billing data to provide real-time visibility into project margins, costs, revenue, budgets, and overall financial performance. It helps organizations monitor profitability throughout project delivery instead of waiting until projects are completed.
Which metrics should a profitability dashboard include?
The most important project profitability metrics typically include gross margin, project margin, budget variance, labor cost, billable utilization, realization rate, revenue per project, forecast margin, and budget versus actual costs. The exact KPIs should align with your organization’s financial and operational goals.
How do you calculate project profitability?
Project profitability is generally calculated by subtracting total project costs, including labor, expenses, subcontractors, and other direct costs, from project revenue. Organizations often express profitability as either gross profit or project margin percentage to compare financial performance across projects.
Why do profitable projects lose money?
Projects often lose profitability because of budget overruns, increasing labor costs, poor resource allocation, unbilled work, scope creep, low realization rates, delayed invoicing, or inaccurate project estimates. A profitability dashboard helps identify these issues before they significantly affect financial results.
How often should project profitability be reviewed?
Project profitability should be reviewed continuously rather than only at month-end or after project completion. Real-time dashboards allow finance and operations leaders to monitor financial performance throughout project delivery, making it possible to address risks before they reduce project margins.