Ksenia Kartamysheva
 - PSA business cases fail on missing numbers, not missing merit. Champions present pains and features; CFOs decide on baseline costs, payback period, and adoption risk.
- Measure the status quo first. Manual reporting, invoicing delays, revenue leakage, and lost time entries typically add up to a five-figure monthly cost. In our 60-person worked example, roughly $25,000 per month.
- Build the ROI model on one or two conservative levers. Recovering just 1% of billable time for 25 consultants at a $150 rate is worth about $78,000 per year, which alone exceeds typical PSA spend of $5,000 to $25,000 per year.
- Price the full cost of ownership yourself: licenses, onboarding, internal migration time, and training. Hidden costs discovered later kill credibility; disclosed costs build it.
- Pre-answer every stakeholder. Finance asks about payback, IT about hosting and SSO, team leads about adoption, leadership about growth. Bring the answer for each seat before the meeting.
- Attach a 90-day plan and three success metrics (time-entry compliance, invoicing cycle time, reporting lag) so the request reads as a project with a finish line, not an open-ended expense.
A business case for PSA software needs four components: a quantified cost of the current state, an ROI model comparing that cost to the software investment, a stakeholder-specific objection plan, and an implementation timeline with success metrics. Professional services firms typically justify PSA spend of $5,000 to $25,000 per year against recovered billable hours, faster invoicing, and reduced revenue leakage.
Here is the situation this article is written for. Someone at the firm, often a new hire who used a PSA platform at a previous company, already knows the current setup is bleeding money. The problem is that the person who controls the budget does not feel that pain daily. The CFO hears “another software subscription” and asks what it costs, not what it fixes.
This guide walks through a five-step method to turn operational pain into numbers a finance leader will accept. At the end, you can download our PSA business case template with the worksheets and formulas pre-built.
Why PSA business cases get rejected
Most rejected PSA business cases fail for the same reason: they present pains instead of costs, and features instead of outcomes. “We waste a lot of time on reporting” is a complaint. “We spend 22 hours a month assembling time logs from Excel exports” is a cost the CFO can price.
Across 40+ discovery calls with professional services firms over the past year, we see three rejection patterns repeat:
- No baseline. The champion cannot say what the status quo costs per month, so finance has nothing to compare the subscription against.
- Answering the wrong question. Finance leaders decide on payback period and risk, not on Gantt charts and dashboards.
- No adoption plan. Roughly 60% of firms in our call corpus had already bought and abandoned a project management tool. Finance remembers that purchase, and a proposal without a rollout plan reads as a repeat write-off.
Each pattern has the same fix: bring evidence the approver can check. The five steps below produce that evidence.
Step 1: Quantify what the current state costs you
Before pricing any software, put a monthly dollar figure on doing nothing. This number anchors the entire business case. Measure one representative month, use conservative assumptions, and document how you got each figure. A conservative number the CFO can attack and still find large beats an impressive number that collapses under one question.
The table below covers the six cost categories we see most often. The example figures assume a 60-person firm; replace them with your own measurements.
| Cost category | How to measure it | Formula | Example (60-person firm) |
| Manual reporting time | Hours per month exporting, cleaning, and assembling time and status reports | Hours × loaded hourly cost of the people doing it | 22 hrs × $65 = $1,430/mo |
| Invoicing cycle time | Admin days per billing cycle, plus interest cost of billing delays | Admin hours × loaded cost + (billing delay days × daily revenue × cost of capital) | 2 days admin + 5-day billing delay = $1,200/mo |
| Revenue leakage on fixed-fee work | Projects delivered over budget with no change order, and untracked labor cost | (Actual hours − sold hours) × cost rate, on a sample of closed projects | 3% of $400K monthly delivery = $12,000/mo |
| Unbilled or lost time entries | Percentage of billable hours never captured because time entry happens days later | Billable hours × capture-loss % × average bill rate | 4,300 hrs × 1% × $150 = $6,450/mo |
| Double-booking and bench mismatch | Rush subcontracting or idle bench caused by planning in spreadsheets | Subcontractor premium paid + idle billable hours × bill rate | $3,000/mo (conservative) |
| Tool sprawl | Overlapping subscriptions plus context switching between them | Sum of redundant licenses + switching time × loaded cost | $900/mo |
Two of these categories deserve extra attention because they are both common and invisible in the accounting system.
Revenue leakage is the gap between the work you deliver and the work you bill. The owner of a digital agency in our interviews put it plainly: “We don’t track labor costs, we’re undercharging.” Around 55% of the firms we speak with cannot state labor cost per project, so fixed-fee margins are a guess. SPI Research’s 2026 Professional Services Maturity Benchmark sets under 5% leakage as the standard for healthy firms; most firms without systematic time capture do not know if they clear it.
Lost time entries are usually the single biggest number. When consultants reconstruct their week on Friday, short calls, emails, and small change requests disappear. Even a 1% capture loss on 25 billable people is real money, and 1% is a deliberately cautious assumption.
In this example, the current state costs roughly $25,000 per month, or $300,000 per year. The status quo is not free, it is just unbudgeted.
Step 2: Build the ROI model
The ROI formula for a PSA purchase is simple: ROI = (recovered value − total cost of ownership) ÷ total cost of ownership, calculated for year one and for steady state. The discipline is in the assumptions, not the math. Build the model on one or two conservative recovery levers, not ten optimistic ones. A model the CFO can stress-test and still find positive is what gets signed.
Here is a worked example for a 60-person consulting firm with 25 billable staff at an average bill rate of $150 per hour. Every figure is an assumption you should replace with your Step 1 measurements.
Recovered value, year one:
- Time capture: 25 billable staff work about 52,000 hours per year. Recovering 1% of billable time through same-day time entry equals roughly 520 hours, or $78,000 at $150 per hour.
- Admin recovery: cutting reporting and invoicing effort by half, per the Step 1 figures, returns about $16,000 per year in loaded staff cost.
- Total recovered value: ~$94,000. The model deliberately excludes leakage reduction, bench optimization, and faster payment. Those are upside, not the case.
Total cost of ownership, year one (see Step 3 for the components): licenses at $18,000, onboarding services at $5,000, and internal migration time at $7,000, for a total of $30,000.
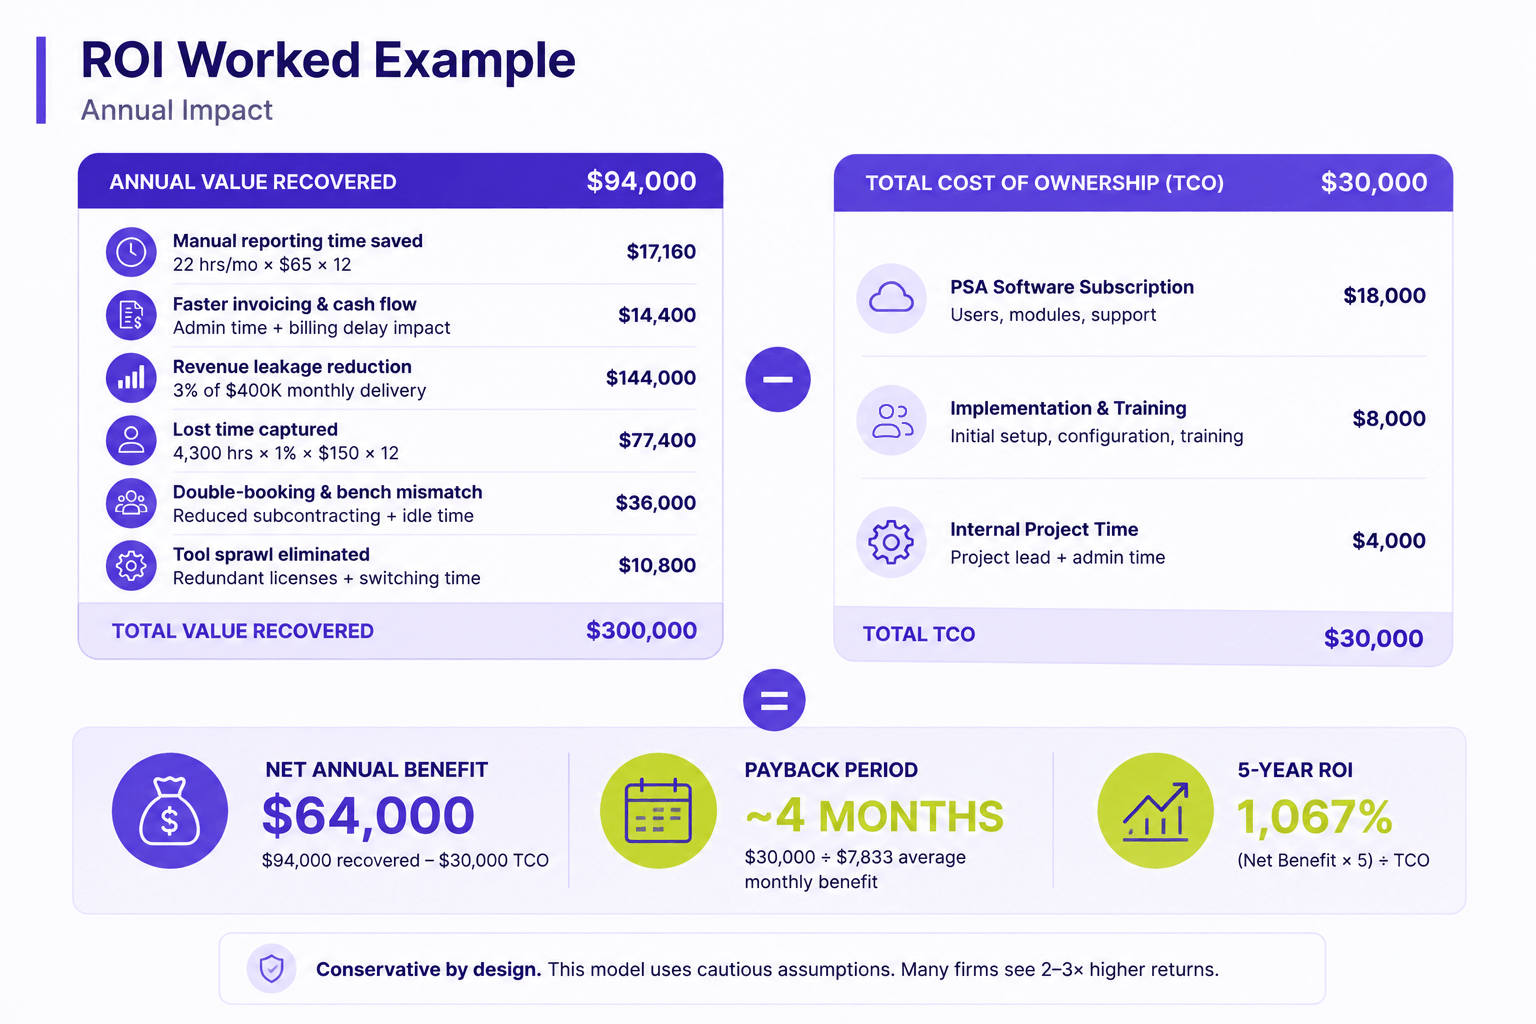
The result: net benefit of $64,000 in year one, ROI of roughly 213%, payback in about four months. Steady-state ROI is higher because implementation costs do not repeat. When leakage is real, payback periods for PSA software run in months, not years, and the model above shows why: a single point of billable utilization is worth more than most mid-market PSA contracts cost.
One benchmark worth citing in your deck: SPI Research’s 2026 benchmark of 509 professional services organizations found billable utilization fell to 66.4% in 2025, the lowest in the survey’s history and well below the 75% level SPI considers healthy. If your firm cannot currently measure utilization, that is itself an argument for the purchase.
Keep every assumption visible and editable. The template linked at the end of this article ships the model as a worksheet so finance can change the inputs themselves. A model they adjusted is a model they trust.
Step 3: Price the solution honestly, including hidden costs
Total cost of ownership is licenses plus implementation, internal migration time, and training, not the subscription line alone. Presenting only the license fee guarantees an uncomfortable question later, so put every component in the case yourself.
Across the mid-market professional services firms we work with, PSA spend typically runs $5,000 to $25,000 per year, with enterprise deployments going higher. The main cost drivers are:
- License structure. The typical PS firm needs 20 to 60 full users (project managers, resource planners, finance) and 50 to 200 collaborators (team members who log time and update tasks). Pricing that charges everyone as a full user inflates the bill fast; collaborator or guest licensing is where the structure either fits professional services or does not. Birdview PSA, as one example, prices full users and lightweight collaborator seats separately for exactly this reason.
- Onboarding services. Guided implementation adds a one-time cost but shortens time to value. For teams with no spare operations capacity, this is risk reduction, not an extra.
- Internal time. Data migration, template setup, and training consume real staff hours. Estimate them and put them in the model; hiding them undermines the whole case.
- Integrations. Confirm whether QuickBooks, HubSpot or Salesforce, and BI connections are included or priced separately.
Also state where a PSA is not justified, because your CFO is thinking it anyway. A firm under about 10 people, with a single billing model and no resource contention, will not recover a PSA subscription; a shared spreadsheet and an invoicing tool are the right answer at that size. The business case gets stronger when it names the conditions under which the answer would be no, and then shows the firm has outgrown them.
Step 4: Map stakeholders and answer their objections in advance
A business case is approved by a committee even when it is signed by one person. Finance, IT, team leads, and the managing partner each bring a different question to the table, and the champion who pre-answers all four walks out with a budget. Bring this table to the meeting filled in.
| Stakeholder | Their real question | The answer to bring |
| CFO / finance | “What is the payback period, and what happens to our books?” | The Step 2 model with editable assumptions. Plus the accounting angle: when billing lives outside the accounting system, you maintain two aging AR reports that never match. Native QuickBooks sync removes that. |
| IT | “Security, hosting, and access management?” | Hosting region, SOC 2 status, and SSO support. Data residency is a hard requirement for roughly 35% of the firms we talk to, especially in Canada. Birdview, for reference, runs on Azure with Canadian and US data centers, SOC 2 compliance, and Entra ID single sign-on. |
| Team leads | “Will people actually use it, or is this another dead tool?” | The adoption plan: role-based views so consultants see only their tasks and timesheet, light licenses for occasional users, mobile time entry, and a phased rollout starting with one pilot team. |
| CEO / managing partner | “How does this help us grow?” | Capacity forecasting connected to the pipeline. The growth constraint at most PS firms is not selling work, it is knowing who is available before sales commits to a date. |
There is a political layer here worth naming. A VP of project management at a credit union told us her portfolio decisions went to whoever argued loudest, because “I don’t have the data to back up why we can’t do that.” The business case is also the operations leader’s move from opinion-based arguments to data-backed ones.
Step 5: Present the plan, not just the purchase
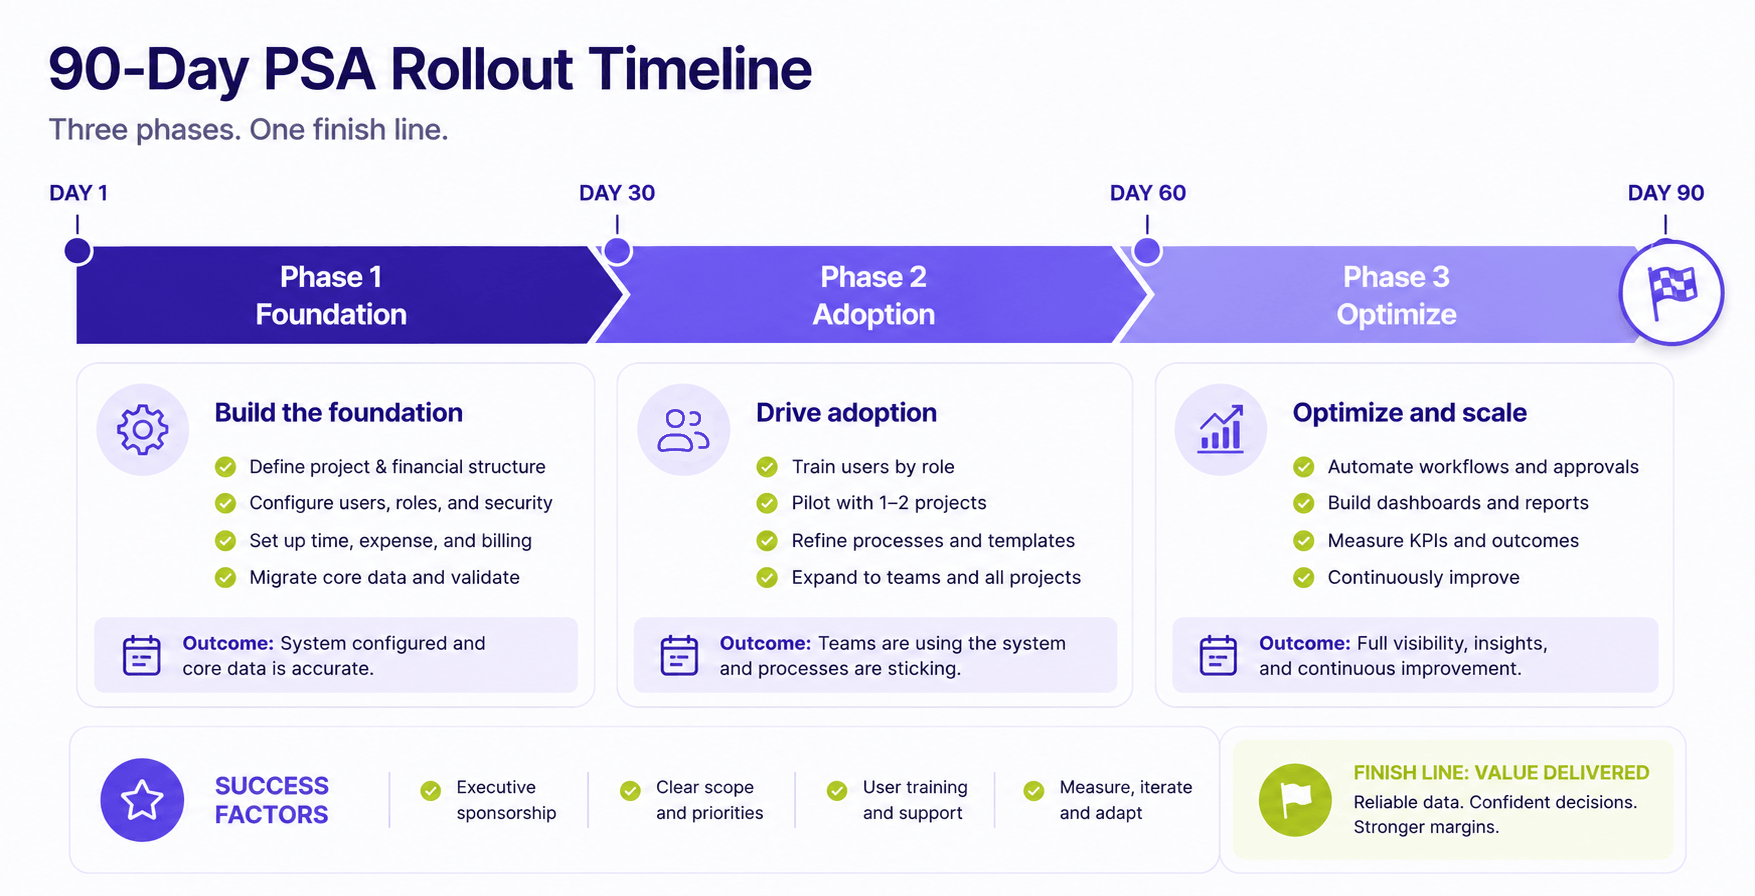
Attach a 90-day implementation outline and three success metrics to the ask. This one change converts the request from “an expense” into “a project with a finish line,” which is a category finance approves far more readily.
A realistic rollout for a mid-market firm:
- Weeks 1-4: system setup, project templates, data migration, integration connection.
- Weeks 5-8: pilot team goes live, time tracking first. Time entry produces the fastest visible payback and builds the habit everything else depends on.
- Weeks 9-12: firm-wide rollout and the first monthly close run in the new system.
Include vendor onboarding services as a line item if internal capacity is thin; it is cheaper than a stalled rollout.
Commit to three measurable outcomes, using the Step 1 baseline: time-entry compliance (target: 95% of timesheets submitted by Monday noon), invoicing cycle time (from a full admin day to under two hours), and reporting lag (from days of Excel assembly to same-day). Because you measured the baseline, you can prove the result in quarter one. That proof is also your renewal case a year later.
Close with the cost of doing nothing. The Step 1 figure, $25,000 per month in the worked example, does not pause while the decision waits, and it compounds with every hire. Typical DSO benchmarks for professional services run 30 to 60 days per Emagia’s 2025 industry analysis; every week of invoicing delay pushes the firm toward the wrong end of that range.
Common mistakes that sink PSA business cases
- Overstated savings. One inflated assumption discredits ten honest ones.
- Hidden TCO. If finance discovers the onboarding fee, you lose; if you present it, you gain credibility.
- No adoption plan. Fatal if the firm has abandoned a tool before, which most have.
- Feature pitching. The case answers three questions: who is available, are we profitable, and what is coming next.
- Springing the ask. Walk finance through the model informally first. Surprises get deferred; previewed proposals get approved.
Get the numbers on paper
The method is short: measure what the current state costs, model the recovery conservatively, price the solution including the hidden parts, pre-answer every seat at the table, and attach a plan with a finish line. A champion who does these five things stops arguing about pain and starts presenting a payback period.
Download the PSA business case template to get the current-state cost worksheet, the editable ROI model, the stakeholder objection map, and the 90-day timeline in one document.
To pressure-test the recovery assumptions before you present them, book a Birdview demo and bring your Step 1 worksheet. Walking your own numbers through the actual workflows (time capture, invoicing, resource forecasting) shows quickly whether the model holds.
FAQ
What is the typical payback period for PSA software?
Most professional services firms reach payback in 3 to 9 months. The main drivers are the amount of billable time currently lost to late or missing time entries, the admin hours spent on manual reporting and invoicing, and how quickly the team adopts daily time tracking. Firms with heavy fixed-fee work recover value faster because leakage there is largest.
How much does PSA software cost?
Mid-market PSA deployments typically cost $5,000 to $25,000 per year, with enterprise contracts running higher. Price depends mostly on the split between full users and lightweight collaborator seats, plus one-time onboarding services and any paid integrations. Total cost of ownership should also include internal migration and training time. See our pricing page for current Birdview figures.
How long does PSA implementation take?
A typical mid-market implementation takes 4 to 12 weeks: setup and data migration first, then a pilot team, then firm-wide rollout. Timelines extend when historical project data needs heavy cleanup, when integrations require custom field mapping, or when no one owns the rollout internally. Vendor onboarding services shorten the timeline for teams without spare operations capacity.
How do you measure PSA ROI after implementation?
Compare three metrics against the baseline you measured before purchase: time-entry compliance (share of timesheets submitted on time), invoicing cycle time (hours from period close to invoices sent), and reporting lag (time to produce utilization and budget reports). Improvement in these three, priced at loaded staff cost and average bill rate, gives a defensible realized-ROI figure.
Sources
- SPI Research, 2026 Professional Services Maturity Benchmark (509 firms; utilization, leakage, and margin benchmarks), co-published with Rocketlane: https://www.rocketlane.com/blogs/professional-services-maturity-index-2026
- Deltek, 2026 PSO Benchmarks: Insights from the SPI Maturity Benchmark Report (utilization at 66.4%, 75% healthy threshold): https://www.deltek.com/resources/articles/professional-services-benchmarks/
- Emagia, What Is a Good DSO for a Business in a Particular Industry? (2025; professional services DSO benchmarks of 30 to 60 days): https://www.emagia.com/resources/glossary/what-is-a-good-dso-for-a-business-in-a-particular-industry/