Leonid Kostin
 - Executive dashboards measure business performance, not project execution. Unlike PMO dashboards, they combine financial, operational, portfolio, and resource data to help leadership make strategic decisions.
- The most effective executive dashboards answer three questions: How is the business performing today? What is likely to happen next? Where does leadership need to act?
- A small set of focused dashboards provides more value than dozens of disconnected reports. Financial performance, portfolio health, resource utilization, profitability forecasting, strategic project oversight, and organizational performance together provide a complete view of business health.
- Executive KPIs are most valuable when viewed together. Revenue, profitability, utilization, capacity, and portfolio health reveal how operational performance affects financial results and future growth.
- Executive reporting is only as effective as the data behind it. Bringing together project management, financial management, resource planning, and business development into a single source of truth enables faster decisions, more accurate forecasting, and better business outcomes.
For executives in project-based organizations, success isn’t measured by whether individual projects finish on time. It’s measured by whether the business is growing profitably, resources are being used effectively, and the organization has the capacity to sustain future growth.
As organizations expand, gaining that visibility becomes increasingly difficult. Financial, project, resource, and operational data often live in separate systems, forcing leadership teams to piece together business performance from disconnected reports. Instead of spending time making strategic decisions, executives spend it reconciling numbers.
An executive dashboard solves this by bringing together financial and operational data into a single view of portfolio health, profitability, resource capacity, revenue, and strategic risks. Rather than replacing operational reporting, it helps leadership understand where the business stands today, where it’s headed, and where executive attention is needed most.
This guide explains how executive dashboards differ from PMO dashboards, which executive dashboards provide the greatest strategic value, and the KPIs every leadership team should monitor.
Executive dashboards vs. PMO dashboards
This difference goes beyond the metrics displayed on the dashboard because it changes the decisions the dashboard is designed to support.
Project managers are responsible for delivering projects successfully. They monitor schedules, budgets, milestones, and resource assignments to keep work on track. Executive teams are responsible for the performance of the entire business. Their focus is understanding how project delivery affects profitability, resource capacity, revenue growth, and future business performance.
For example, a project manager may be concerned that a key project milestone slipped by two weeks. A COO is more likely to ask whether that delay will reduce billable utilization, postpone revenue recognition, affect quarterly forecasts, or prevent the organization from taking on new client work. The operational issue is the same, but executives evaluate it based on its impact on the business.
That’s why executive dashboards combine operational, financial, and resource data into a single view. Instead of simply reporting what happened, they help leadership understand why it matters, where the business is at risk, and which decisions will have the greatest impact on future performance.
| PMO dashboard | Executive dashboard |
| Manages project execution | Manages business performance |
| Used by PMOs, program managers, delivery leaders | Used by CEOs, COOs, CFOs, and executive teams |
| Focuses on schedules, milestones, budgets, and project risks | Focuses on revenue, profitability, capacity, portfolio health, and strategic objectives |
| Helps deliver projects successfully | Helps grow the business sustainably |
| Measures operational performance | Measures business outcomes |
This difference also changes the types of questions each dashboard should answer.
A project manager needs to know whether a milestone slipped or whether additional resources are required to complete a project on time.
An executive needs to know whether declining utilization will affect next quarter’s revenue, whether project margins are falling across an entire service line, or whether the organization has enough delivery capacity to support the sales pipeline.
Operational dashboards answer “How is this project performing?”
Executive dashboards answer “How is the business performing?”
What executives should see every morning
The best executive dashboards are built around decisions rather than data. Within a few minutes of opening a dashboard, executives should understand how the business is performing, what is likely to happen next, and where leadership attention is needed.
| Executive question | Information required |
| How is the business performing today? | Revenue, profitability, portfolio health, delivery performance |
| What is likely to happen next? | Revenue forecasts, capacity trends, project pipeline, forecast accuracy |
| Where should leadership focus its attention? | High-risk projects, declining margins, overloaded teams, strategic initiatives at risk |
Unlike operational dashboards, executive dashboards don’t focus on tasks or individual activities. They connect operational performance with business outcomes, helping leadership understand how delivery affects profitability, capacity, and future growth. Rather than tracking every available metric, effective dashboards highlight a small number of strategic KPIs that support faster, more informed decisions.
The 6 executive dashboards every leadership team should have
No single dashboard can answer every executive question. Running a project-based organization requires leaders to understand financial performance, portfolio health, workforce capacity, future profitability, and organizational performance, all of which provide different perspectives on the business.
Rather than relying on dozens of disconnected reports, successful leadership teams use a focused set of executive dashboards that together provide a complete view of organizational health. Each dashboard supports a specific strategic decision, from evaluating financial performance and delivery capacity to identifying growth opportunities and emerging risks. Used together, they help executives move beyond reactive reporting and make faster, more confident decisions based on a single view of the business.
| Executive dashboard | Primary purpose | Key metrics | Typical review frequency |
| Revenue, Cost & Profit Dashboard | Evaluate overall financial performance | Revenue, project costs, profit margin, revenue by region, cost by job role | Daily |
| Portfolio Summary Dashboard | Monitor portfolio health and strategic delivery | Portfolio budgets, project status, project types, regional distribution, client activity | Weekly |
| Resource Utilization Dashboard | Balance workforce capacity and utilization | Billable utilization, capacity, workload, actual hours, staffing trends | Weekly |
| Profit Forecast Dashboard | Forecast future financial performance | Projected revenue, planned costs, forecast margins, contingency, estimated profit | Weekly |
| Executive Project Scorecard | Review strategic project performance | Profitability, budget health, schedule performance, billing, expected profit | As needed for executive reviews |
| Executive Summary Dashboard | Compare business unit and office performance | Estimated profit, margin, profit per employee, project hours, workforce productivity | Monthly |
Revenue, Cost & Profit Dashboard
What it shows
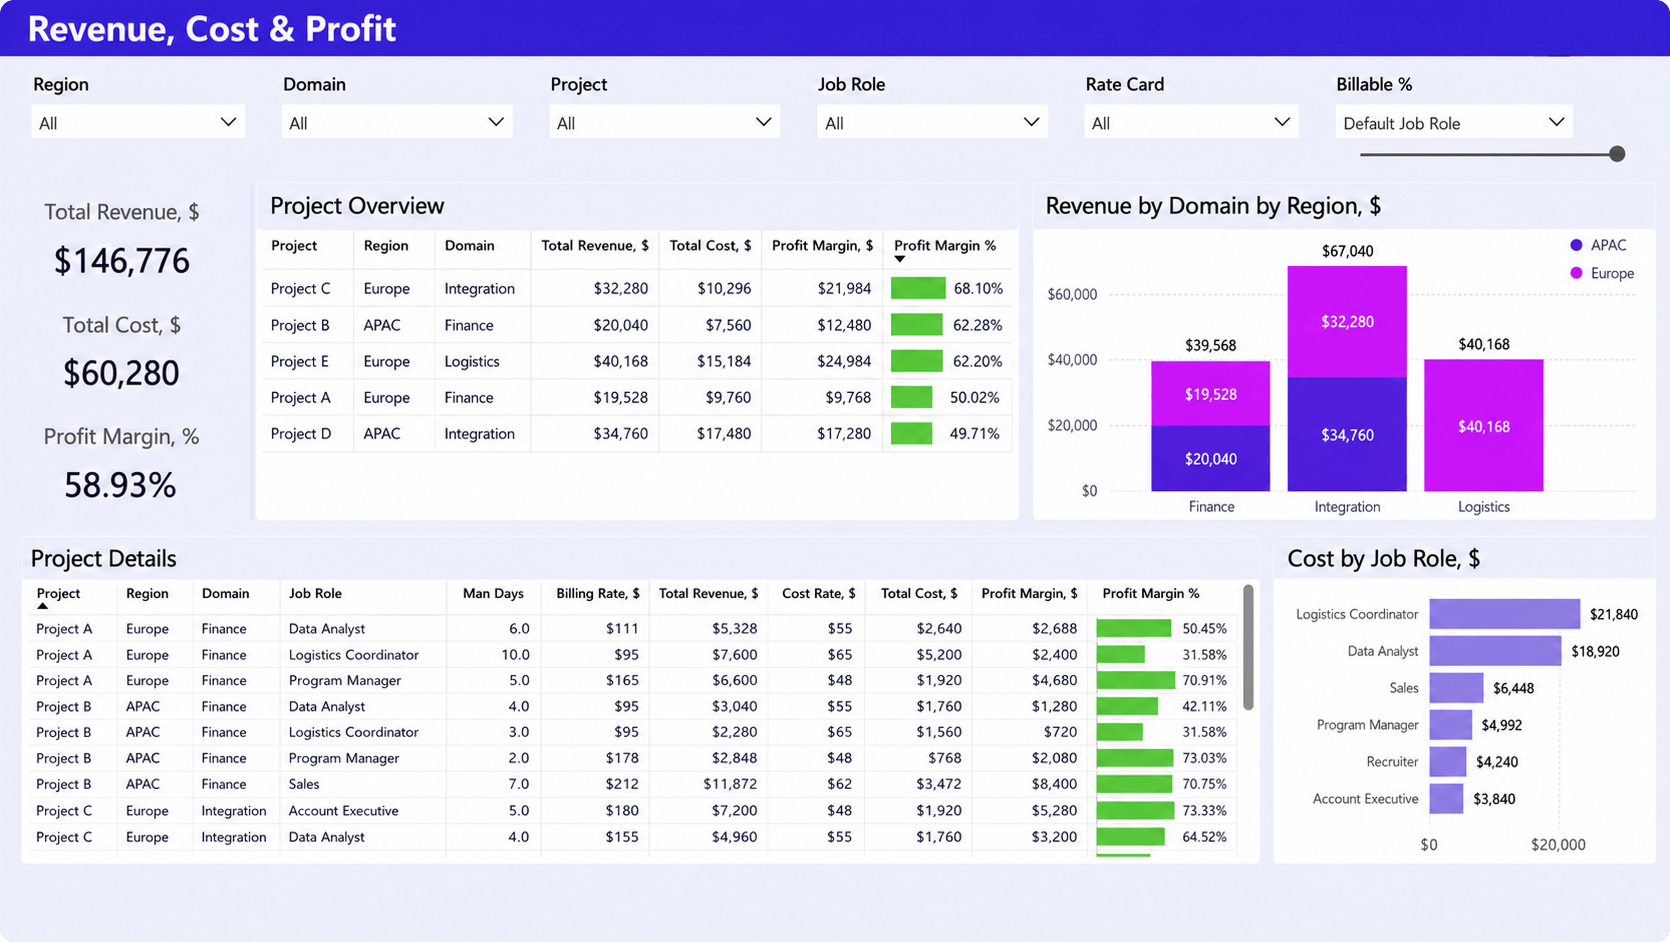
This dashboard provides executives with a consolidated view of revenue, project costs, and profit margins across projects, regions, business domains, and job roles. Instead of reviewing separate financial reports, leaders can quickly identify which parts of the business generate the strongest financial results and where profitability is declining.
Why it matters
Revenue alone doesn’t indicate business health. Executives need to understand whether growth translates into profit and which services, regions, or projects contribute most to financial performance. By connecting revenue, costs, and margins in a single view, this dashboard helps leadership identify trends early, improve pricing decisions, and focus investment on the most profitable areas of the business.
Portfolio Summary Dashboard
What it shows
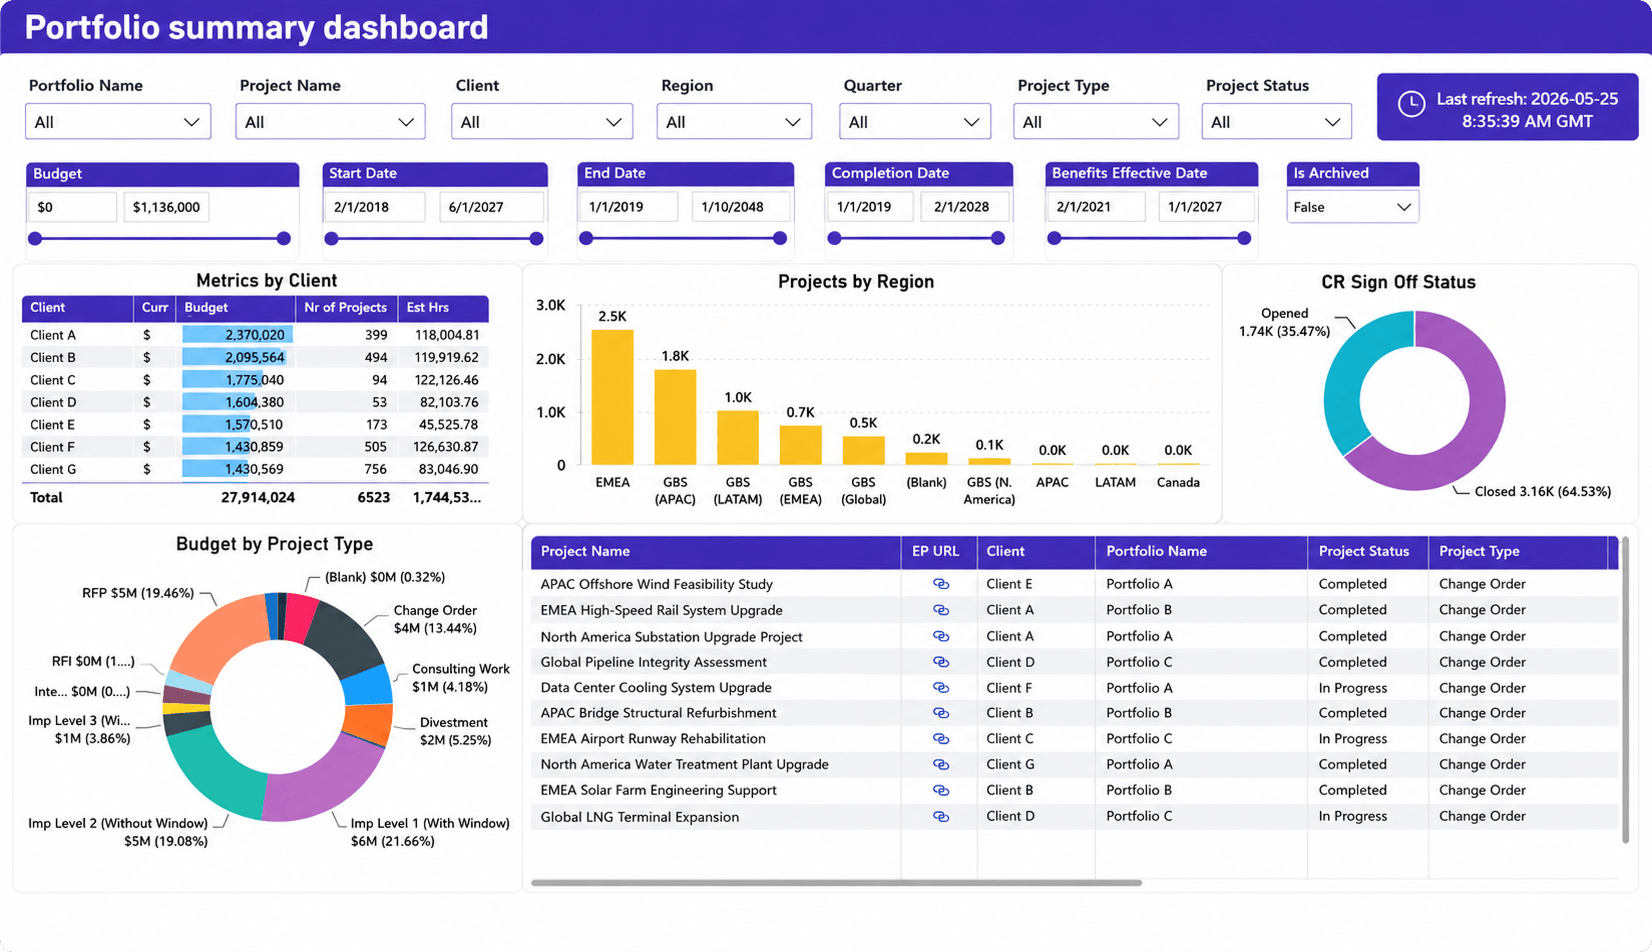
A portfolio summary dashboard gives executives a real-time view of project performance across the entire organization. It consolidates portfolio budgets, project status, client activity, regional distribution, project types, and completion trends into a single view, making it easy to monitor delivery performance without reviewing individual projects.
Why it matters
As organizations grow, leadership loses visibility when each department reports on projects independently. A portfolio summary dashboard provides a consolidated view of the organization’s delivery pipeline, helping executives identify projects that require attention, understand where budgets are being invested, monitor progress across regions and clients, and ensure strategic initiatives remain on track.
Resource Utilization Dashboard
What it shows
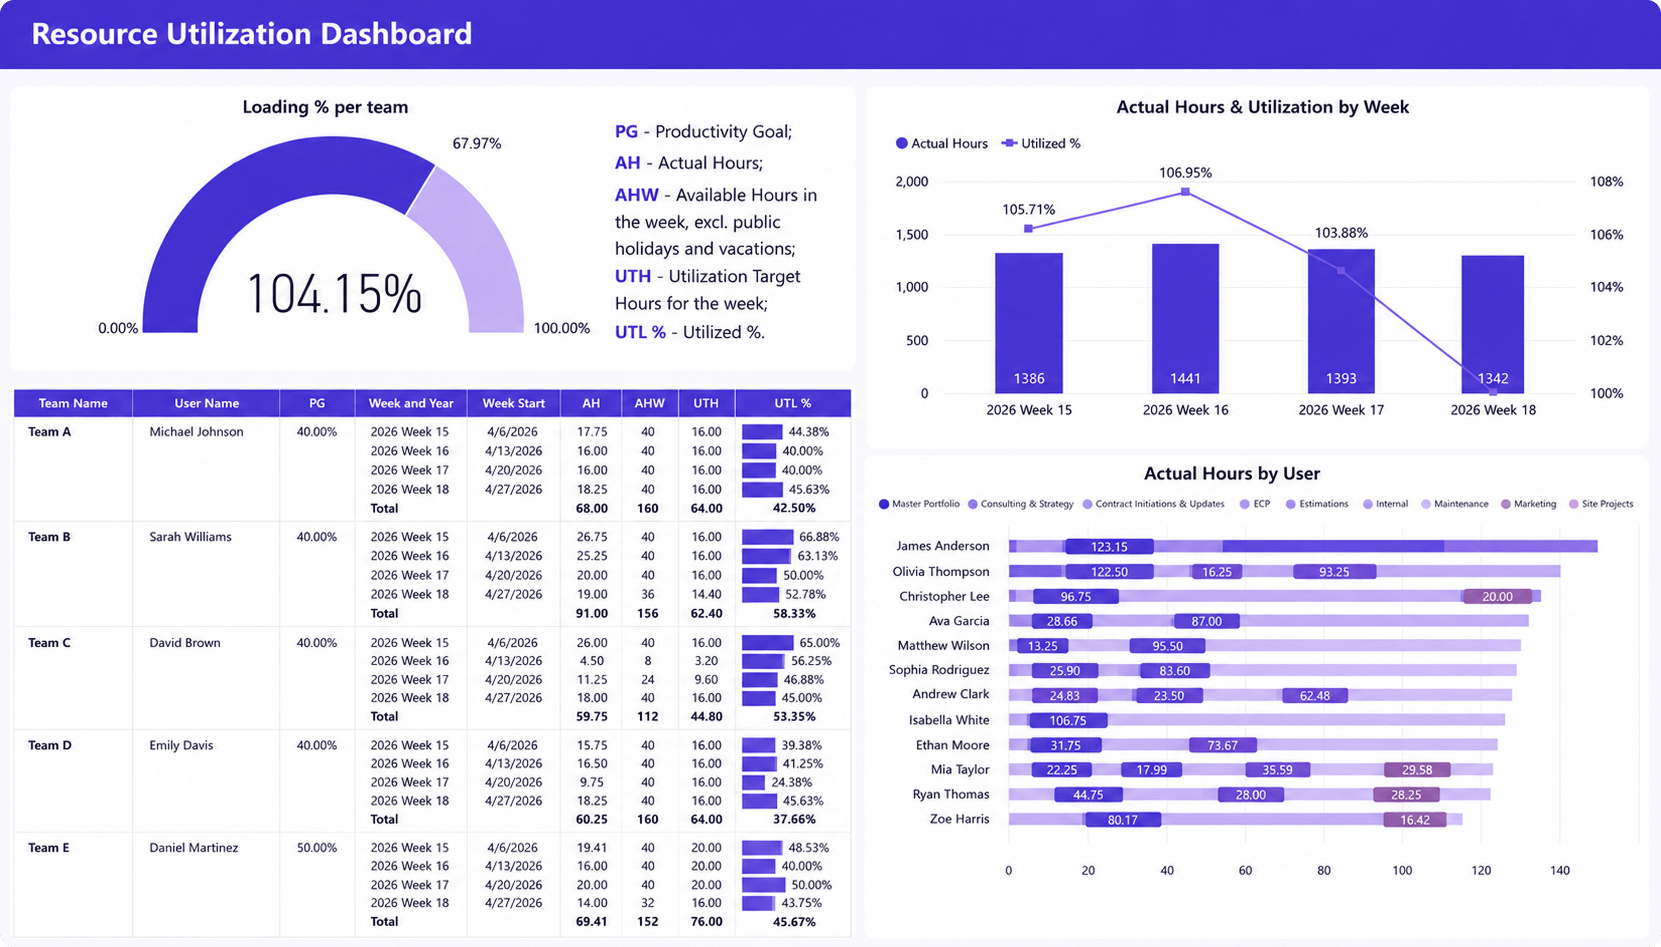
A resource utilization dashboard gives executives a real-time view of workforce performance by combining utilization rates, available capacity, actual hours worked, and workload distribution across teams and individuals. Instead of focusing on day-to-day scheduling, it highlights broader workforce trends that influence delivery capacity and future business growth.
Why it matters
In project-based organizations, people are the primary revenue-generating asset. If utilization is consistently too low, the business loses revenue opportunities. If it remains too high, delivery quality, employee well-being, and client satisfaction are all at risk. This dashboard helps executives maintain the right balance by identifying capacity constraints early, supporting hiring decisions, and ensuring the organization can meet future demand without overloading delivery teams.
Profit Forecast Dashboard
What it shows
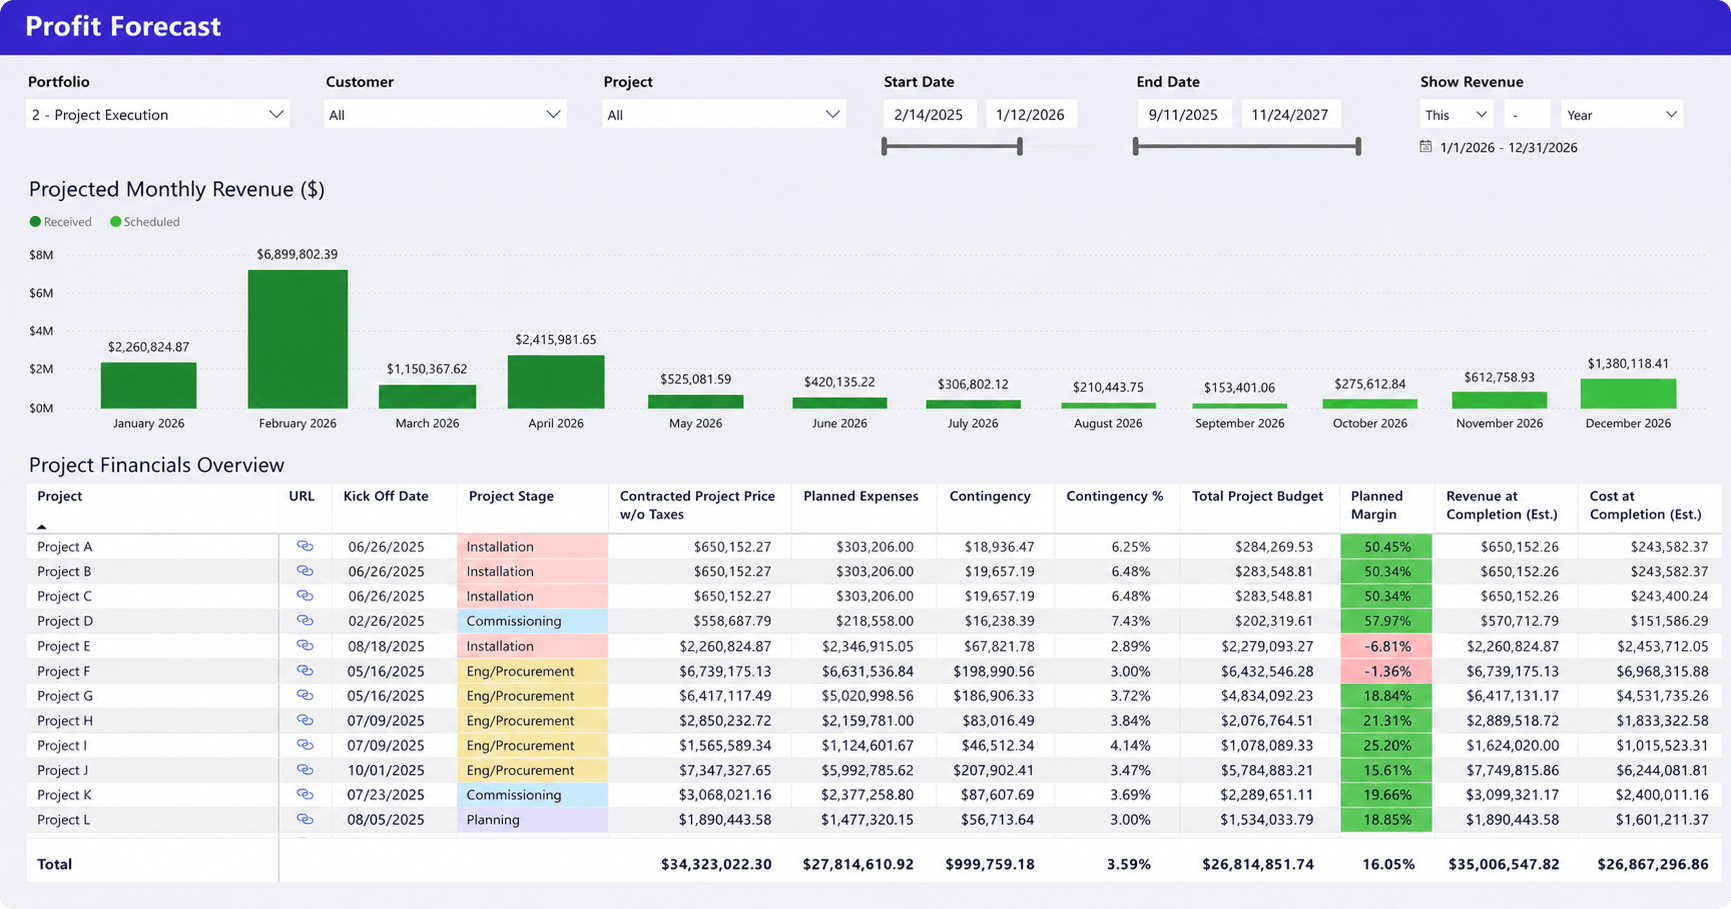
A Profit Forecast Dashboard combines projected revenue, planned costs, budgets, and expected margins to estimate future financial performance across the project portfolio.
Why it matters
Historical reports explain past performance, while profit forecasting helps executives anticipate future results. By comparing projected revenue with expected costs and margins, leadership can identify projects that threaten profitability and make proactive decisions around pricing, staffing, or project prioritization before financial targets are missed.
Executive Project Scorecard
What it shows
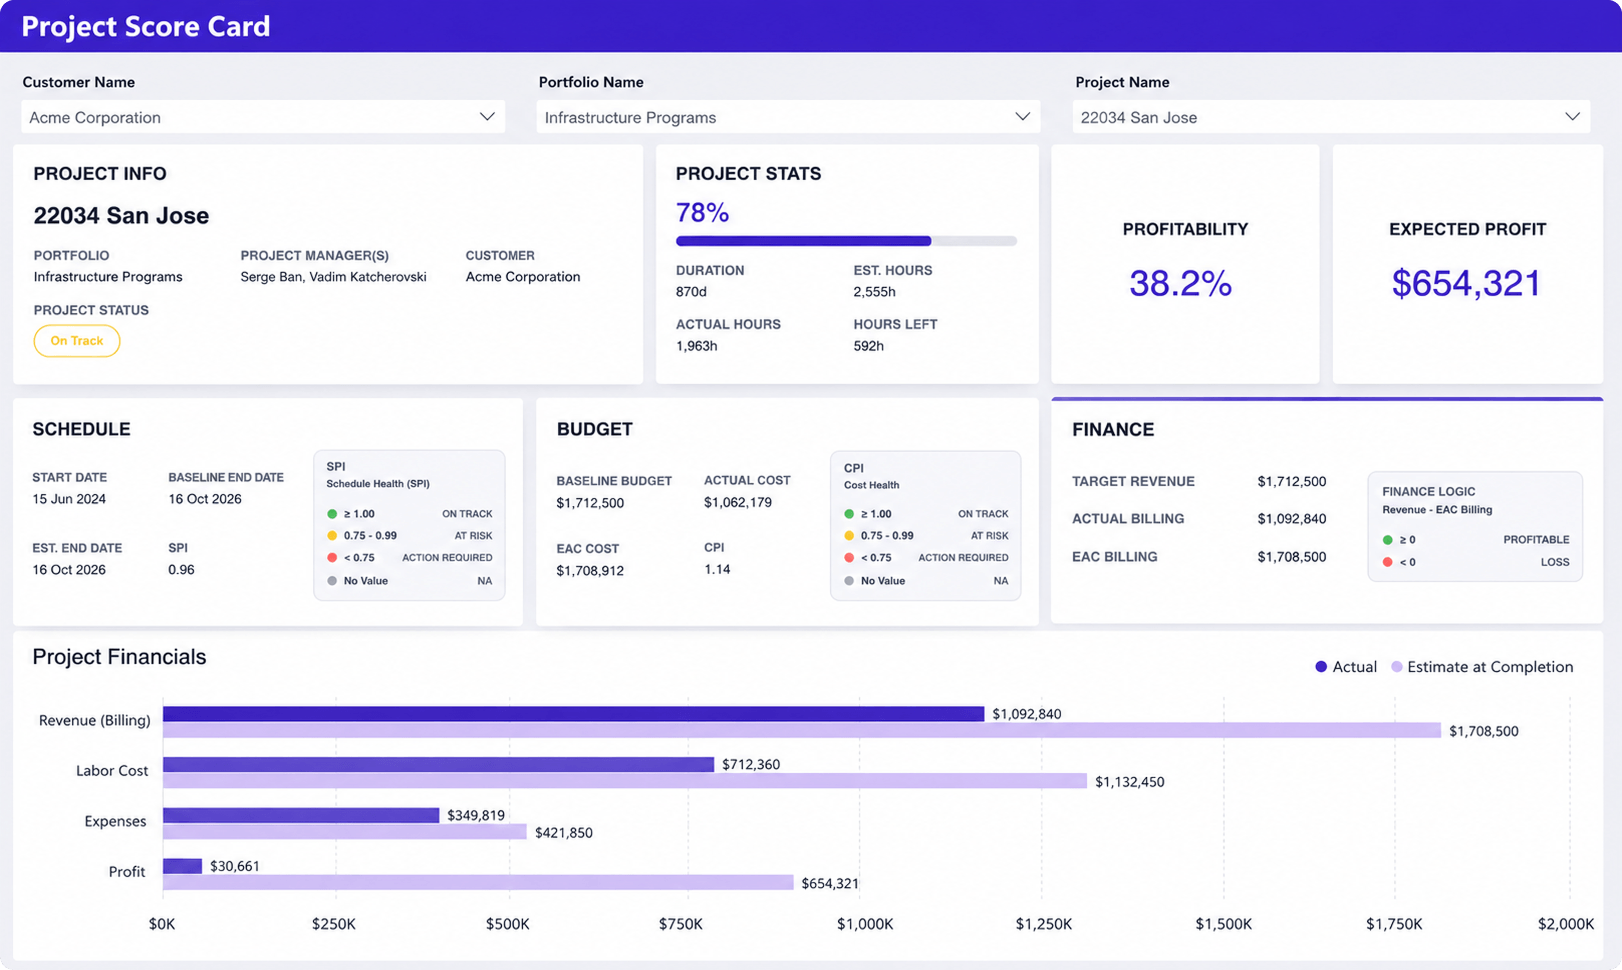
An Executive Project Scorecard provides a high-level view of a strategic project’s financial, operational, and schedule performance by combining profitability, budget health, billing progress, schedule status, and expected profit into a single executive summary.
Why it matters
While most projects are managed by delivery teams, high-value initiatives often require executive oversight. This dashboard helps leadership quickly assess project health, identify emerging risks, and determine whether executive intervention is needed before issues affect financial performance or client relationships.
Executive Summary Dashboard
What it shows
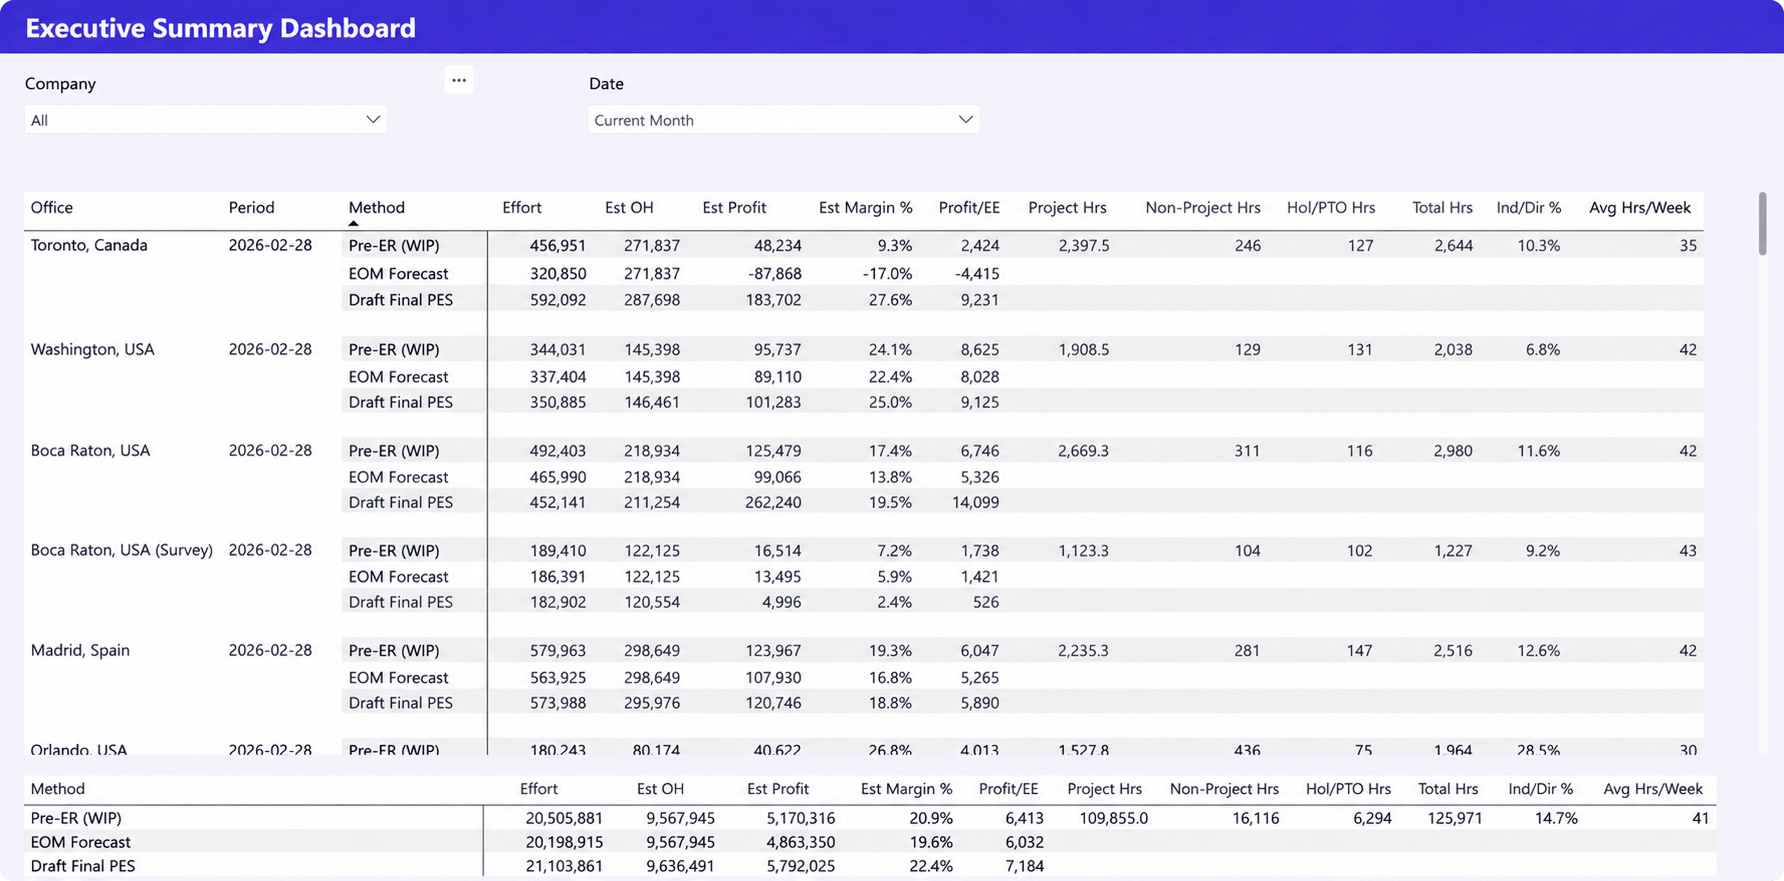
An Executive Summary Dashboard compares financial and operational performance across offices, business units, or regions by combining profitability, workforce utilization, project effort, and productivity metrics into a standardized view.
Why it matters
As organizations grow, executives need a consistent way to compare business performance across locations. This dashboard highlights high-performing offices, uncovers operational inefficiencies, and supports decisions around staffing, investment, and resource allocation.
Executive KPIs that actually drive strategic decisions
Executives don’t need dozens of performance metrics. A relatively small set of well-defined KPIs provides enough information to evaluate whether the organization is growing sustainably and where leadership attention is required.
The following KPIs form the foundation of most executive dashboards.
| KPI | Why it matters | Business question it answers |
| Revenue growth | Measures business expansion | Are we growing at the expected pace? |
| Gross margin | Indicates delivery efficiency and pricing performance | Is growth translating into profit? |
| Project profitability | Highlights financially successful and underperforming projects | Which work creates the most value? |
| Billable utilization | Measures workforce productivity | Are resources generating enough revenue? |
| Capacity availability | Supports staffing and growth planning | Can we take on additional work? |
| Forecast accuracy | Builds confidence in planning | Can leadership rely on future projections? |
| Portfolio health | Summarizes delivery performance across the business | Are strategic initiatives progressing successfully? |
| Client profitability | Evaluates long-term account value | Which client relationships deserve further investment? |
The KPIs above are most valuable when viewed together rather than in isolation. Revenue growth, profitability, utilization, and portfolio health each tell only part of the story, but together they reveal how operational performance influences financial outcomes and future growth. Executive dashboards should focus on these relationships rather than individual metrics, enabling leadership to identify risks earlier and make more confident strategic decisions. For the full picture, see our guide to the KPIs services firms track.
Why executive reporting often falls short
Most organizations don’t struggle because they lack reporting tools. They struggle because the information executives receive is fragmented, inconsistent, and disconnected from the decisions they need to make.
This challenge appears repeatedly as project-based organizations grow. Finance develops one set of reports, project teams maintain another, resource managers rely on separate planning tools, and sales forecasts future demand in the CRM. Each department produces accurate information for its own needs, but executives are left trying to combine multiple versions of the truth into a single business narrative. This fragmentation is one of the most common pain points identified in Birdview’s customer research, particularly among organizations that have outgrown spreadsheets or disconnected point solutions.
The problem extends beyond reporting efficiency. When departments calculate metrics differently or rely on different reporting cycles, leadership meetings often focus on reconciling numbers instead of discussing actions. Valuable time is spent determining which report is correct rather than deciding how to improve business performance.
Another limitation is that many executive reports remain heavily focused on historical performance. Monthly financial statements explain what happened last month, while project reports summarize completed work. Neither provides sufficient visibility into what is likely to happen next or where executive intervention is required today.
Effective executive dashboards solve these problems by connecting operational, financial, portfolio, and resource data into a consistent reporting framework. Instead of presenting isolated metrics, they show how project delivery influences profitability, how utilization affects future capacity, and how sales forecasts align with available resources. This shift from disconnected reporting to connected business intelligence allows executives to move from reactive management to proactive decision-making.
Building a single source of truth for executive reporting
The quality of an executive dashboard depends less on its visual design than on the quality of the data behind it. Even the most sophisticated dashboard will produce poor decisions if it pulls information from disconnected systems that define metrics differently or update on different schedules.
This is why many organizations continue to struggle with executive reporting even after investing in business intelligence tools. The dashboard isn’t the problem. The underlying data architecture is.
For project-based organizations, the most valuable executive dashboards combine information from four core business functions.
| Business function | Executive insight |
| Project delivery | Portfolio health, delivery performance, strategic initiative status |
| Resource management | Capacity, utilization, staffing risks, future demand |
| Financial management | Revenue, profitability, budgets, margins, billing |
| Business development | Sales pipeline, forecast revenue, future growth opportunities |
When these data sources are connected, executives no longer need to compare reports from finance, operations, delivery, and sales to understand what is happening across the business. Instead, they can see how one area influences another.
Consider a consulting firm with a strong sales pipeline but declining forecast confidence. Viewed in isolation, sales data suggests the business is growing. A resource dashboard might simultaneously show that senior consultants are operating above sustainable utilization while capacity continues to shrink. By combining these views, leadership can quickly identify that future revenue is at risk, not because demand is weak, but because delivery capacity is becoming the constraint.
Imagine your executive dashboard shows revenue increasing while profit margins decline and billable utilization exceeds sustainable levels. At first glance, the business appears to be growing, but the connected metrics tell a different story: teams are approaching capacity, projects are becoming less profitable, and continued growth could lead to delivery issues. Instead of reacting after margins fall or projects slip, executives can rebalance workloads, adjust pricing, recruit additional consultants, or prioritize higher-value work before financial performance is affected.
The same principle applies across every executive KPI. Revenue should be viewed alongside project profitability. Utilization should be evaluated together with capacity availability. Portfolio health should be considered in the context of strategic objectives rather than individual project status. When operational and financial data are connected, dashboards become decision-support tools rather than reporting tools.
Platforms that combine project management, resource planning, financial management, time tracking, and reporting make this considerably easier because they eliminate much of the manual effort required to reconcile information from multiple applications. For example, Birdview PSA allows organizations to bring together portfolio performance, resource capacity, project financials, time tracking, and business intelligence into a unified reporting environment. Rather than replacing departmental reporting, it provides executives with a connected view of the business that supports faster, more informed strategic decisions. This reflects the broader principle that executive dashboards are most effective when they are built on a single source of operational and financial truth rather than isolated reports.
Conclusion
Executive dashboards help leadership manage the business rather than individual projects. By bringing together financial performance, portfolio health, workforce capacity, and future forecasts, they give executives the visibility needed to make faster, more confident strategic decisions.
Just as importantly, the value of any dashboard depends on the quality of the underlying data. Organizations that connect project delivery, financial management, resource planning, and business development into a single reporting framework spend less time reconciling reports and more time acting on insights.
If you’re evaluating executive reporting, focus first on the business decisions your leadership team needs to make, then build dashboards that provide the information required to support those decisions.
FAQ
What is an executive dashboard?
An executive dashboard is a high-level reporting tool that combines financial, operational, project, and resource data into a single view. It helps executives monitor overall business performance, track strategic objectives, identify emerging risks, and make faster, data-driven decisions.
What should an executive dashboard include?
An executive dashboard should include KPIs that reflect the overall health of the business, such as revenue growth, gross margin, project profitability, portfolio health, billable utilization, capacity availability, forecast accuracy, and client profitability. Rather than displaying operational detail, it should focus on trends, exceptions, and business outcomes.
Which KPIs are most important for executives?
For most project-based organizations, the most valuable executive KPIs include revenue growth, gross margin, project profitability, billable utilization, capacity availability, forecast accuracy, portfolio health, and client profitability. Together, these metrics provide a balanced view of financial performance, delivery effectiveness, and future growth.
How is an executive dashboard different from a PMO dashboard?
A PMO dashboard helps project and portfolio managers oversee project execution by tracking schedules, budgets, milestones, and delivery risks. An executive dashboard operates at a higher level, combining portfolio, financial, operational, and resource data to help leadership evaluate overall business performance and support strategic decision-making.
How often should executives review their dashboards?
Most executive teams review their primary business performance dashboard daily to monitor organizational health. Portfolio, financial, and strategic dashboards are typically reviewed in greater detail during weekly leadership meetings and monthly business performance reviews.