Leonid Kostin
 - Resource management dashboards help service firms improve utilization, balance workloads, forecast demand, and make more informed staffing decisions.
- The most valuable dashboards provide visibility into capacity, utilization, availability, workload distribution, and future resource demand across the entire organization.
- Resource visibility is critical for preventing overallocation, reducing bench time, avoiding burnout, and ensuring projects have the right people assigned at the right time.
- Effective resource dashboards combine real-time resource data with forecasting capabilities, helping managers identify capacity risks before they affect project delivery.
- The most important resource management dashboards include utilization dashboards, capacity planning dashboards, labor projections, demand forecasting, workforce capacity forecasting, and allocation management dashboards.
- Key resource management KPIs include billable utilization, capacity utilization, resource availability, forecast accuracy, bench utilization, staffing fulfillment rate, and allocation accuracy.
- Many resource planning challenges stem from spreadsheet-based processes, disconnected project and resource data, outdated forecasts, and limited visibility across multiple projects.
- Resource dashboards improve decision-making by helping managers identify workload imbalances, staffing shortages, skills gaps, and future capacity constraints earlier.
- Forecasting becomes more reliable when resource, project, time tracking, and capacity data are connected within a single reporting environment.
- The goal of resource management is not maximizing utilization at all costs, but balancing utilization, capacity, availability, skills, and future demand to support sustainable delivery and profitability.
Resource management dashboards help service firms improve utilization, balance workloads, forecast future resource needs, and make better staffing decisions. By consolidating resource data into a single view, these dashboards provide the visibility managers need to allocate people effectively, avoid capacity shortages, and improve profitability.
For service organizations, people are the primary revenue-generating asset. Whether you run a consulting firm, IT services company, engineering practice, or agency, your ability to manage resources directly affects project delivery, client satisfaction, and financial performance.
The challenge is that many organizations still rely on spreadsheets, disconnected reports, and manual planning processes. As project portfolios grow, it becomes increasingly difficult to understand who is available, who is overloaded, where skills gaps exist, and how future demand will affect capacity.
This is where resource management dashboards become essential.
Why resource visibility is critical for service firms
Service firms generate revenue through people. Resource management dashboards help leaders monitor utilization, capacity, workload, and staffing needs so they can make better delivery and planning decisions.
Without resource visibility, managers often make staffing decisions based on incomplete information. Team members become overloaded while others remain underutilized. Projects compete for the same specialists. Hiring decisions are delayed because future demand is unclear.
These challenges are common across service organizations:
- Limited visibility into resource availability
- Resource conflicts across multiple projects
- Uneven workloads and burnout risks
- Forecasting uncertainty
- Spreadsheet-based planning processes
The consequences can be significant. Overloaded employees may miss deadlines or leave the organization. Underutilized resources reduce profitability. Poor forecasting can lead to missed opportunities or unnecessary hiring.
Resource dashboards help solve these issues by providing a centralized view of capacity, utilization, assignments, and future demand.
What makes a good resource management dashboard?
Not all dashboards provide meaningful insights. The most effective resource management dashboards help managers make decisions rather than simply display data.
Real-time visibility
Resource data changes constantly. New projects are approved, priorities shift, team members take vacation, and clients request additional work.
A good dashboard reflects current conditions rather than outdated reports. Managers should be able to identify capacity issues and workload risks immediately.
Capacity and utilization tracking
Utilization and capacity are among the most important resource management metrics.
Effective dashboards show how much capacity is available, how much is already committed, and how utilization levels are changing over time. This helps managers balance productivity with employee well-being.
Forecasting capabilities
Looking only at current resource allocation is not enough.
The best dashboards provide visibility into future demand, upcoming projects, staffing shortages, and capacity risks. Forecasting helps organizations prepare for future resource needs before they become urgent problems.
Actionable staffing insights
Resource dashboards should support staffing decisions.
Managers should be able to identify suitable resources, understand workload impacts, and evaluate staffing alternatives before assigning work.
Cross-project visibility
Most service organizations manage multiple projects simultaneously.
A resource dashboard should provide visibility across all projects rather than focusing on individual initiatives. This helps managers identify conflicts, dependencies, and allocation challenges that may not be visible at the project level.
The 8 most important resource management dashboards
Resource management dashboards help transform resource data into actionable insights. While every organization tracks resources differently, the most effective dashboards focus on utilization, capacity, workload, forecasting, and staffing decisions. Together, these dashboards help managers understand current resource performance, anticipate future demand, and ensure the right people are available when projects need them.
Staff utilization dashboard
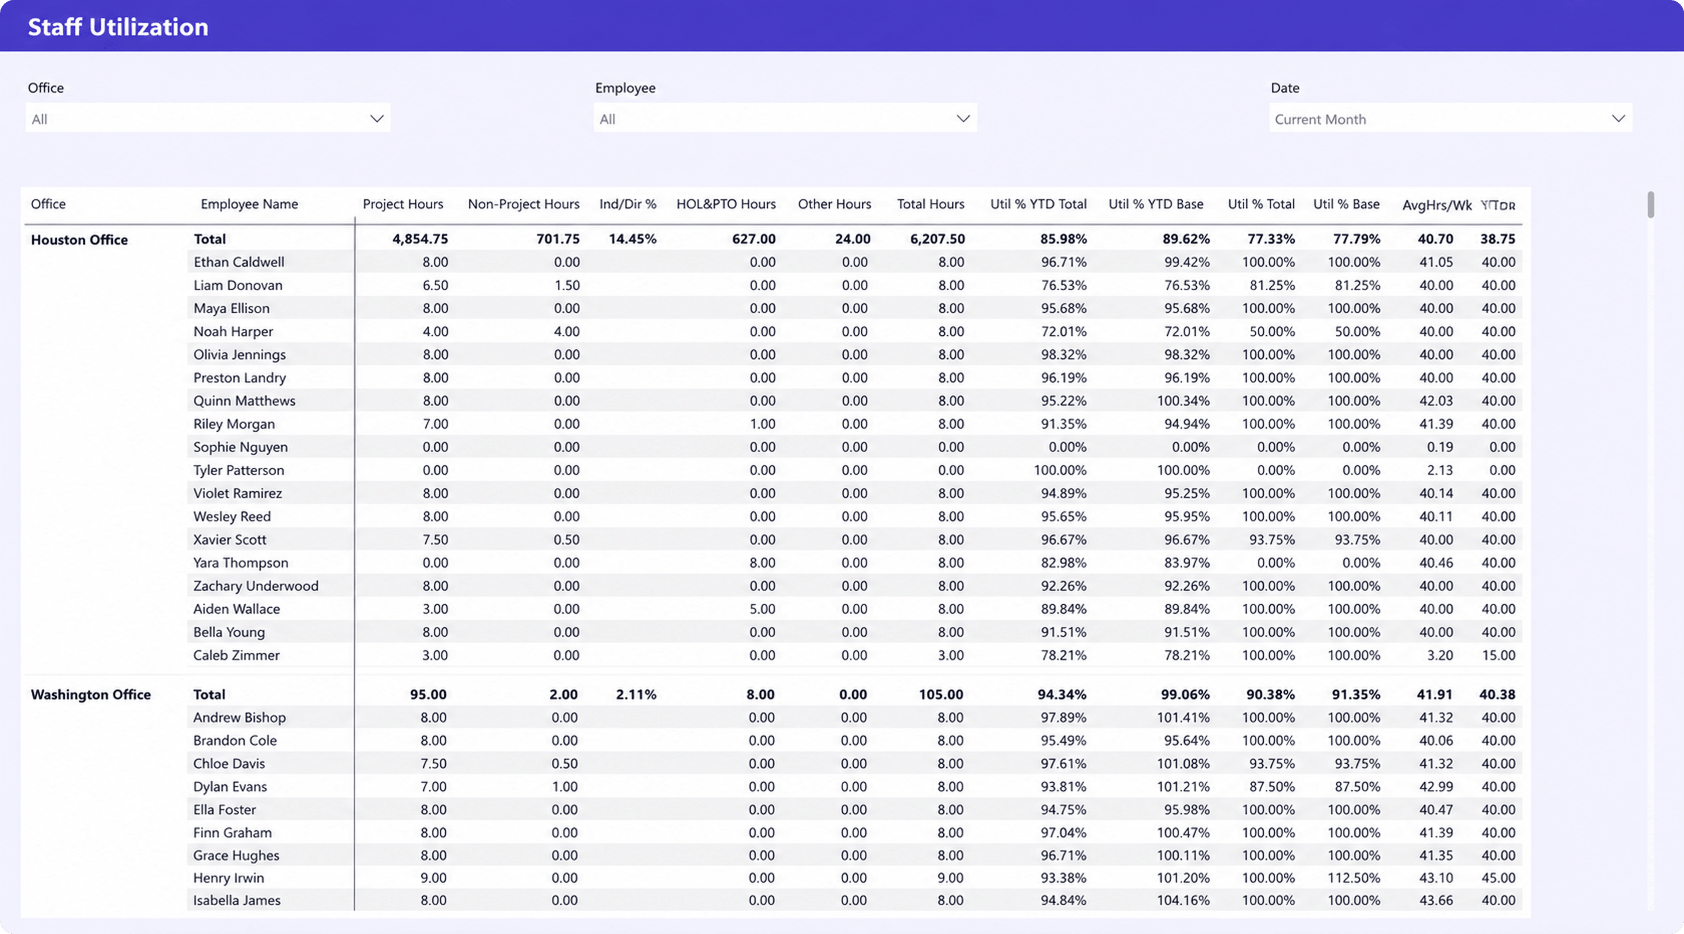
A staff utilization dashboard helps managers understand how effectively employees are spending their available working hours across projects and other activities.
What it shows
- Project and non-project hours
- Holiday and PTO time
- Total hours worked
- Employee and office-level utilization rates
- Year-to-date utilization trends
- Average weekly hours worked
Why it matters
Utilization is one of the most important resource management metrics for service firms because it directly affects both profitability and capacity planning. This dashboard helps managers identify underutilized employees, spot potential burnout risks, and make better staffing decisions based on actual resource availability and workload trends.
Resource utilization dashboard
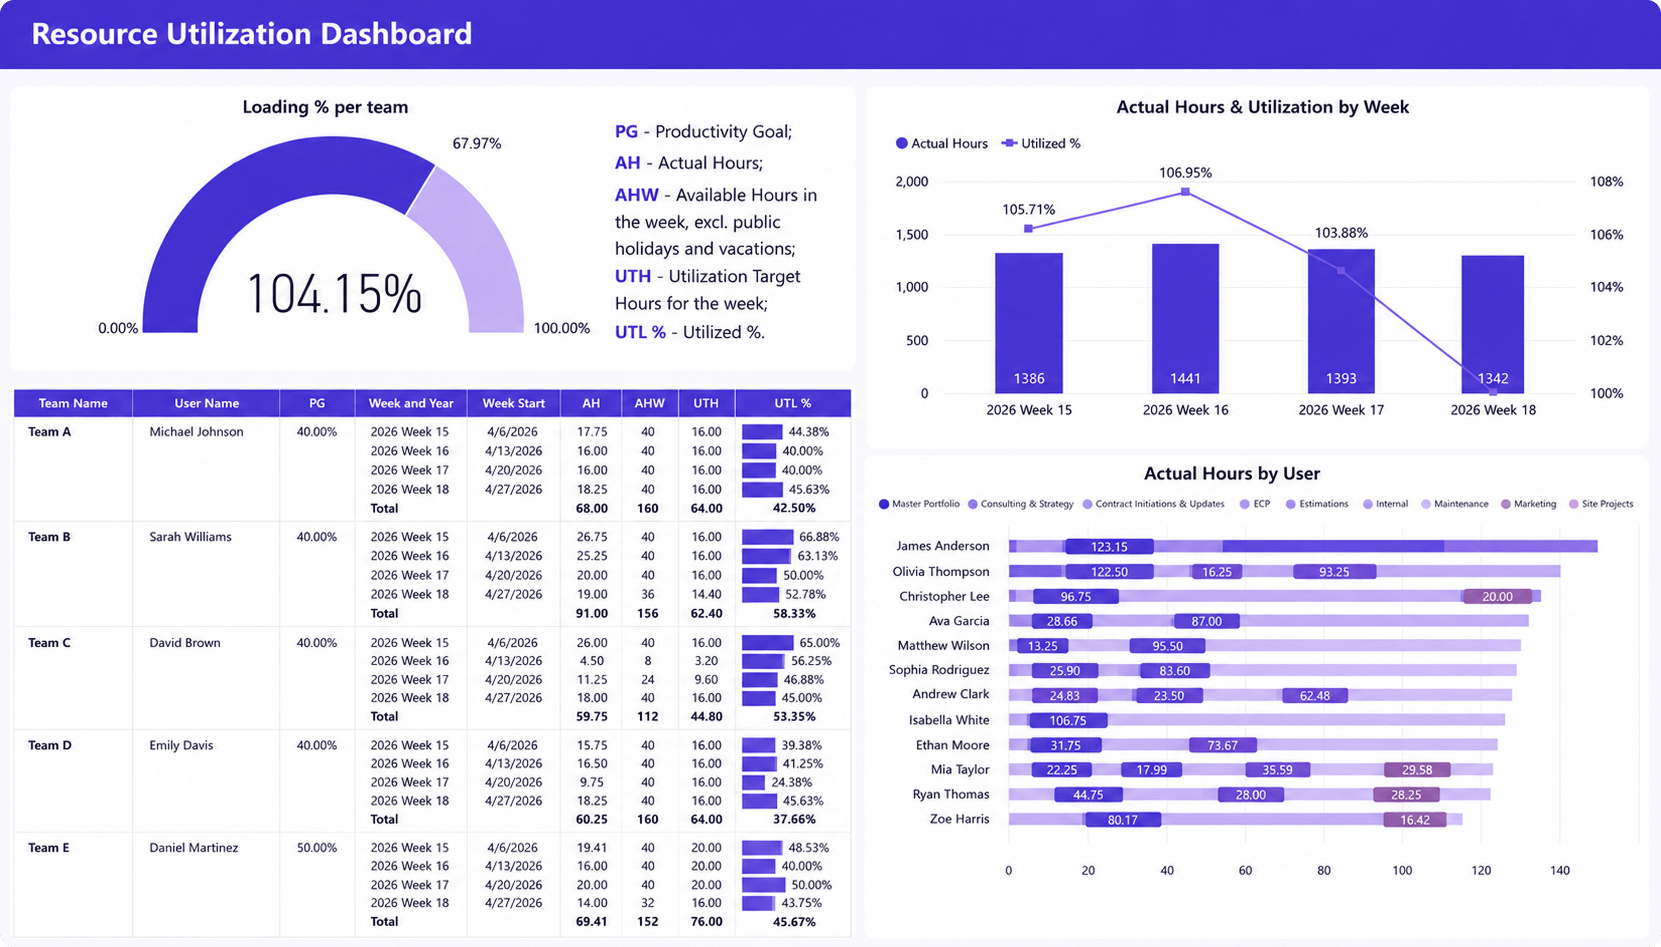
A Resource Utilization Dashboard provides a detailed view of how effectively available resource capacity is being used across teams and individuals.
What it shows
- Team and employee utilization rates
- Actual hours worked versus available hours
- Weekly utilization trends
- Resource loading percentages
- Productivity goals and utilization targets
- Work distribution across projects and portfolios
Why it matters
Resource managers need to understand not only who is busy, but whether resources are being used efficiently. This dashboard helps identify underutilized capacity, overloaded teams, and utilization trends that may affect future staffing decisions. By comparing available hours, actual hours, and utilization targets, organizations can improve workforce planning and maintain a healthier balance between productivity and workload.
Labor projections dashboard
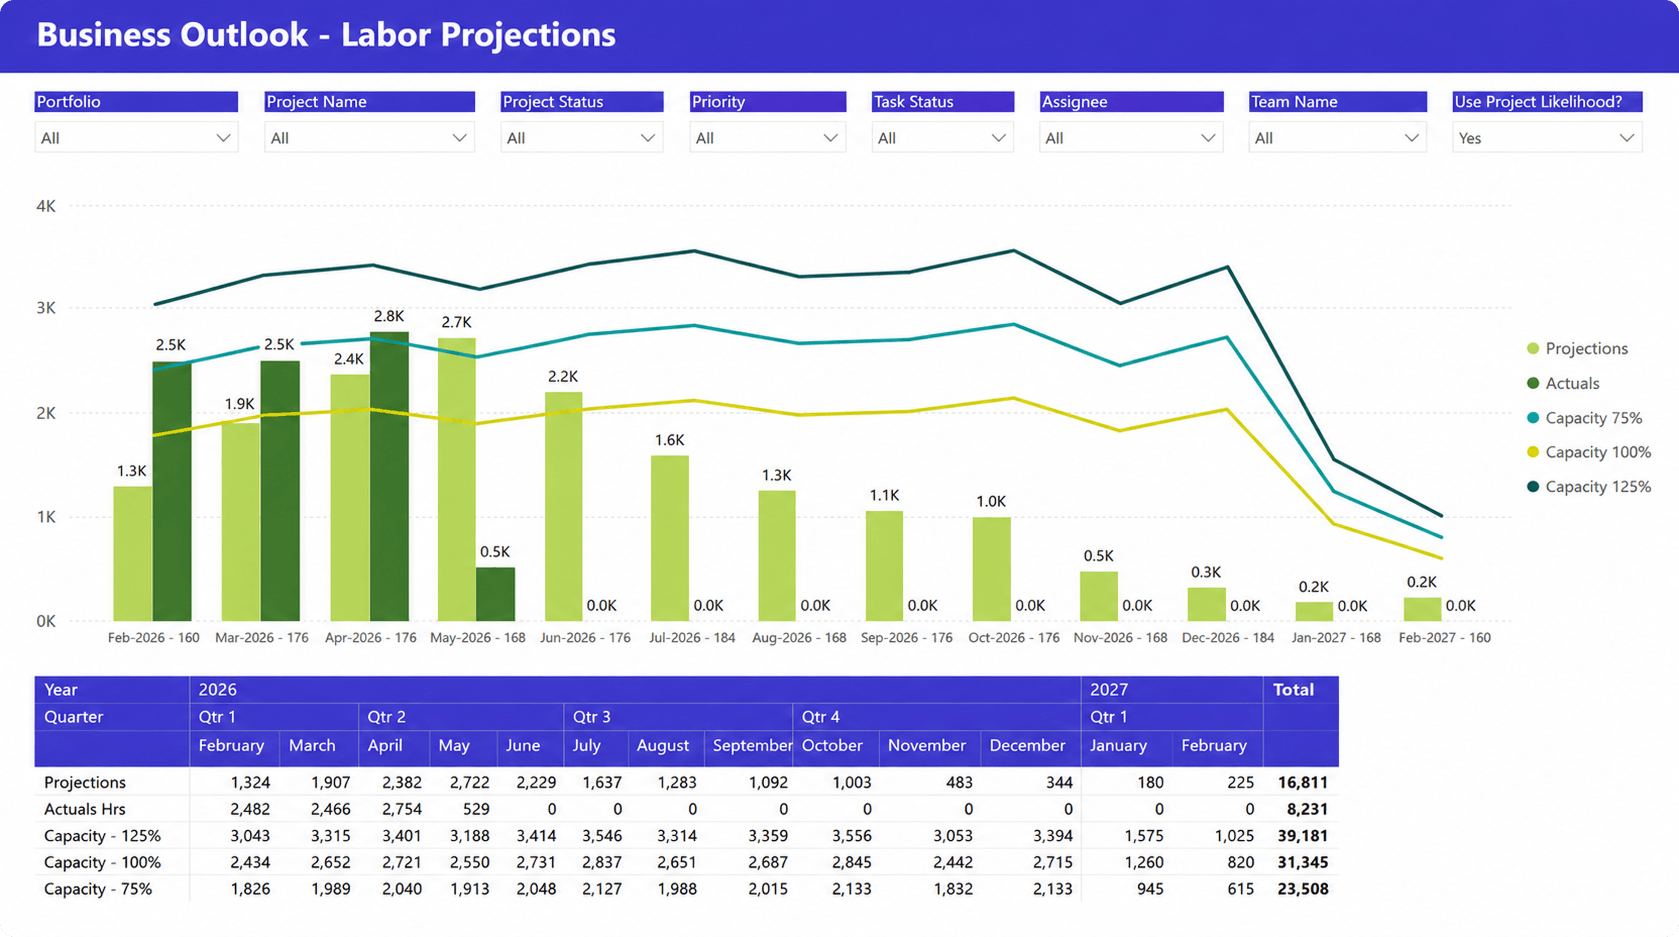
The labor projections dashboard helps organizations compare future resource demand against available capacity to identify staffing risks and planning opportunities.
What it shows
- Forecasted labor demand and projected hours
- Actual versus planned labor utilization
- Available resource capacity
- Capacity thresholds and utilization scenarios
- Workforce demand trends over time
- Future staffing gaps and surpluses
Why it matters
Resource managers need visibility into future workload, not just current assignments. This dashboard helps teams anticipate capacity shortages, identify periods of excess availability, and make more informed hiring, staffing, and resource allocation decisions. By comparing projected demand against available capacity, organizations can improve forecasting accuracy and reduce the risk of both overstaffing and resource shortages.
Overtime & balance hours tracking

An Overtime & Balance Hours Tracking dashboard helps managers monitor overtime trends and understand how actual workloads compare to planned resource capacity over time.
What it shows
- Monthly capacity and working hours
- Actual hours worked by employee
- Vacation, leave, and time-off hours
- Overtime hours and overtime balances
- Redeemed overtime time
- Remaining overtime by resource
Why it matters
When overtime starts increasing across teams, it often signals workload imbalances, staffing shortages, or capacity constraints. This dashboard helps managers identify these issues early, allowing them to rebalance assignments, adjust staffing plans, and reduce the risk of employee burnout. It also provides valuable insight into whether available capacity is being managed sustainably over the long term.
Workforce capacity forecast

A Workforce Capacity Forecast dashboard helps managers track resource capacity trends over time and understand how workforce availability may change in the future.
What it shows
- Full-time equivalent (FTE) capacity by team
- Workforce trends across future periods
- Capacity changes by department
- Available staffing levels over time
- Team-level resource forecasts
- Long-term workforce planning data
Why it matters
Resource planning requires visibility beyond current workloads. This dashboard helps managers identify future capacity constraints, understand workforce trends, and anticipate staffing needs before they affect project delivery. By monitoring capacity across teams and departments, organizations can make more informed hiring, allocation, and workforce planning decisions.
Capacity 360° (Allocations)
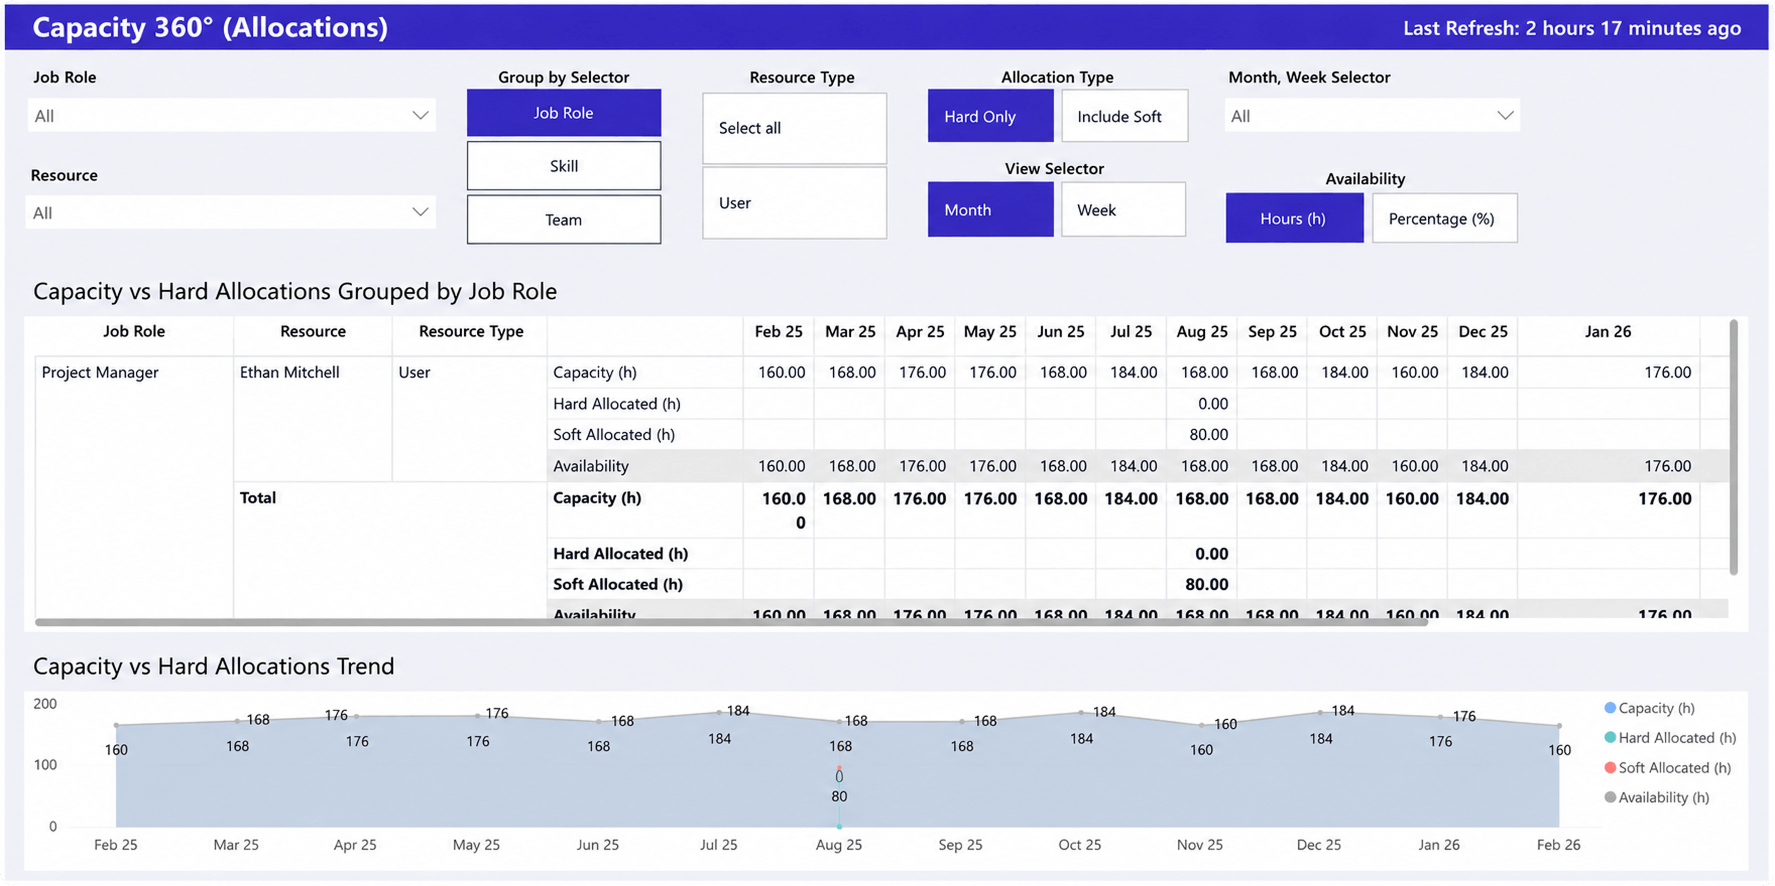
A Capacity 360° (Allocations) dashboard gives resource managers a complete view of resource capacity, allocations, and availability across teams, skills, roles, and individuals.
What it shows
- Resource capacity and availability
- Hard and soft allocations
- Capacity versus allocated hours
- Resource availability trends over time
- Capacity by role, skill, team, or individual
- Future allocation and staffing requirements
Why it matters
Balancing resource demand against available capacity is one of the biggest challenges for service organizations. This dashboard helps managers identify overallocated resources, uncover available capacity, and evaluate future staffing needs before they become delivery risks. By combining capacity, allocation, and availability data in a single view, it supports more informed resource planning and allocation decisions.
Demand projections dashboard
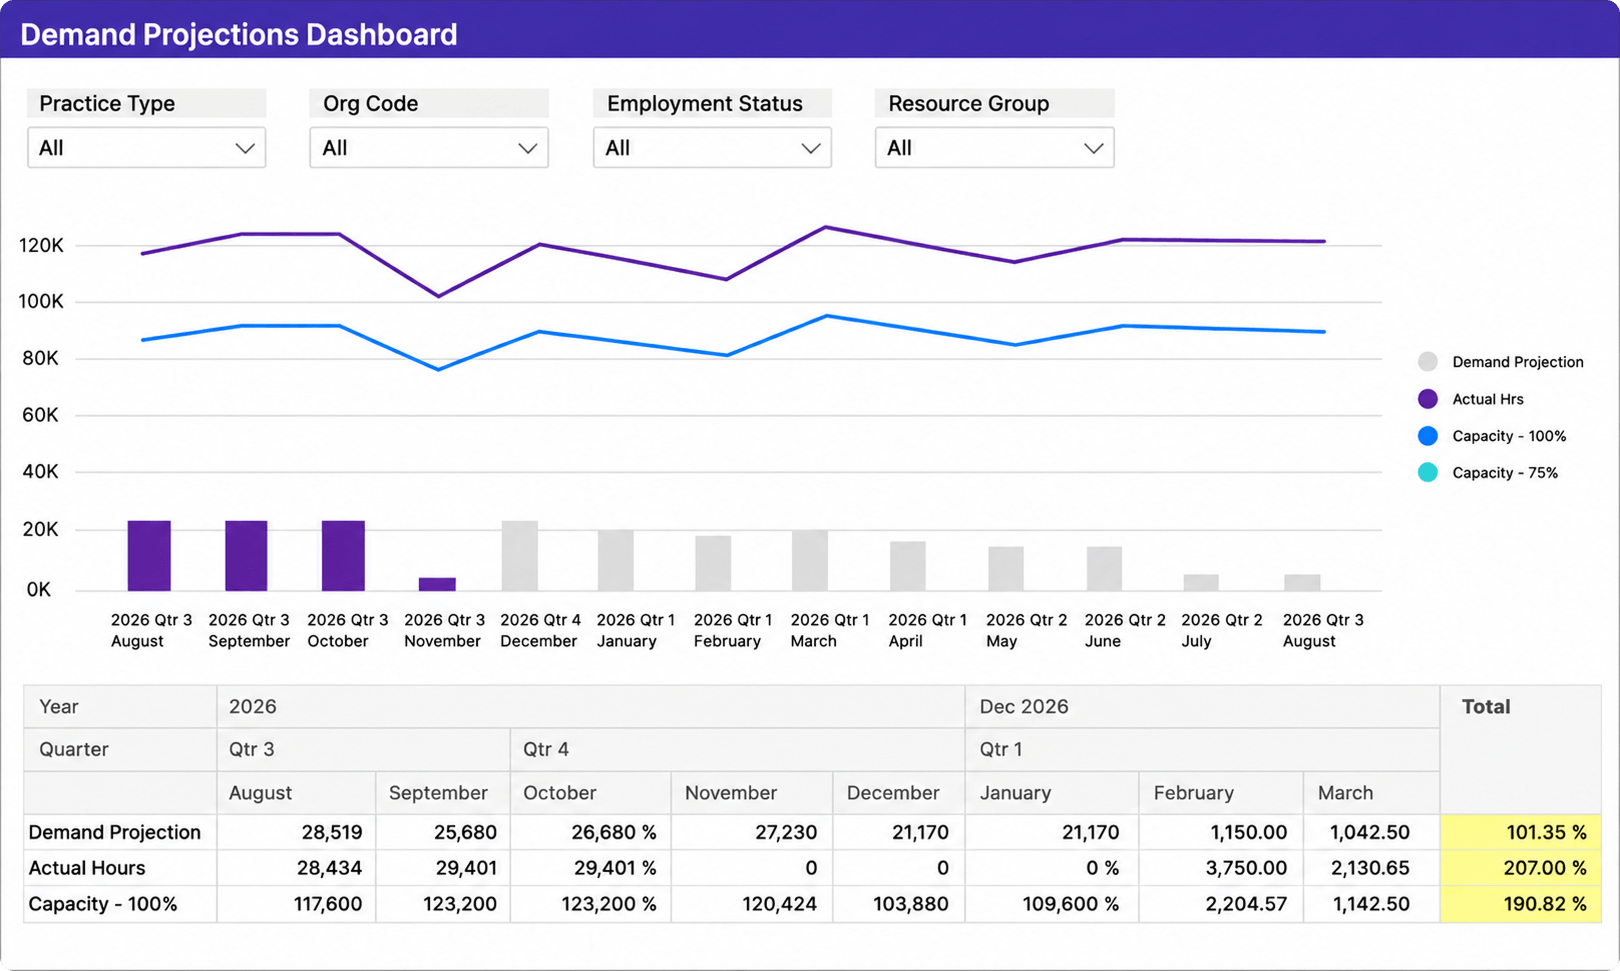
A Demand Projections Dashboard helps organizations compare future resource demand against available capacity to support workforce planning and staffing decisions.
What it shows
- Forecasted demand for future periods
- Actual versus projected workload
- Available resource capacity
- Capacity utilization scenarios
- Demand trends across teams and resource groups
- Potential capacity gaps and shortages
Why it matters
Understanding future demand is essential for effective resource planning. This dashboard helps managers anticipate staffing needs, identify capacity shortfalls, and make proactive hiring or allocation decisions before delivery issues arise. It also improves forecasting accuracy by showing how projected demand aligns with available resource capacity over time.
Capacity planning dashboards
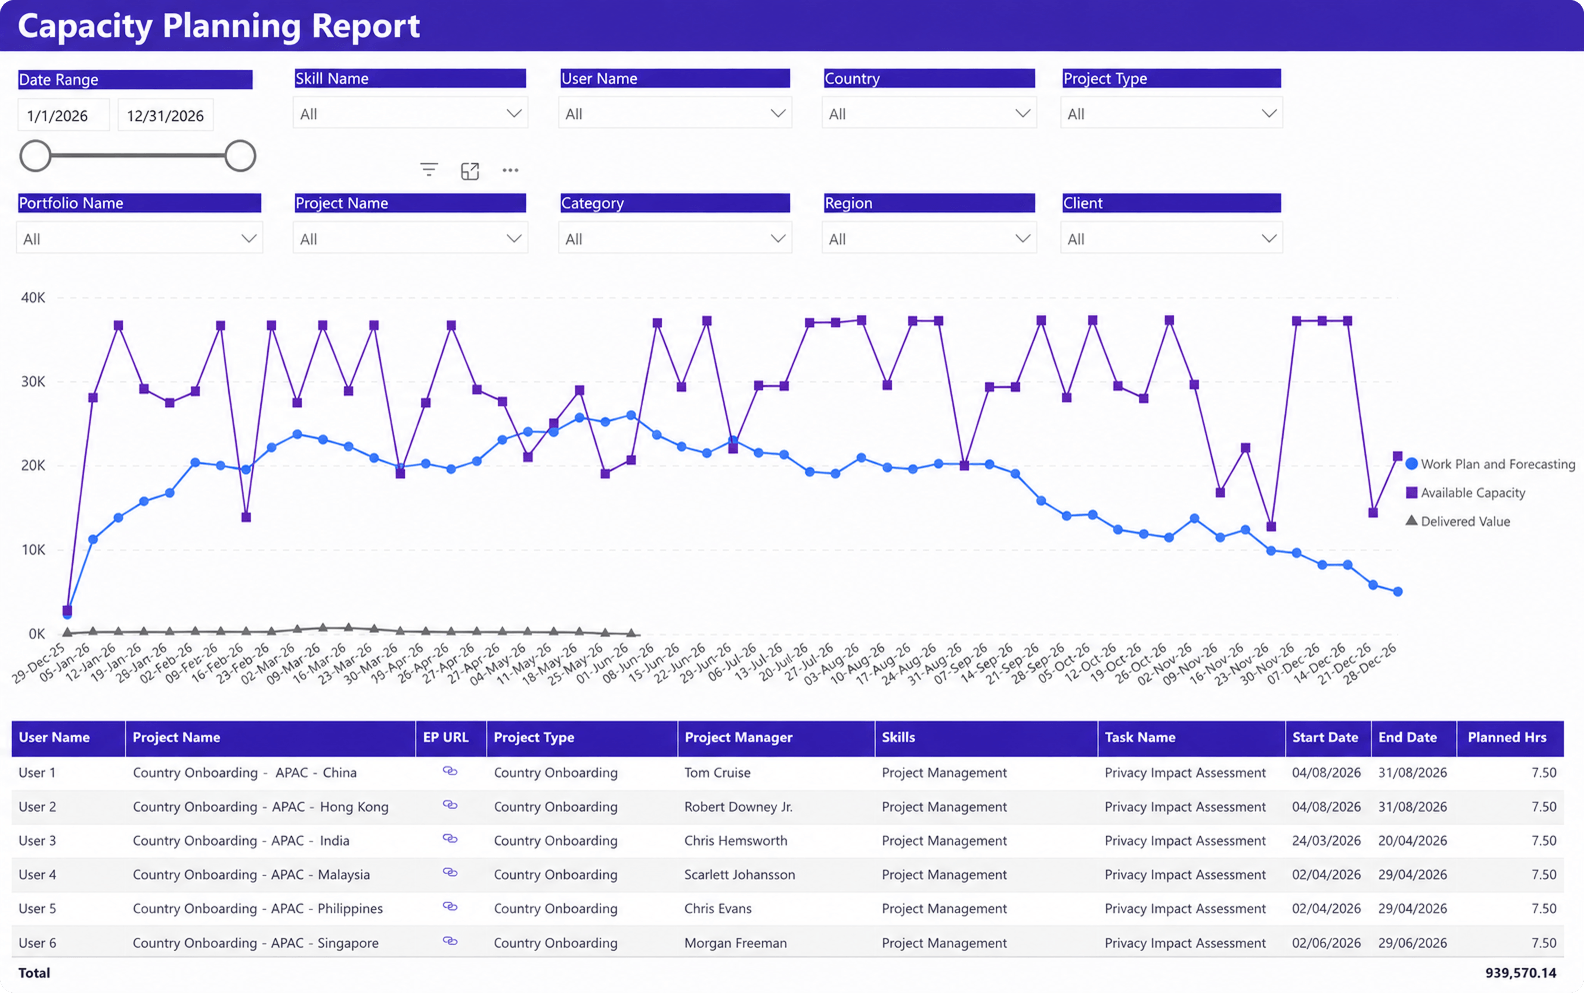
A Capacity Planning dashboard helps organizations compare resource demand against available capacity to ensure teams have the right skills and availability to support future work.
What it shows
- Available capacity versus planned work
- Resource demand trends over time
- Planned hours by project and resource
- Skills and role availability
- Project assignments and upcoming workload
- Resource utilization across future periods
Why it matters
Capacity planning is essential for avoiding both resource shortages and excess capacity. This dashboard gives managers visibility into future workload requirements, helping them identify staffing gaps, allocate resources more effectively, and make proactive hiring or assignment decisions. It also helps ensure that the right skills are available when projects need them, reducing delivery risks and improving resource utilization.
The most important resource management KPIs
The value of a resource management dashboard depends on the metrics it tracks. While organizations may monitor dozens of resource-related indicators, a small group of KPIs typically provides the clearest picture of resource performance, capacity health, and staffing effectiveness.
- Billable utilization measures the percentage of available working time spent on billable activities. For many service firms, it is one of the strongest indicators of productivity and profitability. Consistently low utilization may signal excess capacity, while extremely high utilization can indicate workload pressure and limited flexibility for new projects.
- Capacity utilization tracks how much available resource capacity is currently being used. It helps managers determine whether teams can take on additional work or are approaching their workload limits. Monitoring this KPI helps prevent both underutilization and overallocation.
- Resource availability shows how much capacity remains unassigned and available for future work. Looking several weeks or months ahead helps managers identify upcoming staffing opportunities and potential resource shortages before they affect project delivery.
- Forecast accuracy compares projected resource demand with actual workload requirements. Large gaps between forecasts and actual demand often indicate that project estimates, sales forecasts, or resource plans need adjustment.
- Bench utilization measures how effectively unassigned resources are being used. High bench levels can indicate delayed project starts, inaccurate forecasting, or opportunities to improve resource allocation and workforce planning.
- Staffing fulfillment rate measures how successfully resource requests are matched with available people and skills. Low fulfillment rates may reveal capacity constraints, skill shortages, or growing demand in specific areas of the business.
- Allocation accuracy compares planned assignments with actual resource usage. Significant differences between planned and actual allocations can lead to forecasting issues, scheduling conflicts, and inefficient resource utilization.
Rather than viewing these KPIs independently, resource managers should monitor them together. Changes in utilization, availability, forecasting accuracy, and staffing fulfillment often reveal emerging capacity risks long before they impact project delivery or profitability. More on the KPIs services firms track.
Why resource planning often breaks down
Many service firms understand the importance of resource management but still struggle to execute it effectively.
Resources are tracked in spreadsheets
Spreadsheets can work for small teams, but they become difficult to maintain as organizations grow. Manual updates, version control issues, and limited visibility often result in inaccurate resource data.
Project and resource data are disconnected
In many organizations, project information, resource plans, and time tracking data exist in separate systems. This fragmentation makes it difficult to understand actual capacity, utilization, and future demand.
Forecasts become outdated quickly
Resource plans can change daily. Without automated updates, forecasts quickly become inaccurate, reducing their usefulness for staffing and hiring decisions.
Managers lack visibility across projects
Resource managers often need visibility across dozens or even hundreds of active projects. When information is scattered across teams and departments, identifying resource conflicts becomes extremely difficult.
Staffing decisions are reactive
Many organizations only address staffing problems after they appear. By the time managers recognize a capacity shortage, project delivery may already be affected.
How resource dashboards improve utilization and planning
Resource management dashboards help organizations move from reactive planning to proactive decision-making.
Better workload balancing
Managers can identify overloaded employees and underutilized resources before workload problems affect delivery performance. Balanced workloads improve productivity while reducing burnout risk.
Improved staffing decisions
Resource dashboards provide visibility into availability, skills, and future commitments. This helps managers assign the right people to the right projects.
Earlier identification of capacity risks
Capacity shortages often develop gradually. Resource dashboards help managers identify risks early enough to take corrective action before projects are affected.
More accurate forecasting
Forecasting improves when resource, project, and utilization data are connected. Organizations gain greater confidence in hiring, staffing, and growth decisions.
Higher utilization without overloading teams
The goal of resource management is not to maximize utilization at all costs. Effective dashboards help organizations increase utilization while maintaining sustainable workloads and employee well-being.
How resource managers can use dashboard data to take action
Resource dashboards are most valuable when they help managers make decisions, not just monitor performance. By recognizing patterns in utilization, capacity, and forecasting data, resource managers can address potential issues before they affect project delivery or profitability.
If utilization is too low
Low utilization often indicates that available capacity is not being fully used. Managers can review upcoming project demand, identify resources that could support other teams, or adjust staffing plans to improve resource efficiency. Persistent underutilization may also signal forecasting inaccuracies or a slowdown in demand.
If utilization is too high
Consistently high utilization can be a warning sign of resource strain. Managers should review workload distribution, rebalance assignments where possible, and evaluate whether additional staffing or contractors are needed. Taking action early helps reduce burnout risk and maintain delivery quality.
If future capacity is constrained
When forecasting dashboards show upcoming capacity shortages, organizations have more time to respond. Managers can adjust project schedules, prioritize work, reallocate resources between teams, or begin hiring and recruiting efforts before shortages impact delivery commitments.
If resource demand exceeds available skills
Capacity alone does not guarantee successful staffing. A team may have available hours but lack the specific expertise required for upcoming projects. Skills and staffing dashboards can help identify capability gaps early, giving organizations time to train employees, hire specialists, or adjust resource plans.
If forecast accuracy starts to decline
Large differences between projected and actual demand often indicate issues with project estimates, sales forecasts, or resource planning assumptions. Reviewing forecasting inputs regularly helps improve planning accuracy and reduces unexpected staffing challenges.
If overtime continues to increase
Rising overtime levels often signal workload imbalances or insufficient capacity. Managers should investigate whether work can be redistributed, priorities adjusted, or additional resources added. Addressing overtime trends early can improve employee well-being while reducing long-term staffing risks.
The goal is not to optimize a single metric in isolation. Effective resource management comes from balancing utilization, capacity, availability, skills, and future demand to ensure teams can deliver work efficiently without becoming overloaded.
FAQ: resource management dashboards
What is a resource management dashboard?
A resource management dashboard is a reporting tool that provides visibility into resource utilization, capacity, availability, workload, and staffing needs. It helps managers make better resource allocation and planning decisions.
What metrics should resource managers track?
The most important metrics typically include billable utilization, capacity utilization, resource availability, forecast accuracy, staffing fulfillment rate, bench utilization, and allocation accuracy.
How do dashboards improve utilization?
Dashboards improve utilization by helping managers identify underutilized resources, workload imbalances, staffing gaps, and future demand changes. This allows organizations to make more informed allocation decisions.
How do resource dashboards support capacity planning?
Capacity planning dashboards compare available resources against forecasted demand. This helps managers identify future staffing shortages, hiring needs, and allocation risks before they affect project delivery.
What data should be included in a resource management dashboard?
A resource management dashboard should include resource allocations, capacity information, utilization metrics, project assignments, availability data, workload information, time tracking data, and forecasting metrics.