The difference between organizations that thrive and those that struggle often comes down to one thing: the quality of information driving their decisions. When portfolio managers have access to accurate, timely data consolidated into clear, actionable insights through business intelligence (BI) reports, they can make confident decisions that drive real results. Without it, they’re essentially flying blind, relying on gut instincts and outdated information to make million-dollar choices.
The decision-making challenges BI reports help solve
Sarah stared at the spreadsheet that had consumed her morning. It‘s a maze of project statuses, budget figures, and resource allocations spread across seventeen different tabs. As the portfolio manager for a growing tech company, she knew somewhere in this data lay the answer to a critical question: Should they continue funding the project, or redirect those resources to the AI initiative that seemed to be gaining momentum?
This scenario plays out in boardrooms and project offices worldwide every day. Portfolio-level decisions are inherently complex because they involve juggling multiple projects, competing priorities, and finite resources. Here are only a few examples of the challenges faced by portfolio managers every day.
The visibility problem
This lack of visibility across projects and programs is more than just an inconvenience. It’s a strategic blind spot that can derail entire portfolios. When decision-makers can’t see the full picture, they make isolated decisions that might optimize one project while inadvertently hampering three others.
Missing the early warning signs
The most painful portfolio failures rarely happen overnight. They’re usually the result of small issues that compound over time – trends that were invisible until it was too late to course-correct effectively. Without the ability to spot patterns early, portfolio managers find themselves constantly in reactive mode, addressing crises instead of preventing them.
The comparison trap
When projects operate in isolation, it becomes nearly impossible to gauge whether performance issues are unique problems requiring immediate intervention or simply normal growing pains. Without the ability to compare performance between projects, portfolio managers often make inconsistent decisions, applying different standards to similar situations or missing opportunities to replicate successful approaches across multiple initiatives.
The data time trap
Perhaps most critically, many portfolio decisions are still made based on outdated or incomplete data. By the time information filters up through traditional reporting channels, market conditions may have shifted, resource availability may have changed, and the decision that made sense last week could be completely wrong today.
Key BI report types that transform portfolio decisions
The foundation of effective portfolio management lies in having the right information at the right time. While every organization’s needs are unique, certain types of BI reports consistently prove their worth in driving better portfolio decisions. These reports transform raw project data into strategic insights, helping portfolio managers spot opportunities, identify risks, and allocate resources with confidence.
- Performance Dashboards – Real-time visibility into portfolio health through key project portfolio metrics like project progress, milestone completion rates, and overall portfolio status. These dashboards serve as mission control for portfolio managers, providing immediate answers to critical questions about which projects are thriving and which need attention.
- Resource Utilization Reports – Detailed analysis of how people, skills, and assets are allocated across the portfolio. These reports reveal over-allocation patterns that lead to burnout, under-utilization that represents missed opportunities, and resource conflicts that create bottlenecks between competing projects.
- Financial Reports – Comprehensive budget vs. actuals analysis across all portfolio projects, revealing spending patterns, cost overrun trends, and opportunities for resource reallocation. These reports ensure financial accountability while identifying projects that consistently deliver value within budget constraints.
- Risk and Issue Reports – Aggregated view of potential blockers, dependencies, and challenges across the entire portfolio. By consolidating risks from individual projects, these reports help identify systemic issues and prioritize mitigation efforts where they’ll have the greatest portfolio-wide impact.
- Forecasting Reports – Forward-looking analysis that projects future resource needs, timeline requirements, and budget implications based on current performance trends. These reports enable proactive decision-making by revealing potential challenges and opportunities before they become critical.
📚 Read more: Executive reporting for project portfolios
Practical tips for turning BI reports into better decisions
Tip #1: Look for patterns, not just pictures
The human brain is naturally wired to focus on the latest data point – the project that went red this week, the budget variance that just appeared. But portfolio success comes from understanding trends over time. Successful portfolio managers train themselves to ask: “Is this an anomaly or part of a pattern? What does this trend tell us about our portfolio health?”
Tip #2: Compare and learn
One of the most powerful uses of BI reports is comparative analysis. By comparing similar projects, those with comparable scope, technology stack, or team composition, portfolio managers can identify best practices worth replicating and common bottlenecks worth addressing systematically.
Tip #3: Align resources with reality
Many organizations have beautifully prioritized project lists that bear little resemblance to their actual resource allocation. BI reports reveal these disconnects by showing where time, budget, and talent are actually being invested versus where strategic priorities suggest they should be directed. This visibility enables portfolio managers to make deliberate choices about resource distribution, ensuring that high-priority initiatives receive the support they need to succeed while lower-priority work doesn’t consume disproportionate resources.
Tip #4: Build early warning systems
The most valuable BI reports predict what’s likely to happen next. Successful portfolio managers identify leading indicators (early signs of trouble) rather than just lagging indicators (confirmation that trouble has already arrived).
Tip #5: Connect the dots
Financial performance and operational performance are two sides of the same coin. The best portfolio decisions come from understanding how budget variances relate to resource allocation, how timeline delays impact revenue projections, and how strategic priorities should influence resource distribution.
Setting up BI reports for portfolios in Birdview
One of the most powerful ways to gain clarity on your entire project portfolio is through Birdview‘s Portfolio 360 BI report. This dashboard brings multiple data points together, giving portfolio managers a single place to monitor health, spot risks, and track performance trends.
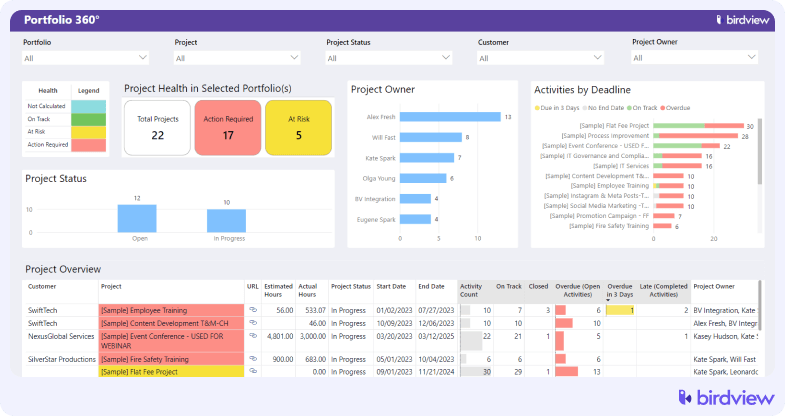
Key information you get from the Portfolio 360 report
- Portfolio health at a glance: A color-coded summary instantly reveals how many projects are on track, at risk, or require immediate action. You might see 43 active projects with 30 requiring action and 3 flagged as high risk, giving you immediate focus areas.
- Project status breakdown: Visual distribution across open, in-progress, completed, on-hold, and pending stages helps you understand organizational throughput and identify pipeline bottlenecks.
- Ownership insights: Project owner rankings by current workload often reveal surprising patterns, like high-performing leads inadvertently creating bottlenecks while other capable managers have untapped capacity.
- Deadline-driven activities: Clear visibility into tasks and milestones that are due soon, overdue, or lacking deadlines entirely transforms reactive crisis management into proactive portfolio stewardship.
- Detailed project overview: A comprehensive table showing customer, status, dates, estimated vs. actual hours, activity counts, and overdue items eliminates the need to jump between multiple systems.
“By having all of our business systems and information integrated into one enterprise system source of truth, we can leverage powerful business analytics through custom Power BI reports.” – Erika Brown, Director of Project Assurance and Controls at Hatch LTK
📚 Read more: Project portfolio dashboards: what to include and why?
How data transforms decision-making
The Portfolio 360 report serves as mission control for your entire project ecosystem, consolidating multiple data streams into one comprehensive view that transforms time-consuming detective work into immediate, actionable insights. When portfolio managers have this level of visibility, decision-making shifts from guesswork to strategy:
- Prioritization becomes strategic
High percentages of projects requiring immediate action help leadership deploy additional resources where they’ll have maximum impact.
- Workload balancing becomes proactive
Ownership insights help redistribute tasks before capacity issues become performance problems.
- Risk management becomes preventive
Overdue and “due soon” indicators enable early intervention, preventing schedule delays from cascading into client dissatisfaction.
- Performance tracking reveals patterns
Projects that consistently exceed time or budget estimates become visible, highlighting opportunities for process improvements and more accurate estimation practices.
The strategic impact of BI reports in Birdview
What makes the Portfolio 360 report truly transformative isn’t just the data it presents, but how it delivers that data. As a single, continuously updated source of truth, it eliminates version control nightmares and data inconsistencies that plague traditional reporting approaches.
The time savings alone justify the investment. Hours previously spent on manual report preparation are reclaimed for strategic thinking and proactive problem-solving. But the real value lies in the fundamental shift from reactive portfolio management to strategic portfolio leadership, moving from constantly putting out fires to preventing them from starting in the first place.
“Working with Birdview‘s BI team has been a huge value add. We feel like we have been able to grow alongside Birdview for an overall win-win relationship.” – Jeff Baltz, Vice President at C-P Systems
Conclusion: from data to decisions
Sarah, the portfolio manager we met at the beginning, now starts her mornings differently. Instead of wrestling with seventeen spreadsheet tabs, she opens her Birdview dashboard and immediately sees the health of her entire portfolio. The AI initiative’s accelerating progress is obvious. Project Phoenix’s resource constraints are clearly displayed alongside recommended actions. And most importantly, she can see the trends that will shape next quarter’s decisions.
BI reports are only as valuable as the actions they inspire. The organizations that get the most value from business intelligence create cultures where data-driven insights lead to timely, informed action.
The key is establishing an ongoing cycle: review the data, analyze the patterns, adjust your approach, and measure the results. Portfolio success is about having relevant information when you need it, in a format that drives confident decision-making.