

Too often, leaders are left sifting through inconsistent updates, buried spreadsheets, or overly detailed status reports that don’t answer the fundamental questions: Where are we headed? What’s off track? What decisions need to be made right now?
Project portfolio reporting filters out the noise, connects execution to strategy, and provides decision-makers with the visibility they need to lead with confidence. In this guide, we’ll break down what effective executive reporting looks like and how to create reports that support real, timely decisions.
What is project portfolio reporting?
Project portfolio reporting is the practice of collecting, organizing, and presenting data from multiple projects to give a consolidated view of performance, risks, resources, and financials across the organization. Portfolio reporting examines the broader landscape, considering how all ongoing initiatives work together to support strategic objectives.
Think of it as your leadership dashboard. It doesn’t show the details of every moving part but gives you the altitude to see where the organization is headed and what might be in the way.
Effective portfolio reporting combines data from projects, resources, finances, risks, milestones, and strategic initiatives into a single decision-making view for leadership.

Why project portfolio reporting matters
Good portfolio reporting gives executives and PMO leaders the clarity they need to manage performance, reduce risk, and make better decisions across the entire project portfolio. Instead of reacting to problems after they appear, leaders can use portfolio reports to identify issues early and act with confidence.
Strategic alignment
Helps leaders see whether active projects support business priorities and whether resources are focused on the right initiatives.
Portfolio visibility
Provides a consolidated view of project status, progress, risks, resources, and financial performance across the organization.
Risk detection
Flags at-risk projects, delays, budget issues, and resource constraints before they derail portfolio performance.
Smarter investment decisions
Helps executives compare initiatives, identify low-value work, and prioritize projects that deliver stronger business outcomes.
Resource planning
Shows whether teams have enough capacity to deliver planned work and where resource adjustments may be needed.
Executive confidence
Creates transparency and trust by giving leadership consistent, accurate, and decision-ready portfolio data.
Without consistent portfolio reporting, leadership can end up making decisions based on outdated data, scattered updates, or gut instinct. A clear reporting structure helps teams stay aligned, prioritize effectively, and manage the portfolio with greater confidence.
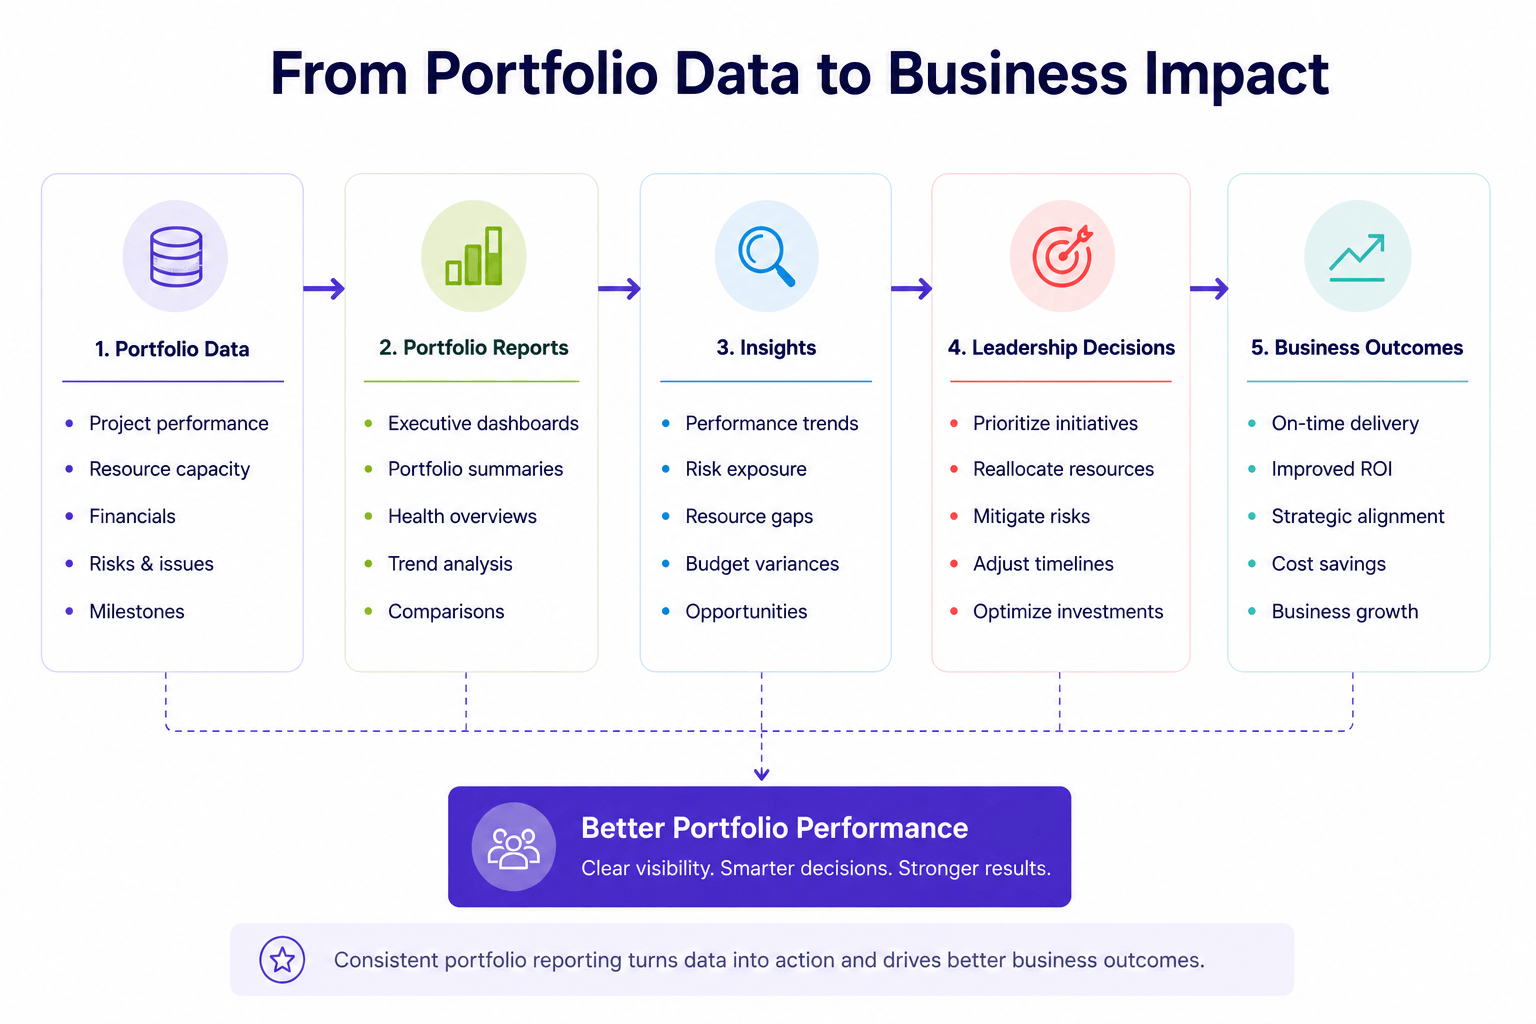
Project portfolio reporting is valuable only when it supports better decisions. The process below illustrates how organizations transform portfolio data into actionable insights that improve planning, prioritization, and overall portfolio performance.
What executives want to see
Executives don’t need every detail. They need decision-ready information. The most effective reports for leadership are focused, visual, and aligned with the bigger picture.
Here’s what usually matters most to them:
- Strategic alignment: Are projects moving the business forward? Are we investing in the right initiatives?
- Overall portfolio health: Where are we succeeding, and where are we seeing delays, overruns, or risks?
- Resource allocation: Are critical teams overburdened? Do we have the capacity to deliver?
- Budget performance: Are we staying within budget? Are any projects at risk of overspending?
- Key risks and issues: What could impact delivery? What requires immediate leadership attention?
- Milestone visibility: Are major milestones on track? Will delays in one project affect others?
What leaders value most is clarity. Clear summaries, consistent visuals, and well-structured insights help them act quickly and with confidence.
Executive project portfolio reporting KPIs
Executive portfolio reports should focus on the metrics that help leaders understand performance, risk, resources, and business impact. The table below summarizes the most important KPIs to include in a project portfolio report.
| KPI | What it shows | Why it matters | Executive question answered |
|---|---|---|---|
| Portfolio Health | Overall status across active projects | Shows which projects are on track, at risk, or off track | Where does the portfolio need attention? |
| Strategic Alignment | How projects support business objectives | Helps leaders prioritize initiatives that create the most value | Are we investing in the right work? |
| Budget Performance | Budget vs. actual costs across projects | Identifies cost overruns and financial risk early | Are we staying within budget? |
| Project ROI | Return generated by portfolio investments | Connects project performance to business value | Which initiatives deliver the strongest return? |
| Resource Capacity | Available capacity versus project demand | Shows whether teams can realistically deliver planned work | Do we have enough capacity? |
| Resource Utilization | How effectively people are being used | Highlights overuse, underuse, and workload imbalance | Are resources being used efficiently? |
| Risk Exposure | Portfolio-level risks, issues, and severity | Helps leaders act before risks affect delivery or financial outcomes | Which risks require executive action? |
| Schedule Performance | Progress against planned timelines | Identifies delays, dependencies, and timeline risks | Are key initiatives on schedule? |
| Milestone Status | Progress of major portfolio milestones | Keeps leadership focused on critical delivery points | Will major commitments be met? |
| Forecast Accuracy | Accuracy of cost, timeline, and resource forecasts | Improves planning confidence and decision quality | Can we trust our forecasts? |
| Client or Department Performance | Performance by client, portfolio, department, or business unit | Helps compare outcomes and identify strong or underperforming areas | Where are results strongest or weakest? |
Common types of project portfolio reports with examples
Not all reports support executive decision-making equally. Leaders don’t need task lists. They need a clear, high-level view of portfolio performance, risks, and business impact.
Below are key report types, all that can be created with a proper portfolio management software, that deliver meaningful insights, each with a specific purpose, and together offering a well-rounded picture of your entire project landscape.
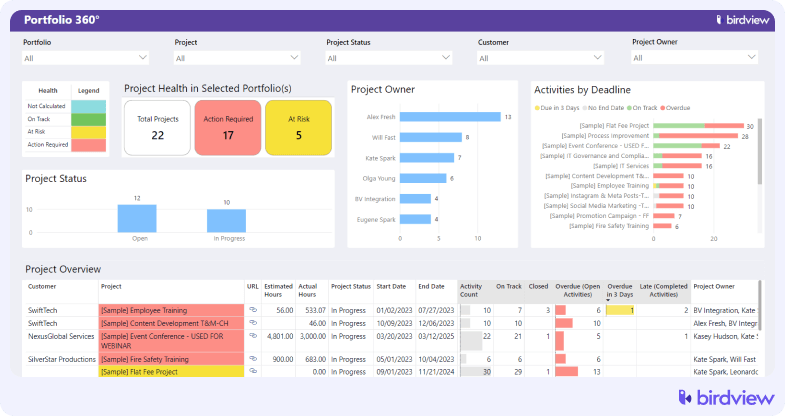
Portfolio 360° Dashboard
The Portfolio 360° Dashboard gives leaders a real-time snapshot of all projects: what’s on track, what’s at risk, and who’s responsible. With clear visuals and key metrics, such as deadlines, workloads, and progress versus plan, executives can focus on what matters and act before small issues become big problems.
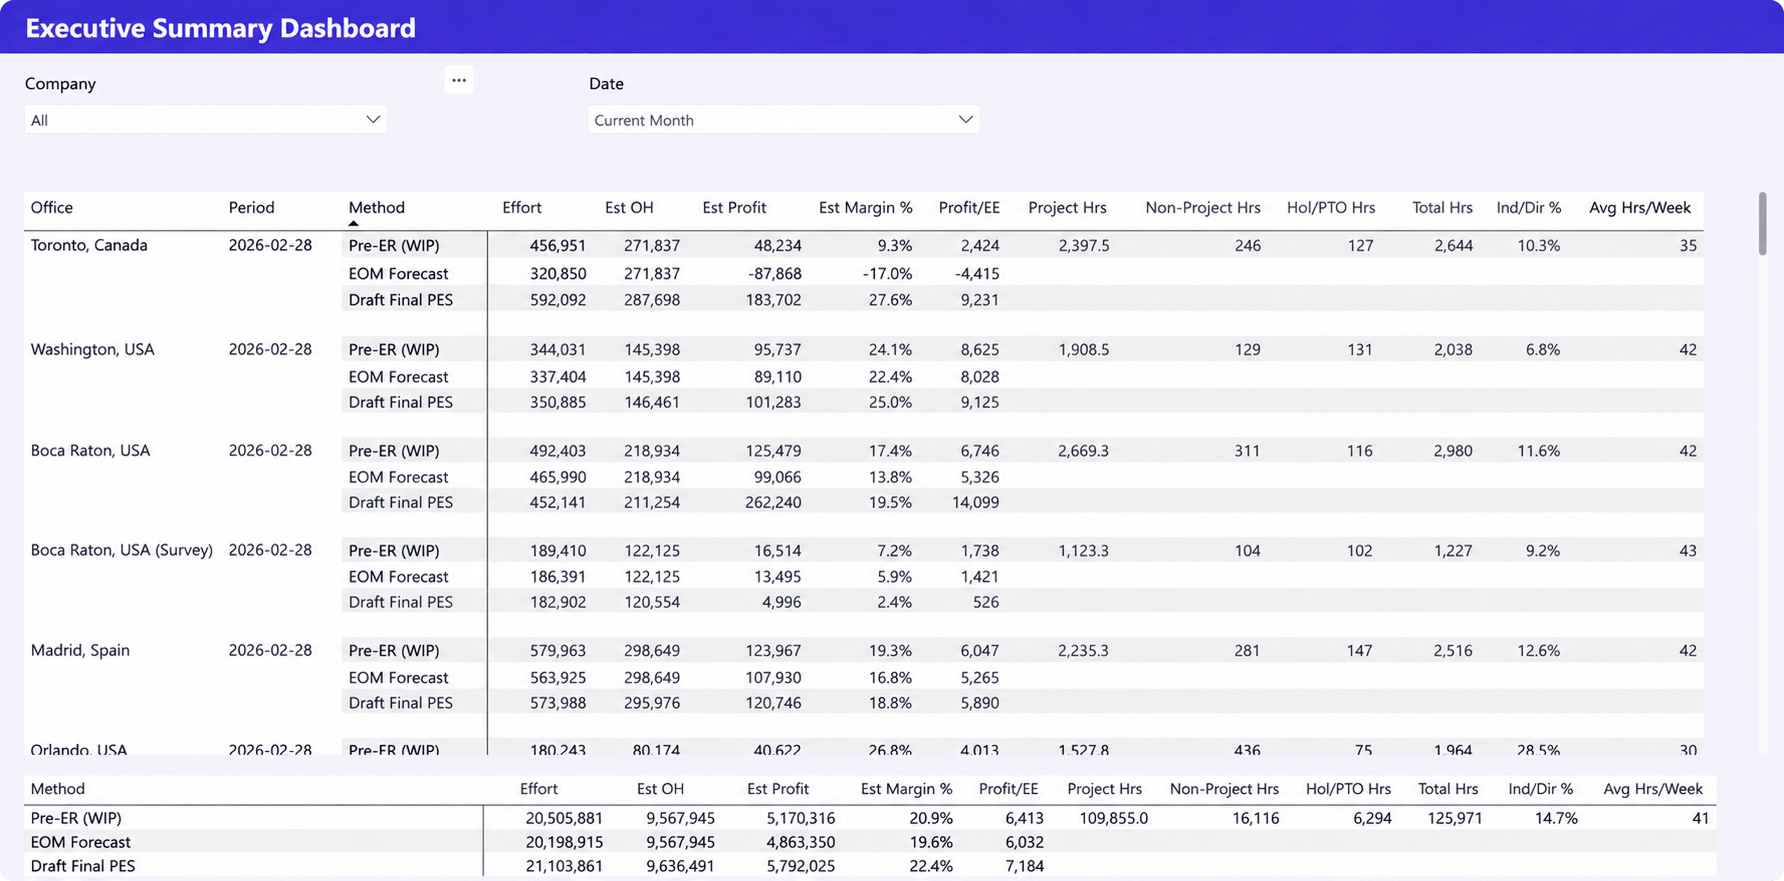
Executive Summary Dashboard
The Executive Summary Dashboard provides leaders with a quick and clear view of a project’s health, including budget, schedule, progress, and resources, all in one place. It’s customizable, focused on key KPIs, and perfect for tracking high-stakes projects without digging into the details. Ideal for steering meetings and quick decisions.
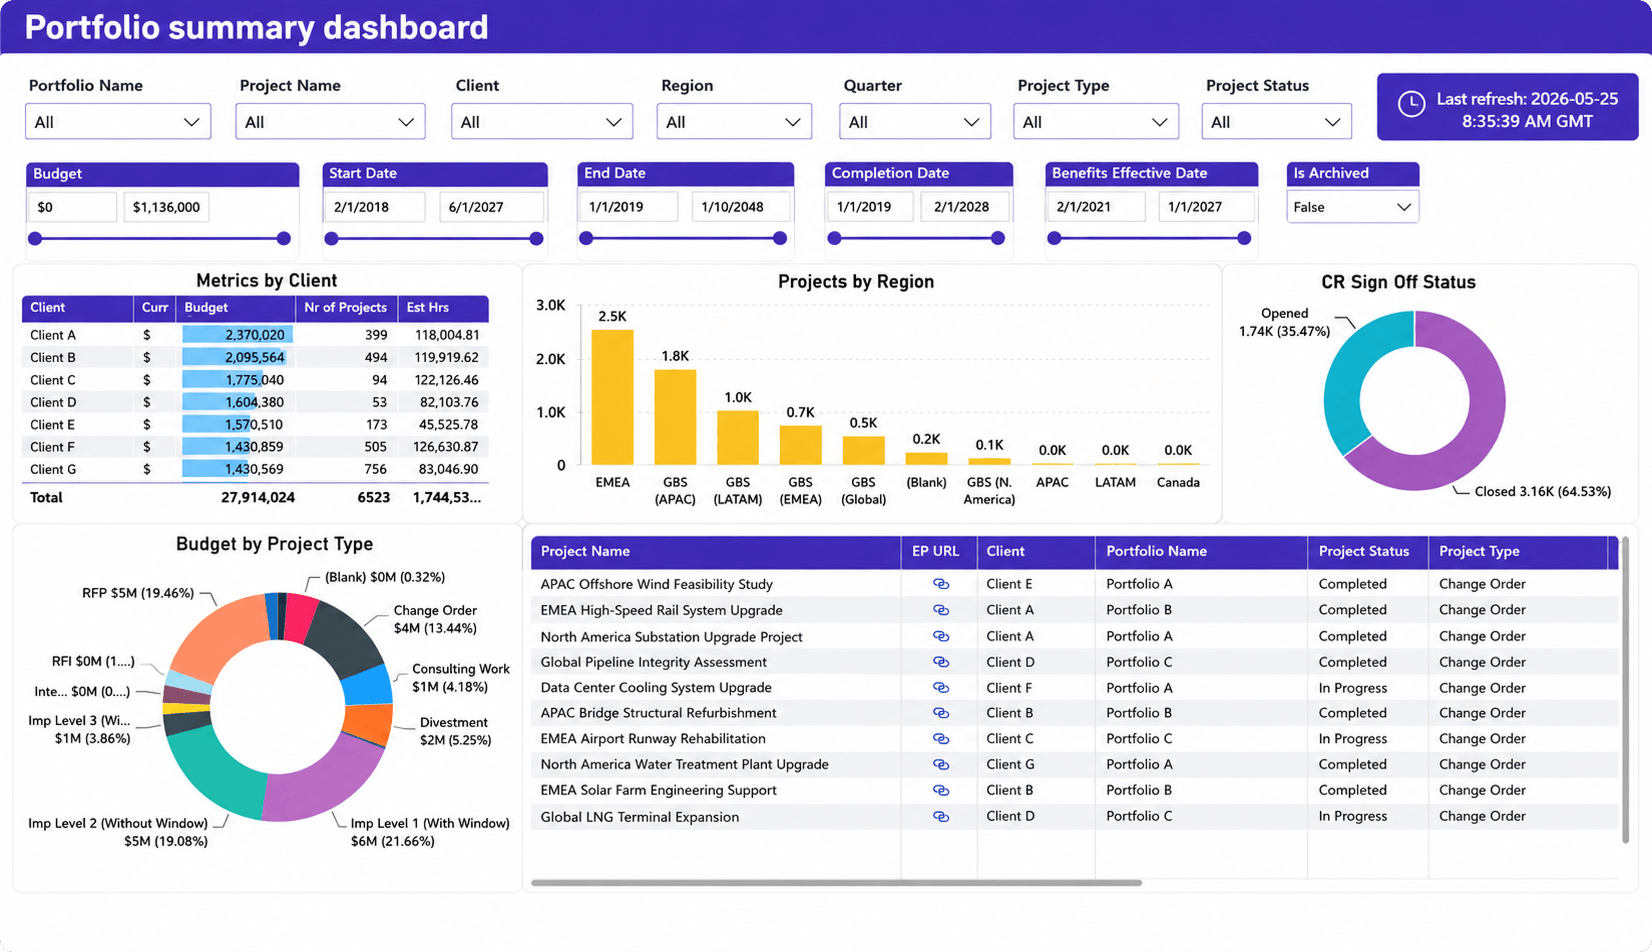
Portfolio summary dashboard
This dashboard provides a high-level overview of portfolio performance, helping executives monitor project status, budgets, timelines, and overall portfolio health from a single view.
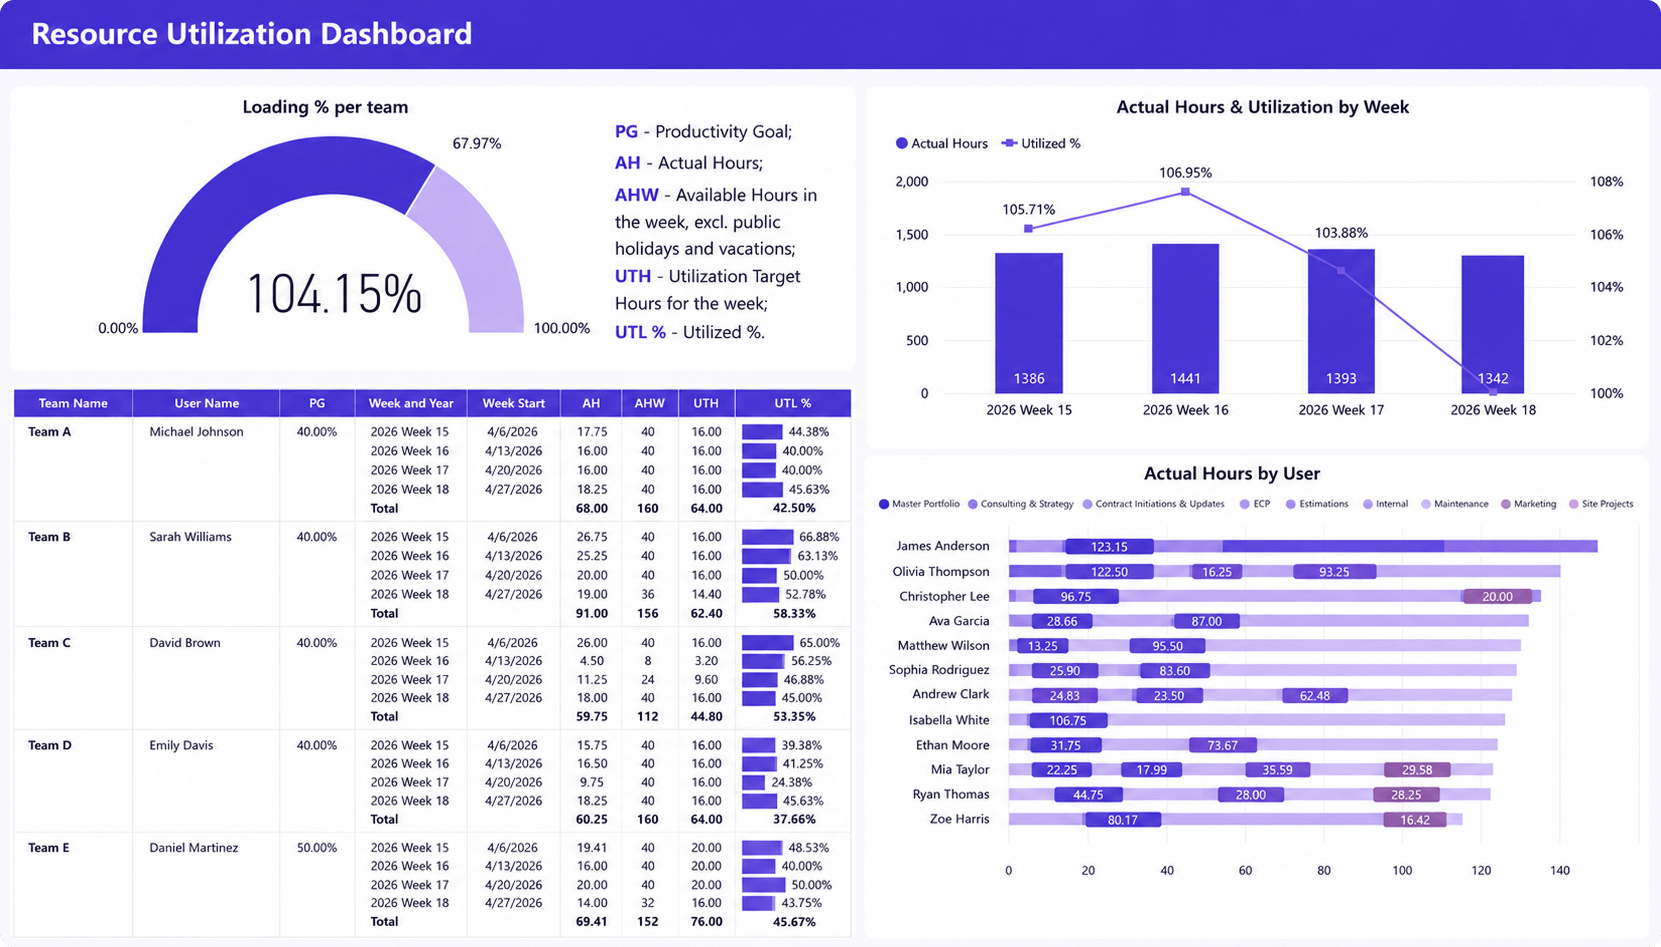
Resource utilization dashboard
The Resource Utilization Report helps leadership evaluate how people and teams are being deployed across projects. By comparing available billable hours with actual time logged, executives gain visibility into workforce efficiency and potential billing gaps. This insight is key for spotting overuse, underuse, or uneven distribution of workload across departments.
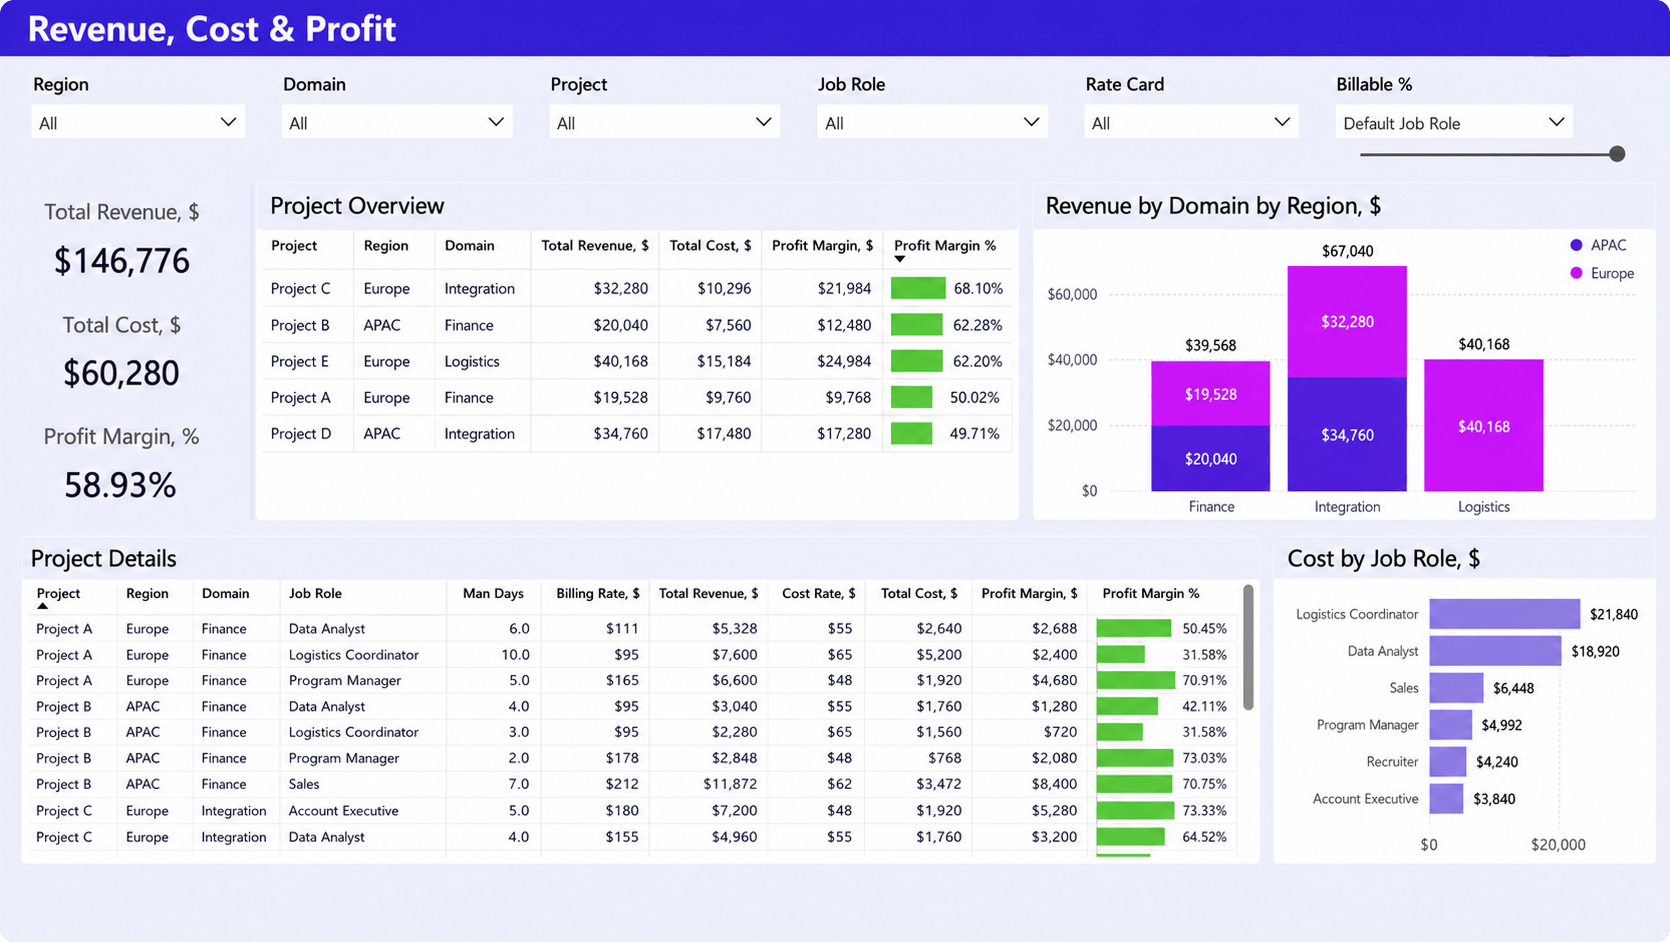
Portfolio Financial Performance Dashboard
This dashboard summarizes portfolio revenue, costs, and profitability, enabling leaders to evaluate financial performance across projects and business units.
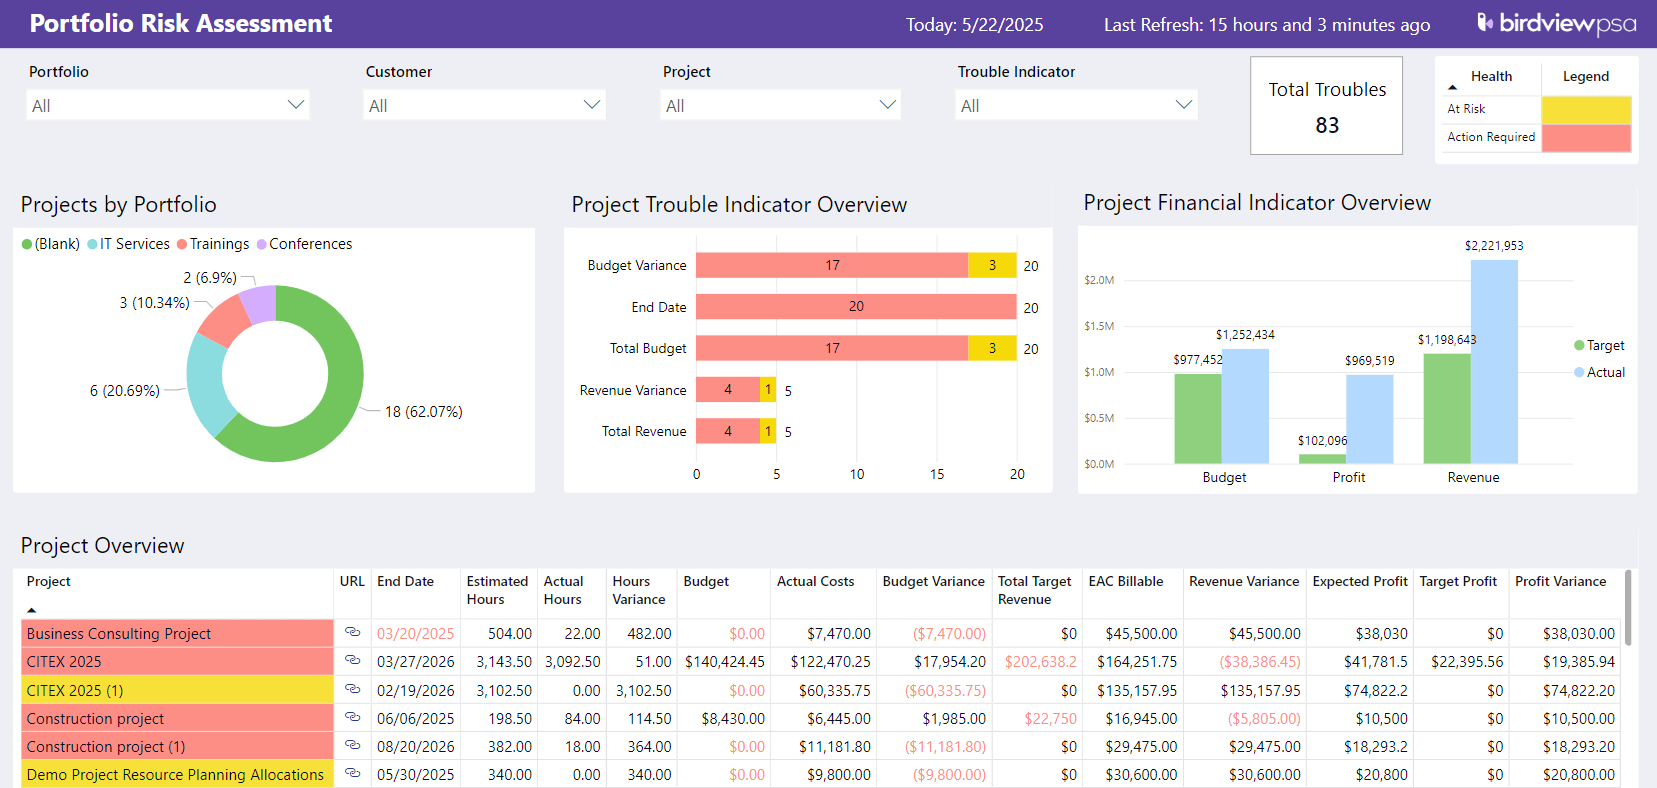
Risk and Issue Register
The Portfolio Risk Assessment Dashboard centralizes the timeline and financial risks across all projects. Executives can use it to quickly identify which portfolios, departments, or customer engagements are driving risk and which specific indicators need attention. It’s especially valuable for CFOs, PMO leads, and operational heads focused on governance and forecasting.
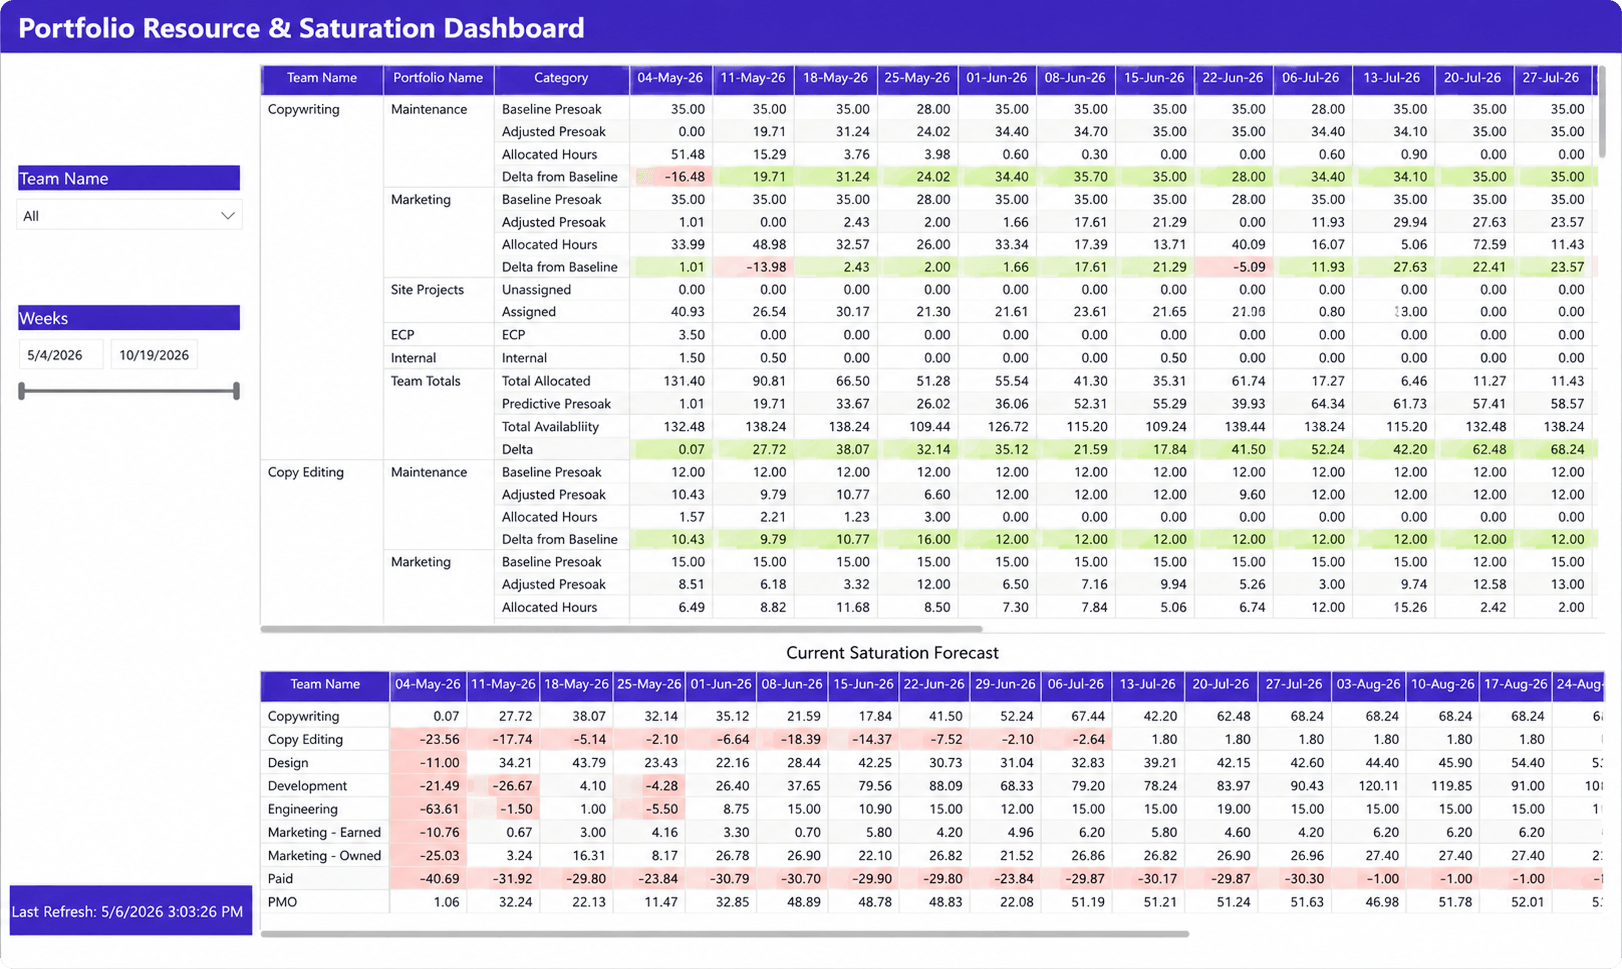
Portfolio Resource Planning Dashboard
This dashboard provides a portfolio-wide view of resource allocation, capacity, and future workload, helping managers identify resource constraints and balance demand across projects.
How to create a project portfolio report: step by step
Creating executive-level reports doesn’t have to be time-consuming or manual. With Birdview PSA’s BI reporting tools, you can build clear, data-driven reports that reflect real-time progress across your entire portfolio. Here’s how to approach the process.
1. Define your reporting goals and audience
Start by identifying who the report is for (executives, department heads, the PMO) and what decisions they need to make. Birdview allows you to tailor reports for different audiences using permission-based access and customizable dashboards.
Ask “Are we reporting on financial performance, resource allocation, or schedule adherence?, “What’s the ideal frequency: weekly, monthly, quarterly?”.
2. Choose the right BI templates or start from scratch
Birdview’s report library gives you access to a wide range of pre-built templates: project status reports, resource utilization, financial roll-ups, time logs, and more. You can use these as-is or customize them using filters, metrics, and visual components.
If you’re building something unique, use the BI reporting builder to create dashboards and reports that reflect your KPIs and structure.
3. Pull data from live sources
Because Birdview reports are built on real-time data from across your portfolio: projects, tasks, financials, time logs, and resources, you don’t need to gather data manually. Simply select your data points, groupings, and dimensions within the BI engine.
This ensures you’re always working with accurate, up-to-date information.
4. Visualize with clarity
Birdview’s BI tools allow you to use charts, graphs, heat maps, tables, and conditional formatting to bring the data to life. This makes it easier for executives to spot trends, risks, and opportunities without digging through raw numbers.
5. Add insight, not just information
While the data speaks for itself, you can enrich each report with contextual notes and executive summaries. Use widgets or text blocks to explain key takeaways, highlight exceptions, or recommend next steps. This transforms reports from passive documents into tools for action.
6. Share reports in the right format
Once your report is ready in Birdview, you have several flexible options for sharing and visibility. Reports can be exported in Excel, PDF, or CSV formats for external distribution or internal documentation. You can also save the report in the Dashboard and share it later.
This approach ensures key stakeholders always have access to the most relevant data, without needing to request updates or navigate through multiple screens.
7. Iterate based on feedback
As your portfolio evolves, your reporting needs will too. Birdview makes it easy to duplicate, adjust, or refine existing reports. Based on stakeholder feedback, you can change filters, tweak KPIs, or reorganize the layout without starting from scratch.
“The integration between Birdview PSA and Power BI empowered BoomData to leverage its existing data analytics skills and generate custom reports. They can now access project information within Birdview PSA, extracting data for in-depth analysis and creating reports for internal and external stakeholders. This flexibility and self-service reporting capability enhance their overall project insights and decision-making.” – Stuart Barnard, Executive Director at BoomData
Further Reading:
Best practices for executive reporting
The most effective reports give leadership a clear line of sight into project performance, risks, and opportunities, without drowning them in operational detail. To get there, the reporting process itself must be consistent, intentional, and aligned with business priorities.
Here are several best practices to help ensure your executive reports are not just informative but genuinely impactful.
Focus on strategic insights, not status updates
Executives don’t need a breakdown of every task or meeting. What they do need is a view of how current efforts support strategic objectives, where the biggest risks lie, and which initiatives are driving value. Your reports should answer key questions: Are we investing in the right projects? Are we on track to meet business goals? Where do we need to shift resources or priorities?
Keep reports visual and digestible
Clear, visual reporting helps cut through complexity. Use dashboards, charts, and color indicators to present trends, exceptions, and high-level summaries. Birdview PSA’s BI reporting tools offer flexible visualization options that make it easier to present data in a way that executives can absorb quickly, especially in time-constrained environments like board meetings or quarterly reviews.
Standardize formatting and metrics
Using consistent formats, terminology, and KPI definitions builds trust in your reports and makes it easier for leadership to compare data over time. Agree on what “at risk” means, how utilization is measured, and what qualifies as a budget overrun. Birdview allows for standardized dashboards that can be shared and reused across departments, helping to enforce this consistency at scale.
Provide context alongside the numbers
Data alone doesn’t always tell the full story. Use executive summaries or annotation widgets to explain why a project is off track or what the potential impact of a budget variance might be. When reports are shared or presented, make space for commentary and discussion. Leadership wants actionable insights, not just raw figures.
Enable collaboration, not just visibility
While reporting gives executives insight, it should also support decisions. Make it easy to discuss, drill down, and ask questions. Use dashboards that can be viewed and filtered based on each executive’s area of focus–whether finance, operations, or client delivery. If a report points to a problem, be prepared to recommend next steps or request guidance directly.
Be selective with what you include
More data doesn’t mean more value. Each report should be curated to reflect what the intended audience needs to see. For example, a CFO may care deeply about revenue variance and margins, while a COO will be more focused on capacity and throughput. Tailor the content of each report or dashboard accordingly–Birdview allows for role-based access and filtering to support this.
Executive portfolio reporting checklist
Before sharing a project portfolio report with executives, make sure it includes the information leaders need to understand portfolio health, risks, resources, financial performance, and next steps.
| Checklist item | What to include | Why it matters |
|---|---|---|
| Portfolio health summary | Overall status, progress, and at-risk projects | Gives leaders a quick view of what needs attention |
| Strategic alignment | Connection between projects and business goals | Shows whether resources are focused on the right initiatives |
| Financial performance | Budget, actuals, costs, revenue, margin, and ROI | Helps executives monitor profitability and budget risk |
| Resource capacity | Availability, workload, utilization, and staffing gaps | Shows whether the organization can realistically deliver planned work |
| Risks and issues | Top risks, blockers, severity, ownership, and mitigation plans | Helps leaders act before risks affect delivery or financial outcomes |
| Milestones and timelines | Key dates, delays, dependencies, and upcoming deadlines | Keeps leadership focused on critical delivery commitments |
| Forecasts | Expected costs, timelines, workload, and delivery outcomes | Supports proactive decisions instead of reactive reporting |
| Executive insights | Key takeaways, exceptions, decisions needed, and recommended actions | Turns the report from a data summary into a decision-making tool |
Give executives and leaders the data they need with Birdview
Strong executive reporting can be the difference between reacting to problems after they happen and anticipating challenges before they surface. When leaders have access to timely, accurate, and relevant data, they can make decisions that keep teams aligned, budgets under control, and strategy on track.
Birdview PSA is built to support this kind of visibility. Its BI reporting tools give you the flexibility to create real-time dashboards, tailored reports, and visual overviews that match how your leadership team thinks and operates. Whether it’s monitoring project health across portfolios, assessing financial performance, or identifying resource bottlenecks, Birdview helps you turn complex data into clear, executive-level insights.