Running a professional services firm isn‘t just about delivering great work–it‘s about staying profitable, keeping teams engaged, and ensuring clients come back. Whether you‘re an experienced leader or just stepping into a management role, tracking the right Key Performance Indicators (KPIs) is crucial for making informed decisions and driving long-term success.
What are the KPIs for consulting professional services firms?
Key Performance Indicators (KPIs) for consulting firms are metrics used to evaluate the effectiveness, efficiency, and overall performance of the consultancy. These indicators provide insights into various aspects of the business and help in assessing the achievement of strategic goals. Here are some common KPIs for consulting firms:
KPIs continue to be an invaluable tool in enabling the tracking of progress in relation to organizational objectives. In the context of professional services, they can also act as a means of predicting profitability, customer satisfaction, employee morale, and more. Here are 6 KPIs for professional services firms that your company should be tracking in 2024:
1. Utilization Rate
Measures the percentage of billable hours compared to total working hours.
The utilization rate is one of the key metrics for a service business. It looks at how much of an employee‘s time is being spent on billable tasks and is expressed as a percentage. For example, if an employee can potentially work 35 hours in a given week and 30 hours have been spent on billable work, their utilization rate would be 85%.
As a general guideline, service companies should aim to achieve a utilization rate of between 85 – 90% to maximize profitability.
To calculate:
Utilization rate = Total billable hours / Total hours available
Beyond tracking billable utilization, it’s important to monitor resource utilization across all activities–both billable and non-billable. This provides a more comprehensive view of how effectively your team‘s time is allocated and whether workloads are distributed efficiently. A balanced utilization strategy ensures revenue generation without overburdening your employees.
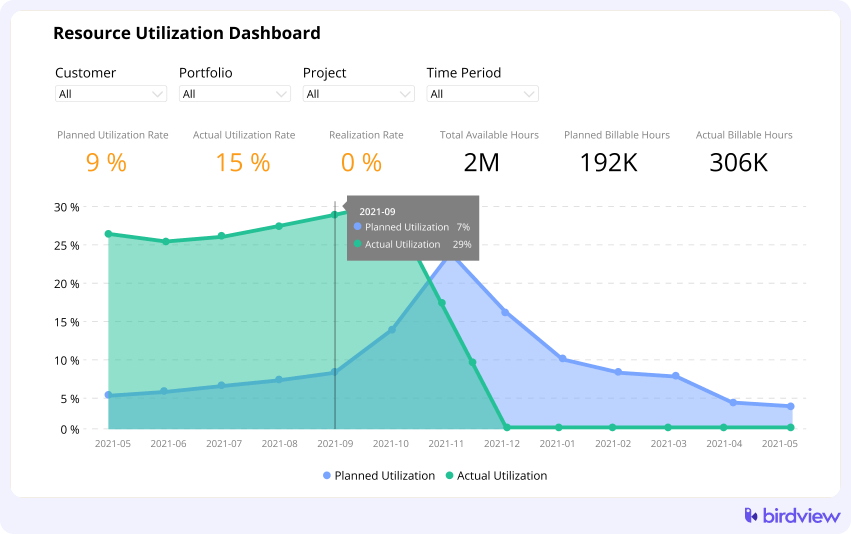
2. Resource Capacity Utilization
Resource Capacity Utilization is a critical metric for organizations seeking to achieve operational excellence. By effectively managing and optimizing the utilization of resources, companies can enhance their overall efficiency, reduce costs, and improve the delivery of products or services.
Resource capacity utilization is a foundational metric for professional services firms. It gives a company a glimpse into how “loaded” or, in some cases, “underloaded” their resources are. It‘s also an essential metric for answering the question, “Can we take on another project”?
To calculate:
Resource capacity utilization = Reported time / Resource Capacity
➡️ Read more: Resource planning software
Get Expert Guidance from Real Leaders
If you want more expert insights into Professional Service Leadership, download our free whitepaper, First 90 Days Blueprint for New Leaders in Professional Services. It‘s packed with real-world advice from experienced leaders who‘ve been in your shoes.
Get your whitepaper now
3. Employee and Client Satisfaction
Employee and client satisfaction rates reflect the quality of service and client relationships. We‘ve all heard the adage that happy employees are productive employees, right? According to a Gallup report, satisfied employees can increase profitability by up to 21%.
There are many ways to measure employee satisfaction. For best results, try implementing 2 or more of these methods:
- Using the Employee Satisfaction Index (ESI)
- Conducting employee surveys
- Using the employee net promoter score (NPS)
- Installing an employee suggestion box
- Having one-on-one meetings
- Using specialized software
Client satisfaction is equally critical. Client Satisfaction reflects the quality of service and client relationships. Net Promoter Scores (NPS) and Client Satisfaction (CSAT) surveys can help gauge how clients view your services and identify potential churn risks.
Share project progress with clients and enable them to evaluate results within a unified platform
4. Profitability of Professional Services industry projects
All service companies strive for profitability. Despite this fact, surprisingly few organizations actually follow through with measuring project-level financials, resulting in uncertainty as to whether the project was actually profitable or not.
Project profitability, in its simplest form, can be calculated by looking at the difference between Project Revenue and Project Costs.
The challenging part is tracking the project-level financials that will give you a clear picture as to how much money was spent versus how much was billed for.
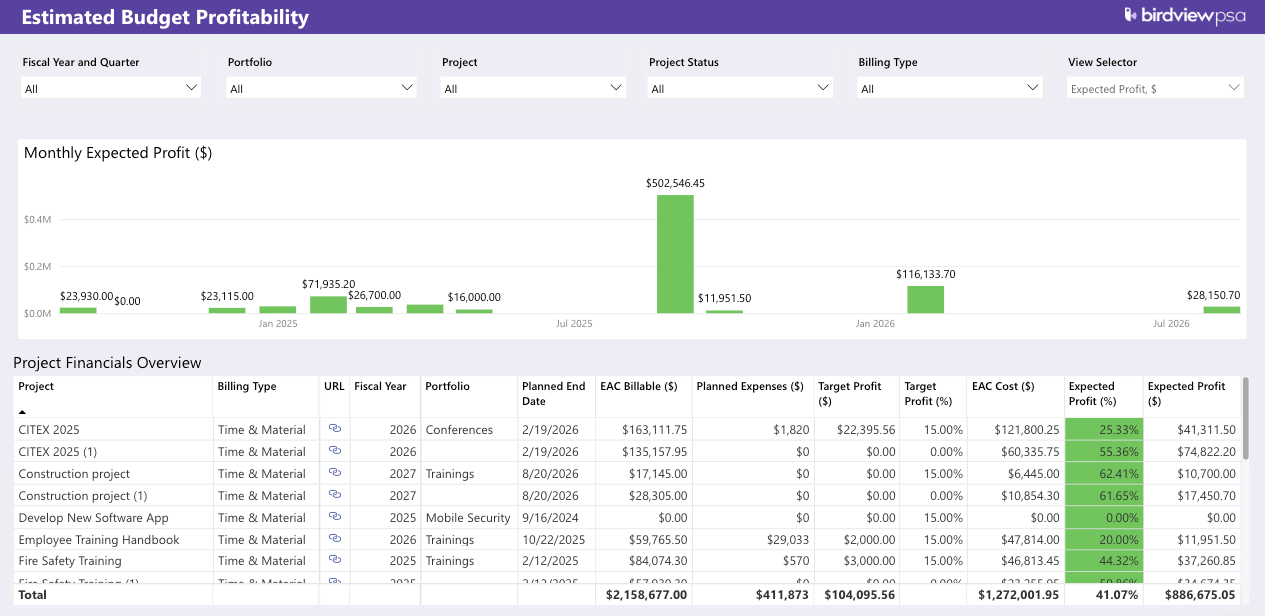
In addition to monitoring gross and net margins, it‘s important to track Annual Recurring Revenue (ARR) and Net Recurring Revenue (NRR). These figures offer insight into long-term financial sustainability and can guide pricing strategies for different service offerings.
To calculate ARR:
ARR = (Total subscription revenue per year + Recurring services revenue) – Discounts and churned revenue
To calculate NRR:
NRR = (Beginning ARR + Expansion ARR – Contraction ARR – Churn ARR) / Beginning ARR × 100
Learn more about project financials in our Ultimate Guide to Project Finances.
5. On-time / Service Delivery
Timely project delivery is a key factor influencing customer satisfaction and loyalty for service companies. Consistently delivering projects on schedule is a strong predictor of repeat business
Methods of measuring OTD (On-time delivery) can vary based on the unique nature of each organization, however, a simple calculation is as follows:
OTD = On-time deliveries / Total deliveries
Beyond simple on-time delivery rates, tracking Time to Launch (TTL) instead of Time to Value (TTV) provides a more realistic measure of success. Clients care most about when they can start using the solution, not just when they first see its value. Keeping TTL on track ensures smooth onboarding and prevents unnecessary project delays.
6. Earned Value
Earned value is a good way to gauge the performance of a project against the original plan (budget and timeline).
There are two key parameters used when completing an Earned Value Analysis (EVA).
- Cost Performance Index (CPI) – shows how well the project is performing relative to its budget.
- Scheduled Performance Index (SPI) – calculates how well the project is performing relative to its timeline.
To calculate:
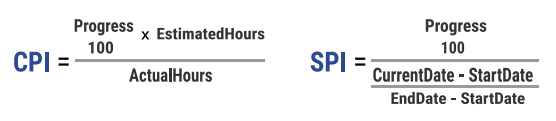
Learn more about completing an Earned Value Analysis: How to Calculate Earned Value Analysis
Keeping track of KPIs for Service Business does not have to be stressful
It can be challenging to keep tabs on KPIs for professional services firms, especially when you already have a mountain of work on your plate. However, tracking KPIs can be made a lot easier by getting organized and leveraging technology to do the heavy lifting for you. The effort will be worth it in the long run!
For new and seasoned Professional Services leaders alike, monitoring key metrics like utilization rates, revenue retention, client satisfaction, and project profitability provides valuable insights into business performance. Establishing clear benchmarks and leveraging data-driven insights ensures strategic alignment and sustainable growth.
Birdview helps service organizations achieve measurable results by providing key metrics at all stages of the service delivery lifecycle. Schedule a personalized demo today to learn more.
Choosing the right KPIs depends on the specific goals and focus areas of the consulting firm. Regularly tracking and analyzing these indicators can provide valuable insights for making informed decisions and driving continuous improvement within the consultancy.