Dashboards
Resource management is an essential part of any organization, as it involves effectively and efficiently managing the available resources such as people, equipment, and finances.
Effective resource management requires careful planning, allocation, and utilization of resources to ensure that projects are completed on time, within budget, and with the desired quality. However, managing resources can be a challenging task, especially in complex projects with multiple stakeholders and limited resources. In such cases, reporting becomes an important aspect of resource management. Reporting allows project managers to keep track of resource utilization, identify potential bottlenecks, and make informed decisions to optimize resource allocation. In this context, this answer explores the importance of reporting in resource management.
A resource management dashboard is used by project managers to monitor and manage the resources assigned to a project. The dashboard typically includes a set of reports that provide an overview of the project’s resource allocation, utilization, and availability. The purpose of the dashboard is to help project managers make informed decisions about resource allocation and ensure that resources are being used effectively.
Resource allocation report
This report shows how resources are allocated across tasks and activities in the project.
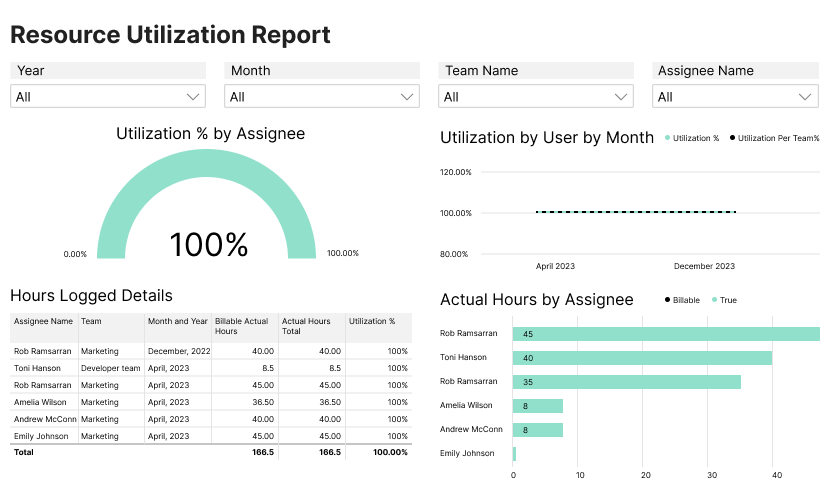
Resource utilization report
This report shows how resources are being used over time and whether they are being used efficiently.
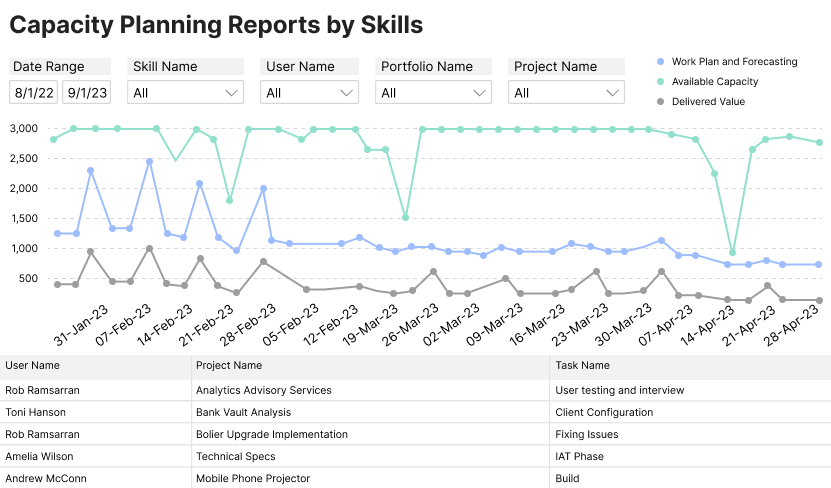
Capacity planning or resource availability report
This report shows how many resources are available at any given time and whether there are any shortages or surpluses.
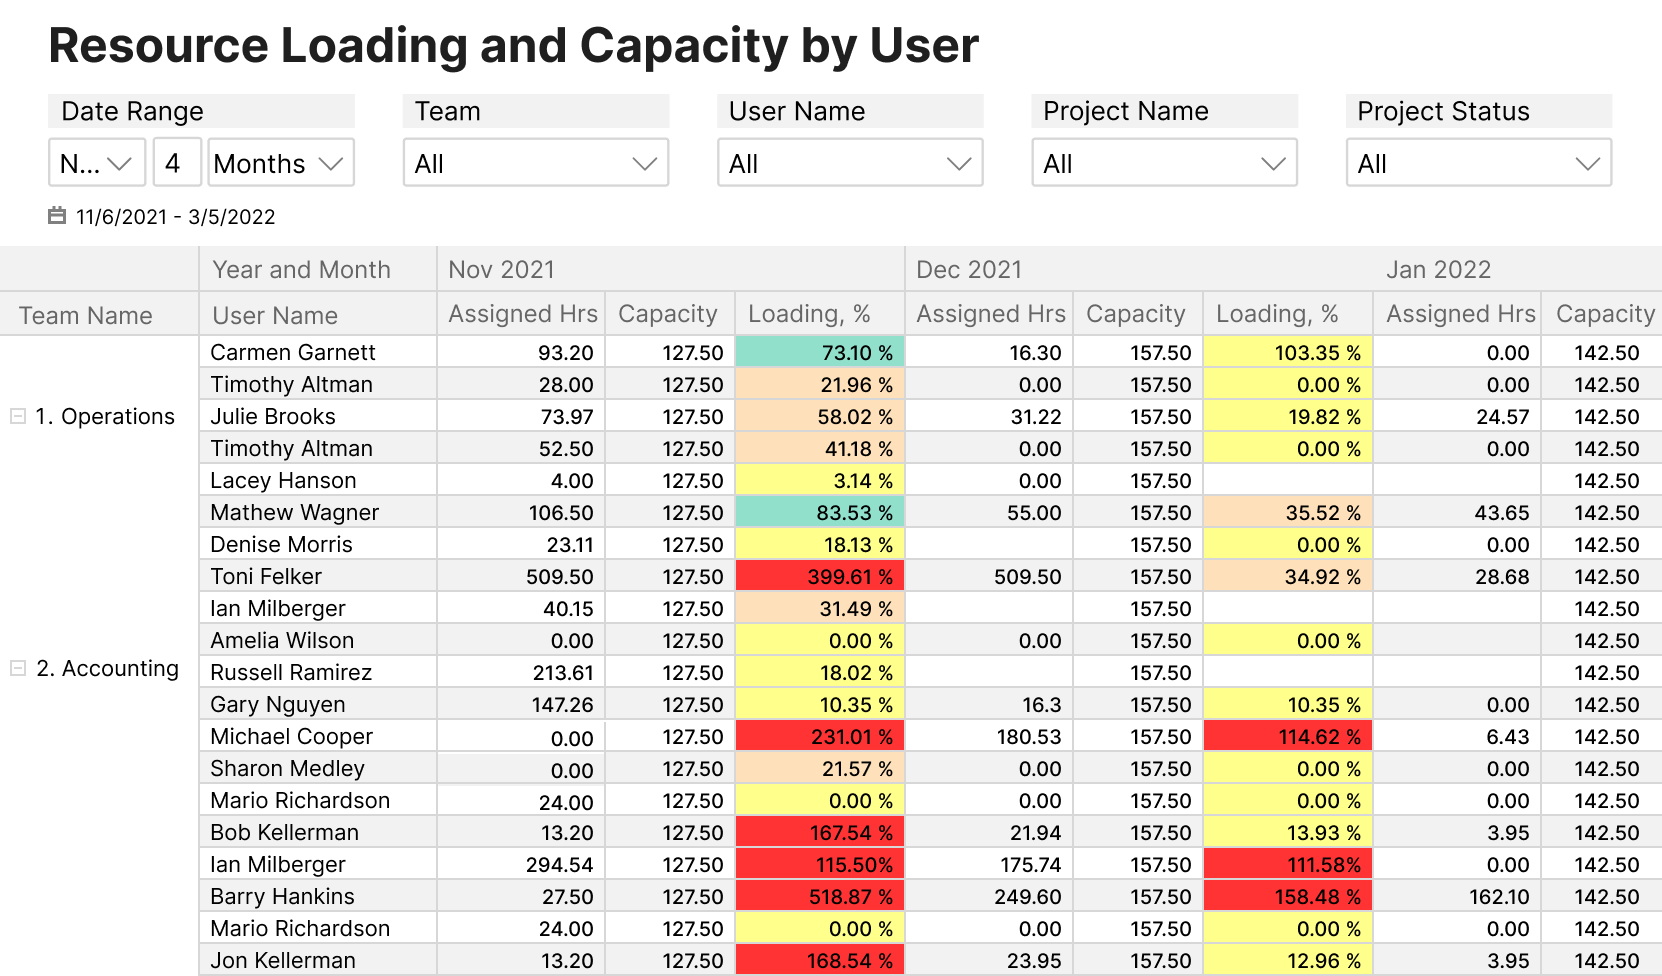
Resource workload report
This report shows how much work each resource is assigned to and whether any resources are overloaded or underloaded.
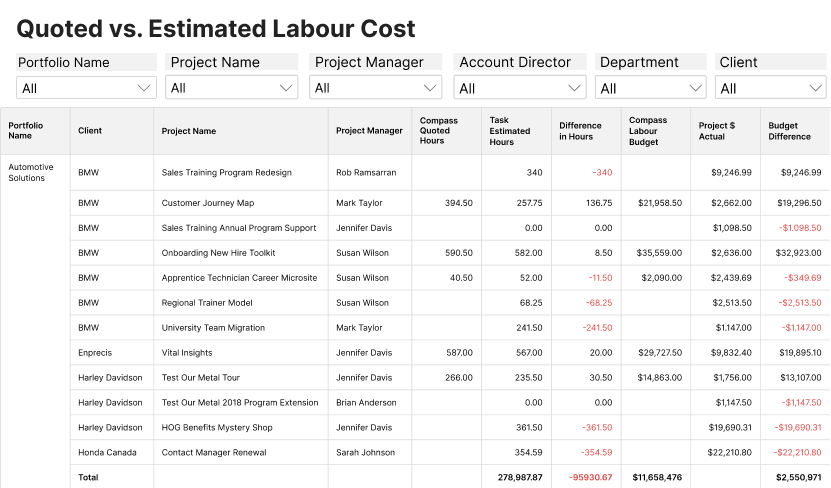
Resource cost report
This report shows the cost of each resource and how much the project is spending on resources overall.
Other elements that could be included in a dashboard
- Resource Allocation Overview: A visual representation (like pie charts or bar graphs) that quickly shows which projects or tasks resources are currently allocated to.
- Resource Availability: A calendar or timeline view showing the availability of each resource. This is especially vital for personnel management to avoid overbooking or overworking employees.
- Utilization Rates: This metric displays the percentage of time or capacity at which a resource is used. It helps in identifying underutilized or overutilized resources.
- Project Timeline and Milestones: Overview of ongoing projects, their timelines, and upcoming milestones. This assists in understanding when more resources might be needed or when they can be freed up.
- Skill Set Database: Especially for managing human resources, it’s beneficial to have an easily searchable database of skills. This helps in matching the right people with the right tasks or projects.
- Resource Costs: Information on the costs associated with each resource, aiding in budgeting and cost management.
- Demand Forecasting: Predictions based on historical data and other indicators that forecast the demand for resources in the coming weeks or months.
- Capacity Planning: Insight into the maximum amount of work that can be undertaken without compromising quality or deadlines.
- Conflict Alerts: Automated alerts for resource conflicts, such as double-booking of personnel or equipment.
- Resource Requests and Approval Workflow: A module where team members or project managers can request resources and where approvals can be managed.
- Historical Data Analysis: A look back on past resource usage patterns, project outcomes, and other pertinent metrics. This can be instrumental for continuous improvement.
- Feedback Mechanism: An option for team members to provide feedback on resource allocation, project demands, or any other concerns.
- Customizable Views: The ability for individual managers or stakeholders to customize their dashboard views based on their specific needs and preferences.
- Integration Capabilities: Ensure that the dashboard can integrate with other tools or systems like project management software, HR systems, or financial tools.
- Notifications: Automated notifications or reminders for upcoming milestones, resource booking confirmations, conflict resolutions, etc.
- Reports and Export Options: Ability to generate detailed reports for various metrics and the option to export data for further analysis or sharing.
- Search Functionality: An easy-to-use search function to quickly find resources, projects, or any other related data.
- Security Features: Role-based access controls, encryption, and other security measures to ensure data protection and privacy.
By using a resource management dashboard that includes these reports, project managers can ensure that resources are being used effectively and that the project stays on track. The dashboard provides a real-time view of resource utilization and availability, allowing project managers to make informed decisions about resource allocation and adjust the resource plan as necessary to ensure project success.
Transparency: Reporting provides transparency in the allocation and utilization of resources. It allows stakeholders to understand how resources are being used and whether they are being used effectively.
Accountability: Reporting holds project managers and teams accountable for the resources they are responsible for. It ensures that they are managing resources in a responsible and efficient manner.
Decision-making: Reporting provides critical information that is needed for decision-making. Resource management dashboards utilize data visualization techniques such as charts, graphs, and heatmaps to present complex information in a comprehensible manner. This visual representation enables project managers to quickly identify trends, discrepancies, and resource allocation issues. For example, a graphical representation of resource allocation can reveal where resources are being underutilized or where additional resources are needed.
Planning: Reporting provides insights into resource usage trends, which can help in planning for future resource needs. This can be helpful in determining budgets and allocating resources for upcoming projects. By analyzing historical data and resource utilization trends, organizations can make proactive decisions regarding resource hiring, training, or procurement to meet future project needs effectively.
Continuous improvement: Reporting provides feedback that can be used to improve resource management processes. For example, if a project team consistently reports that they are overutilizing a particular resource, it may be necessary to invest in additional resources or find ways to optimize resource usage.
Actionable Insights: One of the primary benefits of resource management dashboards is real-time monitoring. These dashboards provide up-to-the-minute data on resource allocation and utilization, allowing project managers to take immediate corrective actions. If a resource is nearing its capacity or if there’s a sudden surge in demand, project managers can swiftly adjust allocations or make informed decisions to mitigate risks.
Customization: Resource management dashboards are versatile tools that can be customized to cater to the needs of various stakeholders. Project managers, team leads, financial departments, and executives may require different sets of reports and insights. Dashboards can be tailored to deliver relevant information to each stakeholder group, ensuring everyone has access to the data they need to make informed decisions.
Collaboration: Resource management dashboards promote transparency and collaboration among project teams. When everyone has access to a centralized dashboard, it becomes easier to discuss resource-related issues, align on priorities, and coordinate efforts to optimize resource utilization. This fosters a culture of collaboration and accountability within the organization.
Risk Mitigation: Resource management dashboards are indispensable tools for identifying and mitigating resource-related risks. By constantly monitoring resource allocation and utilization, project managers can proactively address potential bottlenecks, prevent overallocation, and ensure that projects stay on schedule and within budget.
Performance Evaluation: In addition to resource allocation and utilization, resource management dashboards often include key performance indicators (KPIs) related to resource efficiency and project success. These KPIs can help organizations evaluate the effectiveness of their resource management strategies, identify areas for improvement, and set benchmarks for future projects.