- Portfolio, utilization, capacity, profitability, and budget dashboards provide the most value for engineering firms.
- Resource utilization and capacity planning dashboards help identify staffing gaps and workload imbalances before they affect project delivery.
- Project score cards, profitability dashboards, and budget forecasting dashboards provide early visibility into financial risks and margin performance.
- Executive, portfolio, and project status dashboards help leadership monitor project health and prioritize attention across the organization.
- Business development dashboards connect proposal pipelines with future resource demand and revenue forecasts.
- The most effective dashboards support decisions, not just reporting.
- Dashboard quality depends on reliable project, resource, time-tracking, and financial data.
- Organizations that centralize operational data can build more accurate reports, improve forecast reliability, and make better planning decisions.
Power BI dashboards for engineering firms help leaders turn project, resource, and financial data into actionable decisions. The most valuable dashboards provide visibility into project performance, resource utilization, capacity, profitability, and portfolio health. Instead of spending hours consolidating spreadsheets, engineering teams can use dashboards to identify risks, forecast demand, and make faster decisions.
Most engineering firms do not struggle because they lack data. They struggle because their data is spread across project management tools, spreadsheets, ERP systems, time tracking platforms, and financial software. By the time reports are assembled, the information is already outdated.
The best engineering dashboards solve this problem by bringing operational and financial information together in a single view. They help leaders answer practical questions:
- Which projects are at risk?
- Do we have enough engineering capacity next quarter?
- Which clients and projects are most profitable?
- Are utilization rates supporting growth targets?
- Where are resource bottlenecks emerging?
This guide explores the most useful Power BI dashboards engineering firms use to improve visibility, planning, and decision-making.
Why engineering firms rely on dashboards for project visibility
Engineering firms manage multiple projects, teams, budgets, and client commitments simultaneously. Dashboards help bring project, resource, and financial information into a single view, making it easier to monitor performance and make informed decisions.
As organizations grow, reporting often becomes fragmented across project management tools, spreadsheets, and financial systems. This makes it difficult to understand portfolio performance, resource capacity, profitability, and future demand.
A well-designed dashboard creates a shared source of truth for project managers, resource managers, department leaders, and executives. Instead of spending time compiling reports, teams can focus on identifying risks, planning resources, and improving project outcomes.
What makes an effective engineering dashboard?
An effective engineering dashboard helps leaders make decisions, not just review data. The best dashboards provide visibility into project performance, resource availability, and financial outcomes so teams can identify issues early and take action quickly.
Actionable KPIs instead of raw data
Good dashboards focus on metrics that support decisions. KPIs such as utilization, budget variance, profitability, and schedule performance provide context that helps teams understand whether action is needed.
Real-time project visibility
Projects change constantly. Real-time reporting helps managers identify risks, delays, and budget issues before they affect delivery or profitability.
Resource and capacity insights
Engineering firms depend on specialized skills and limited capacity. Dashboards should help leaders understand workload distribution, available capacity, and future staffing needs.
Financial performance tracking
Project delivery and financial performance are closely connected. Dashboards should provide visibility into revenue, costs, profitability, and budget performance to support better business decisions.
Top 10 Power BI dashboards for engineering firms
The following dashboards represent the reporting views most commonly used by engineering leaders, PMOs, resource managers, and executive teams.
| Dashboard | Primary purpose | Main audience |
| Portfolio summary dashboard | Portfolio visibility and project distribution analysis | Leadership, PMO, Operations |
| Resource utilization dashboard | Utilization management and workforce productivity | Resource managers, Department managers |
| Capacity planning dashboard | Capacity forecasting and staffing planning | Resource managers, Operations leaders |
| Project score card dashboard | Project financial and performance health monitoring | Project managers, Leadership |
| Revenue, cost & profit dashboard | Financial performance and profitability analysis | Finance, Operations, Leadership |
| Executive summary dashboard | Executive financial and operational reporting | Executives, Business leaders |
| Business development dashboard | Pipeline visibility and business growth tracking | Leadership, Business development |
| Billable vs. non-billable dashboard | Time utilization and workforce efficiency analysis | Resource managers, Operations |
| Project status summary dashboard | Portfolio health and project status reporting | PMO, Leadership |
| Actual and forecasted cost vs. budget dashboard | Budget forecasting and cost control | Finance, Project managers, Leadership |
Portfolio summary dashboard
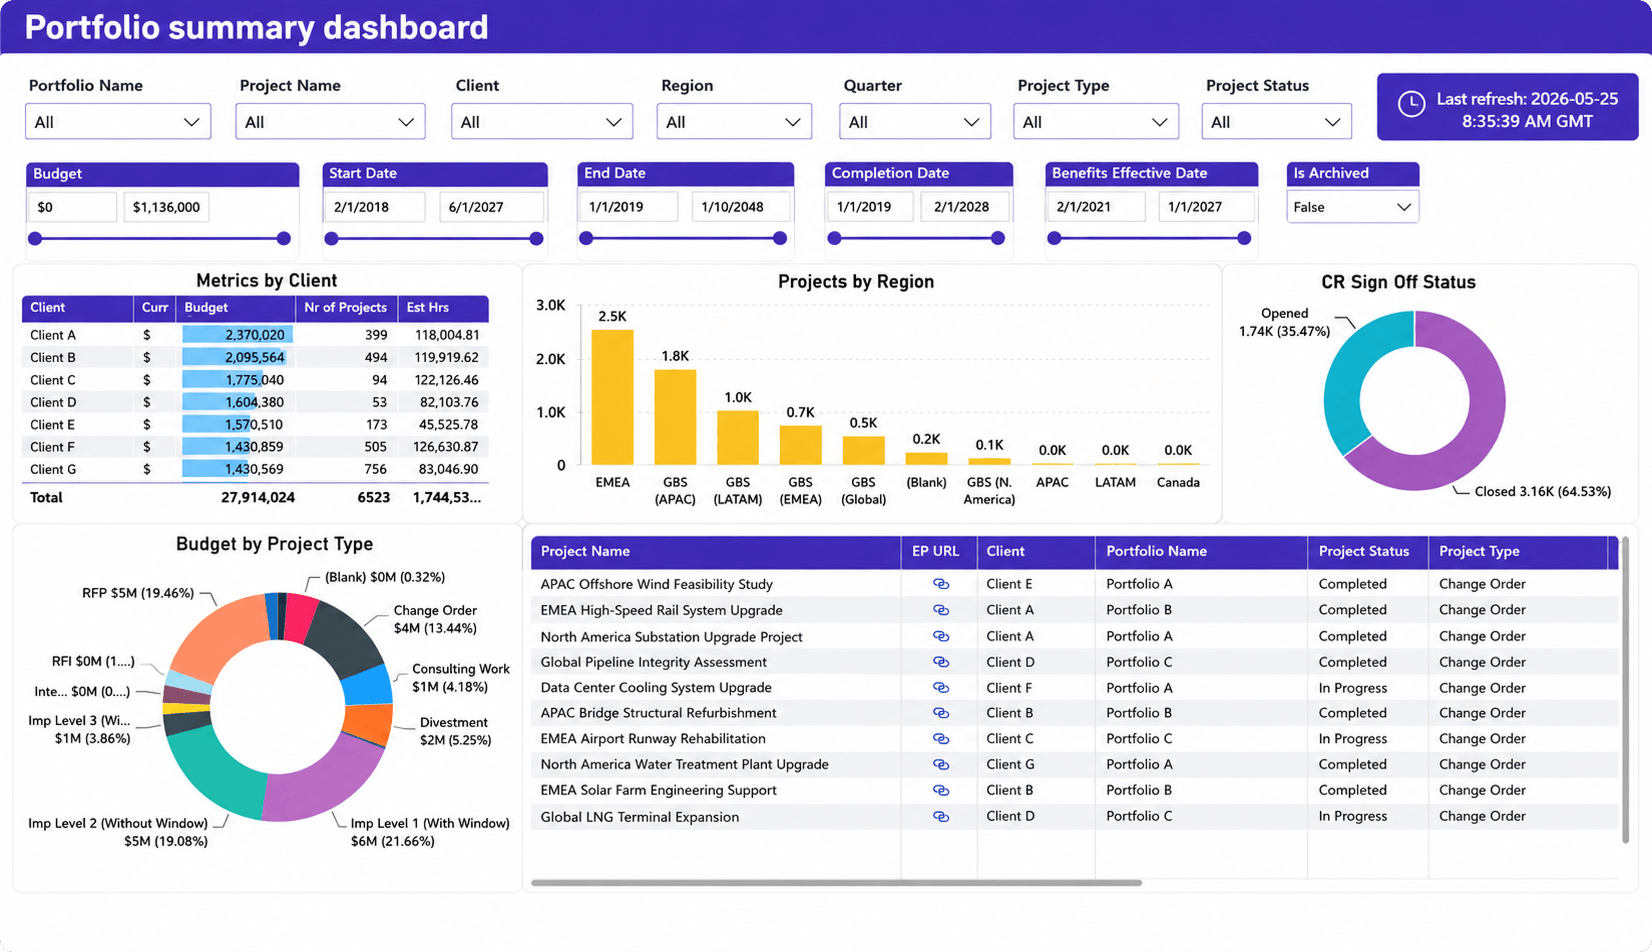
Engineering firms often manage projects across multiple clients, offices, regions, and technical disciplines. A portfolio summary dashboard consolidates project, budget, client, and status information into a single report that helps leaders assess overall portfolio performance.
What it shows
- Portfolio and project filtering
- Client distribution
- Project distribution by region
- Budget allocation by project type
- Project status and completion trends
- Portfolio-level project listings
- Project start and end dates
- Archived versus active projects
Why it matters
Leaders need a quick way to understand portfolio performance without reviewing individual project reports. This dashboard provides a centralized view of project distribution, budget allocation, and overall portfolio health.
Decisions it supports
- Portfolio reviews
- Executive reporting
- Project prioritization
- Resource allocation discussions
- Regional workload planning
- Client portfolio analysis
Resource utilization dashboard
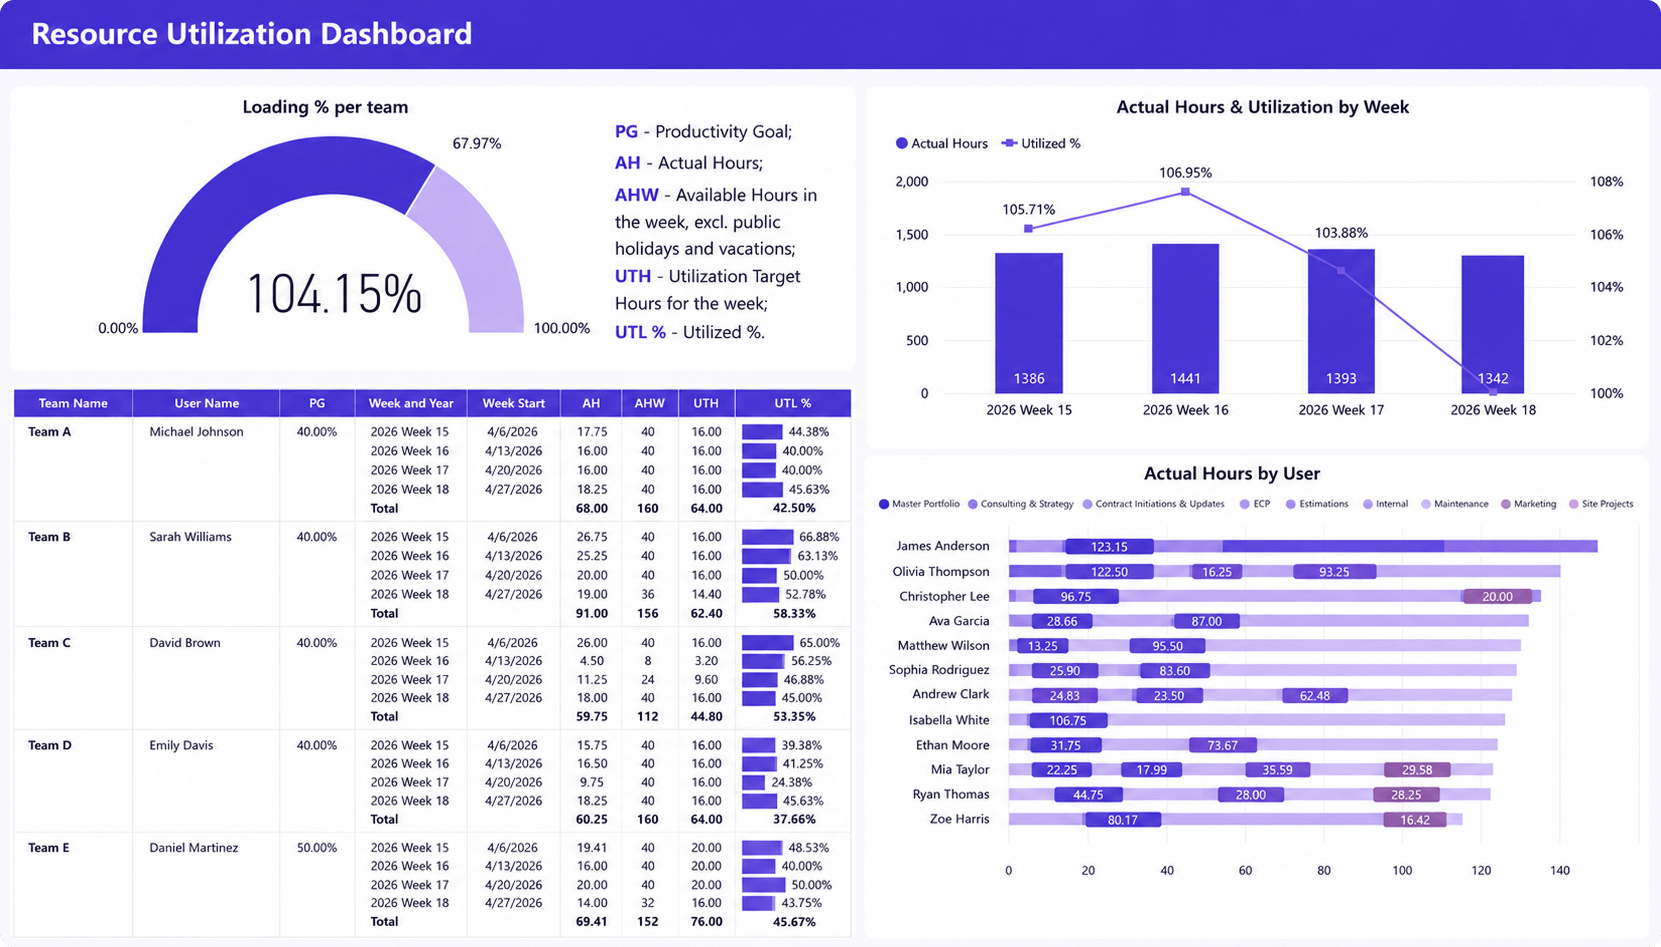
The success of an engineering firm depends on how effectively specialized talent is utilized. This dashboard compares utilization targets against actual performance and highlights how workload is distributed across teams and individual engineers.
What it shows
- Team utilization percentages
- Weekly utilization trends
- Actual versus target utilization
- Available hours versus utilized hours
- Actual hours worked by week
- Utilization performance by employee
- Productivity goals and utilization targets
- Team and individual workload data
Why it matters
Utilization directly affects both profitability and capacity planning. This dashboard helps managers identify underutilized resources, overloaded teams, and workload imbalances before they impact project delivery.
Decisions it supports
- Resource allocation decisions
- Workload balancing
- Hiring and staffing plans
- Utilization improvement initiatives
- Performance reviews
- Capacity planning
Capacity planning dashboard
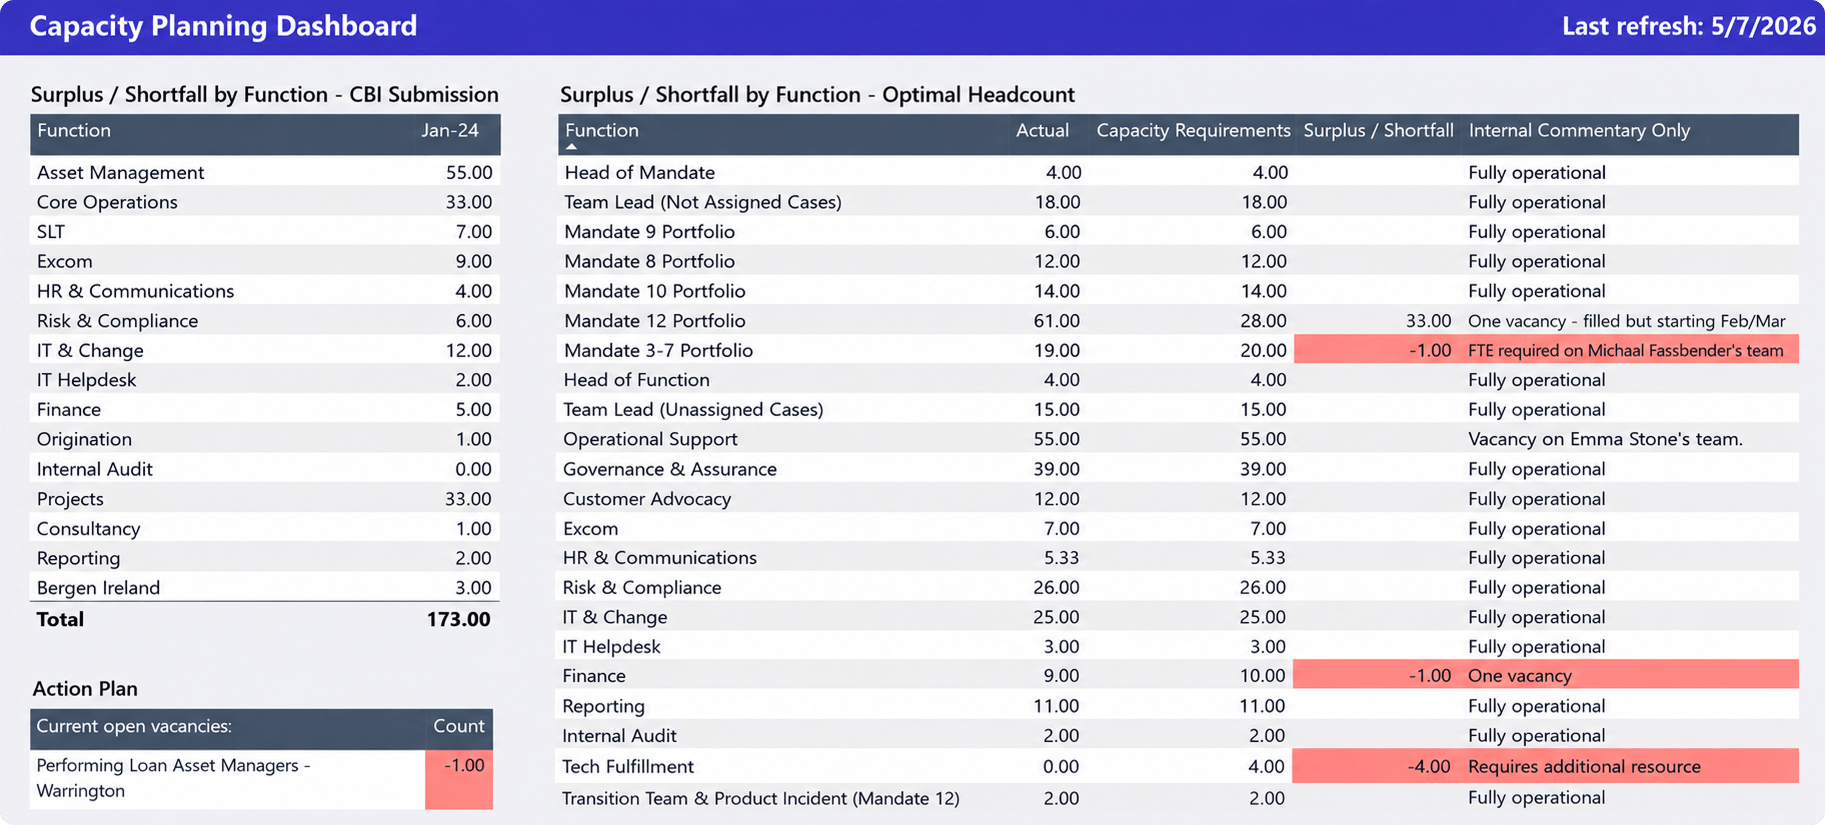
Balancing future project demand with available engineering capacity is a constant challenge. A capacity planning dashboard compares forecasted workload against available resources and helps identify potential staffing gaps before they affect delivery.
What it shows
- Work plan and forecasted demand
- Available resource capacity
- Delivered value trends
- Capacity versus demand over time
- Resource assignments by project
- Planned hours by employee
- Skills allocation
- Project and portfolio workload forecasts
- Resource availability by region, client, or project type
Why it matters
Resource shortages are often discovered after project commitments have already been made. This dashboard helps organizations compare future demand against available capacity so staffing decisions can be made proactively.
Decisions it supports
- Hiring and recruiting plans
- Contractor requirements
- Resource allocation decisions
- Project scheduling
- Capacity risk management
- Portfolio prioritization
- Workforce planning
Project score card
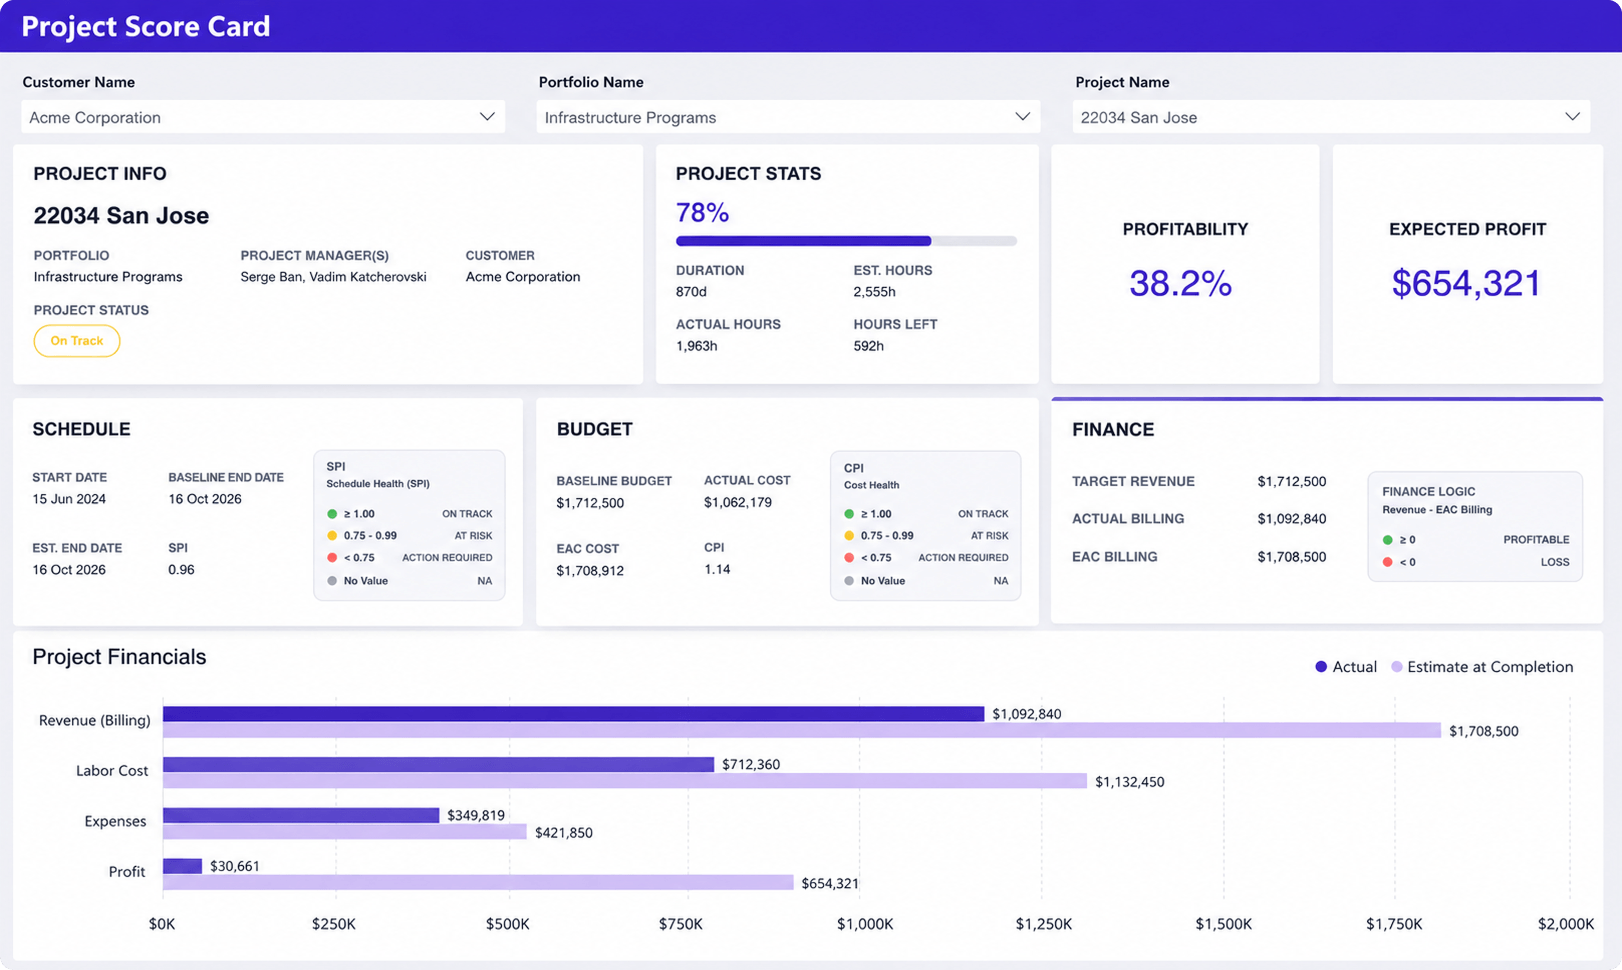
Engineering projects must stay on track financially while meeting delivery commitments. A project score card combines financial, schedule, and delivery metrics into a single view, making it easier to evaluate overall project health.
What it shows
- Project status and health
- Profitability percentage
- Expected project profit
- Revenue, costs, expenses, and profit
- Actual versus forecast financial performance
- Budget performance
- Schedule performance
- Actual hours versus estimated hours
- Hours remaining
- Earned value indicators such as CPI and SPI
Why it matters
Project profitability is influenced by both financial and delivery performance. This dashboard combines project health, schedule, and financial metrics to help teams identify issues before margins are affected.
Decisions it supports
- Project profitability reviews
- Budget management
- Schedule recovery planning
- Resource allocation adjustments
- Client and contract evaluations
- Forecast updates
- Executive project reviews
Revenue, cost & profit dashboard
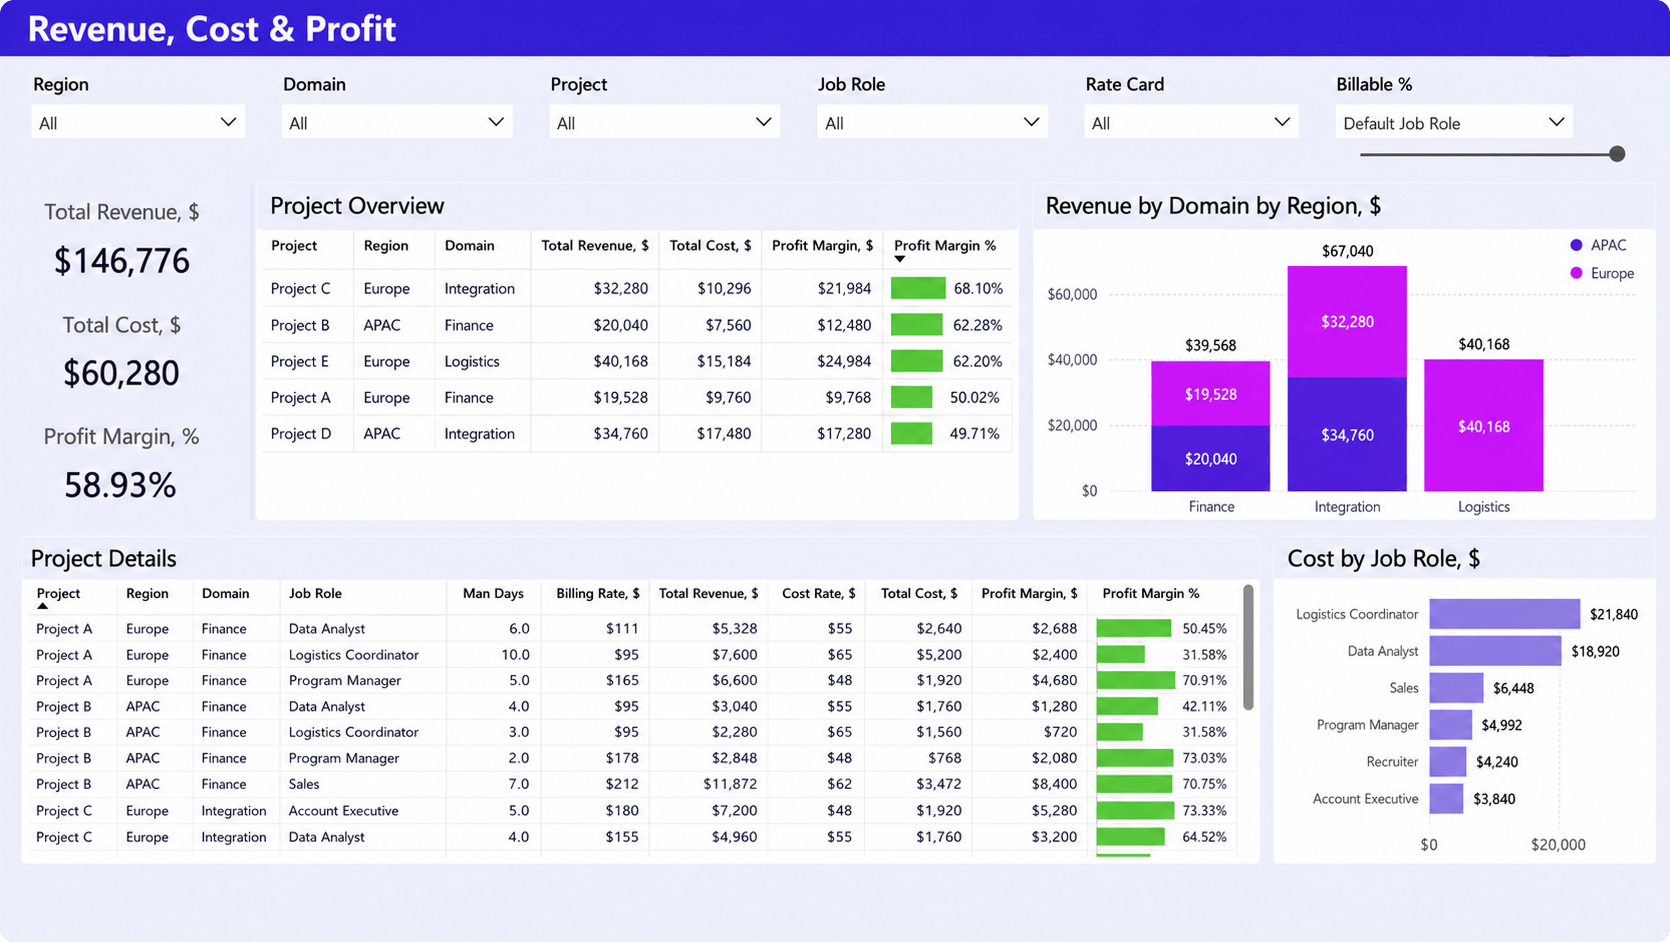
Not all projects, clients, or service areas contribute equally to profitability. This dashboard brings revenue, labor costs, and profit margins together to help leaders understand the financial performance of their engineering operations.
What it shows
- Total revenue
- Total costs
- Profit margin percentage
- Revenue by project
- Cost by project
- Profitability by project
- Revenue by region or business domain
- Cost distribution by job role
- Billing rates and labor costs
- Profit margins across projects and services
Why it matters
Revenue alone does not show whether work is profitable. This dashboard helps leaders understand which projects, services, and business units generate the strongest financial results.
Decisions it supports
- Project profitability reviews
- Pricing strategy adjustments
- Resource allocation decisions
- Service line performance analysis
- Regional performance comparisons
- Cost optimization initiatives
- Revenue planning
Executive summary dashboard
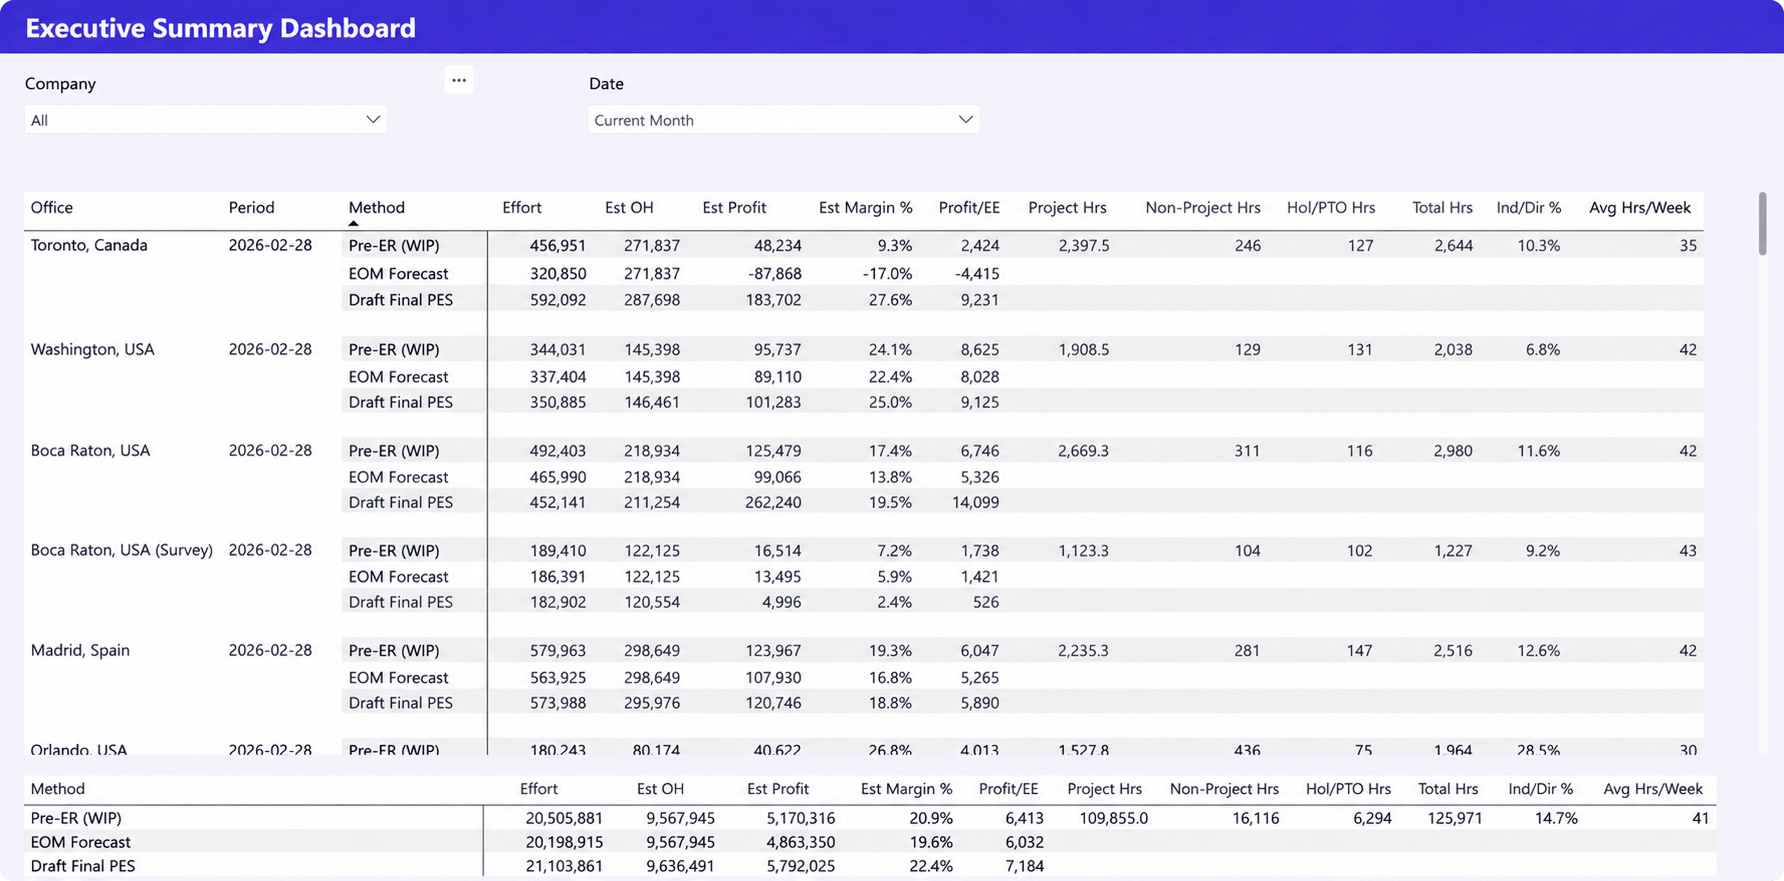
Engineering leaders need visibility into both project delivery and business performance. An executive summary dashboard combines operational and financial metrics into a single report for strategic decision-making.
What it shows
- Revenue and profitability forecasts
- Effort and labor utilization
- Project and non-project hours
- Indirect labor percentages
- Average weekly hours
- Office or business unit performance
- Forecast scenarios and financial outlooks
- Profit margin projections
- Revenue and profit estimates
Why it matters
Executives need visibility into both current performance and future business outcomes. This dashboard consolidates operational and financial metrics into a single view for strategic decision-making.
Decisions it supports
- Financial planning
- Revenue forecasting
- Profitability reviews
- Workforce planning
- Office performance management
- Strategic growth decisions
- Executive reporting
Business development dashboard
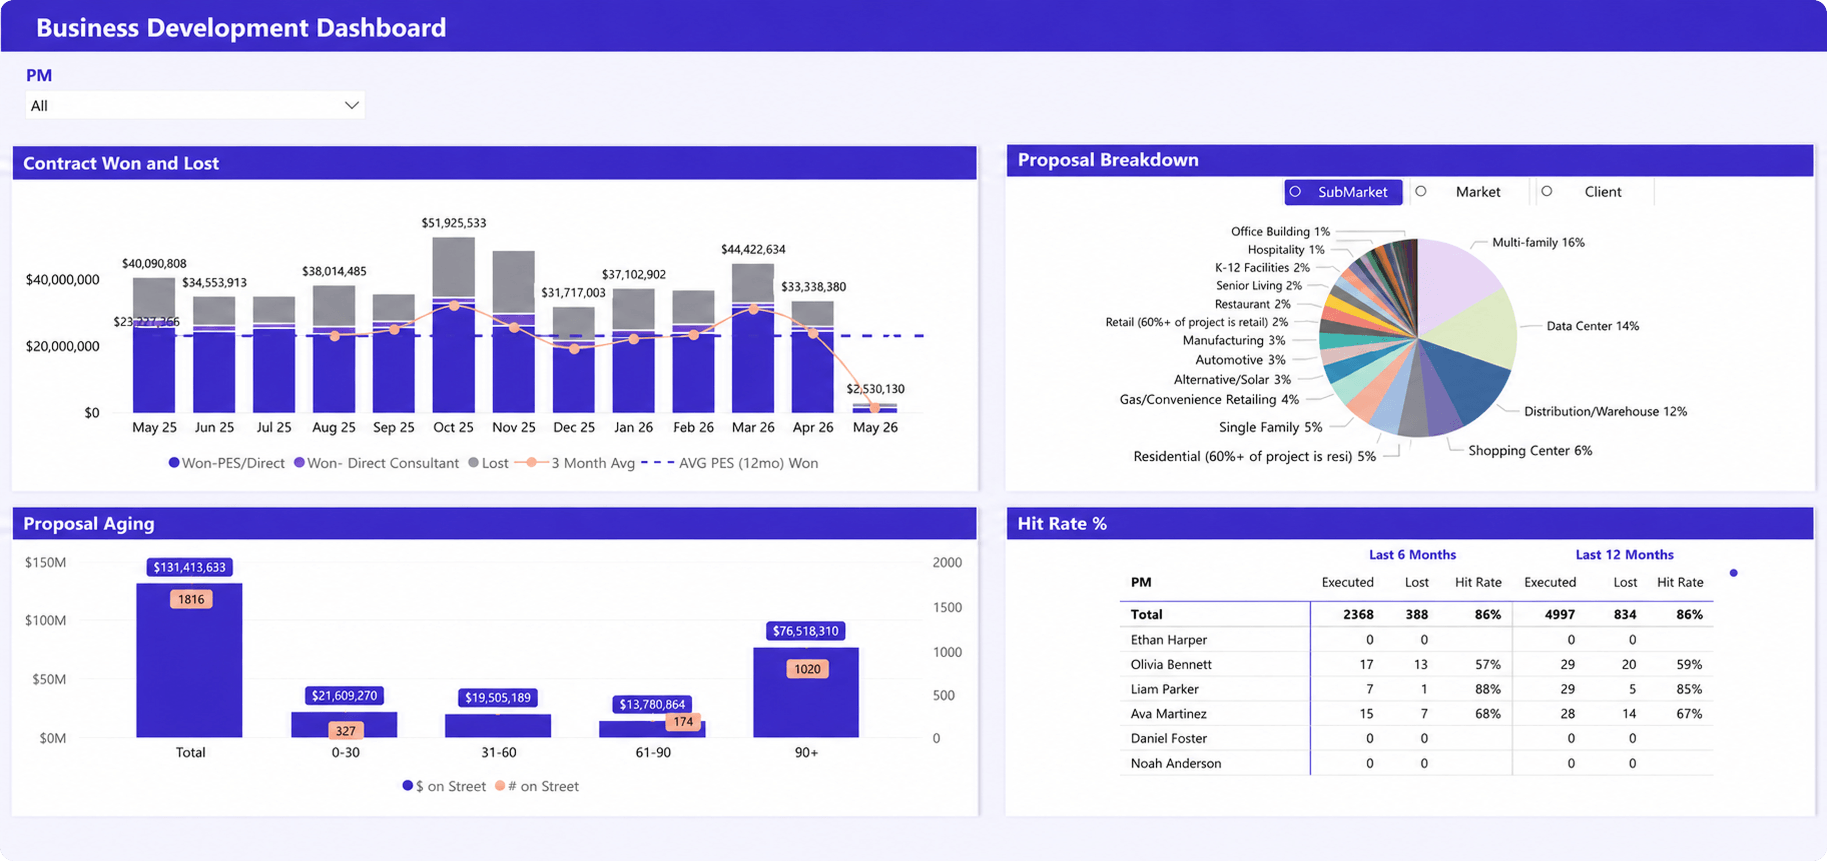
Today’s proposal pipeline often determines next quarter’s workload. This dashboard tracks proposal activity, contract wins and losses, and revenue opportunities to help engineering firms evaluate future demand.
What it shows
- Contracts won and lost
- Proposal volume and value
- Proposal aging
- Hit rates by project manager or business development lead
- Proposal breakdown by market, client, or sector
- Pipeline trends
- Historical win-loss performance
- Future revenue opportunities
Why it matters
Future project demand depends on the health of the sales pipeline. This dashboard helps organizations monitor proposal activity, win rates, and business development performance to support growth planning.
Decisions it supports
- Sales strategy adjustments
- Market prioritization
- Business development planning
- Revenue forecasting
- Proposal process improvements
- Resource demand forecasting
- Growth planning
Billable vs. non-billable dashboard
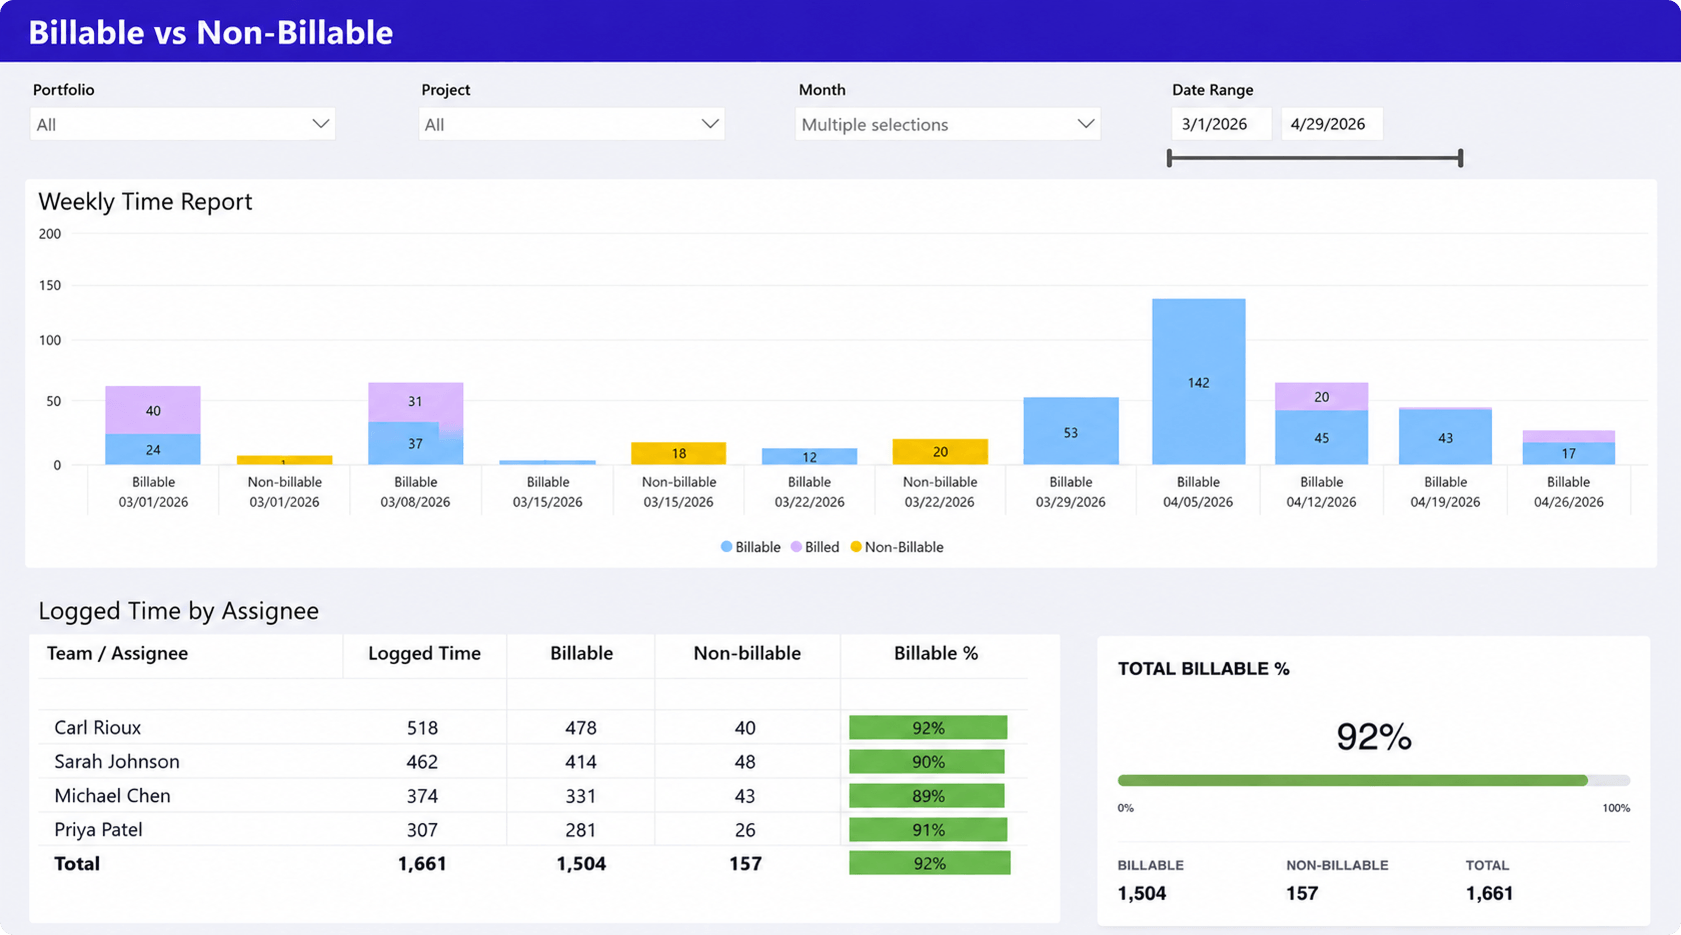
Engineering organizations depend on converting available hours into productive client work. This dashboard shows how time is allocated between billable project activities and internal work across teams.
What it shows
- Billable hours
- Non-billable hours
- Total logged time
- Billable utilization percentage
- Time allocation by employee
- Weekly billable versus non-billable trends
- Billable performance by team member
- Project and portfolio time distribution
Why it matters
The balance between billable and non-billable work has a direct impact on utilization and profitability. This dashboard helps leaders understand how time is being allocated across the organization.
Decisions it supports
- Utilization improvement initiatives
- Workforce planning
- Resource allocation decisions
- Project staffing adjustments
- Productivity analysis
- Capacity planning
- Revenue forecasting
Project status summary dashboard
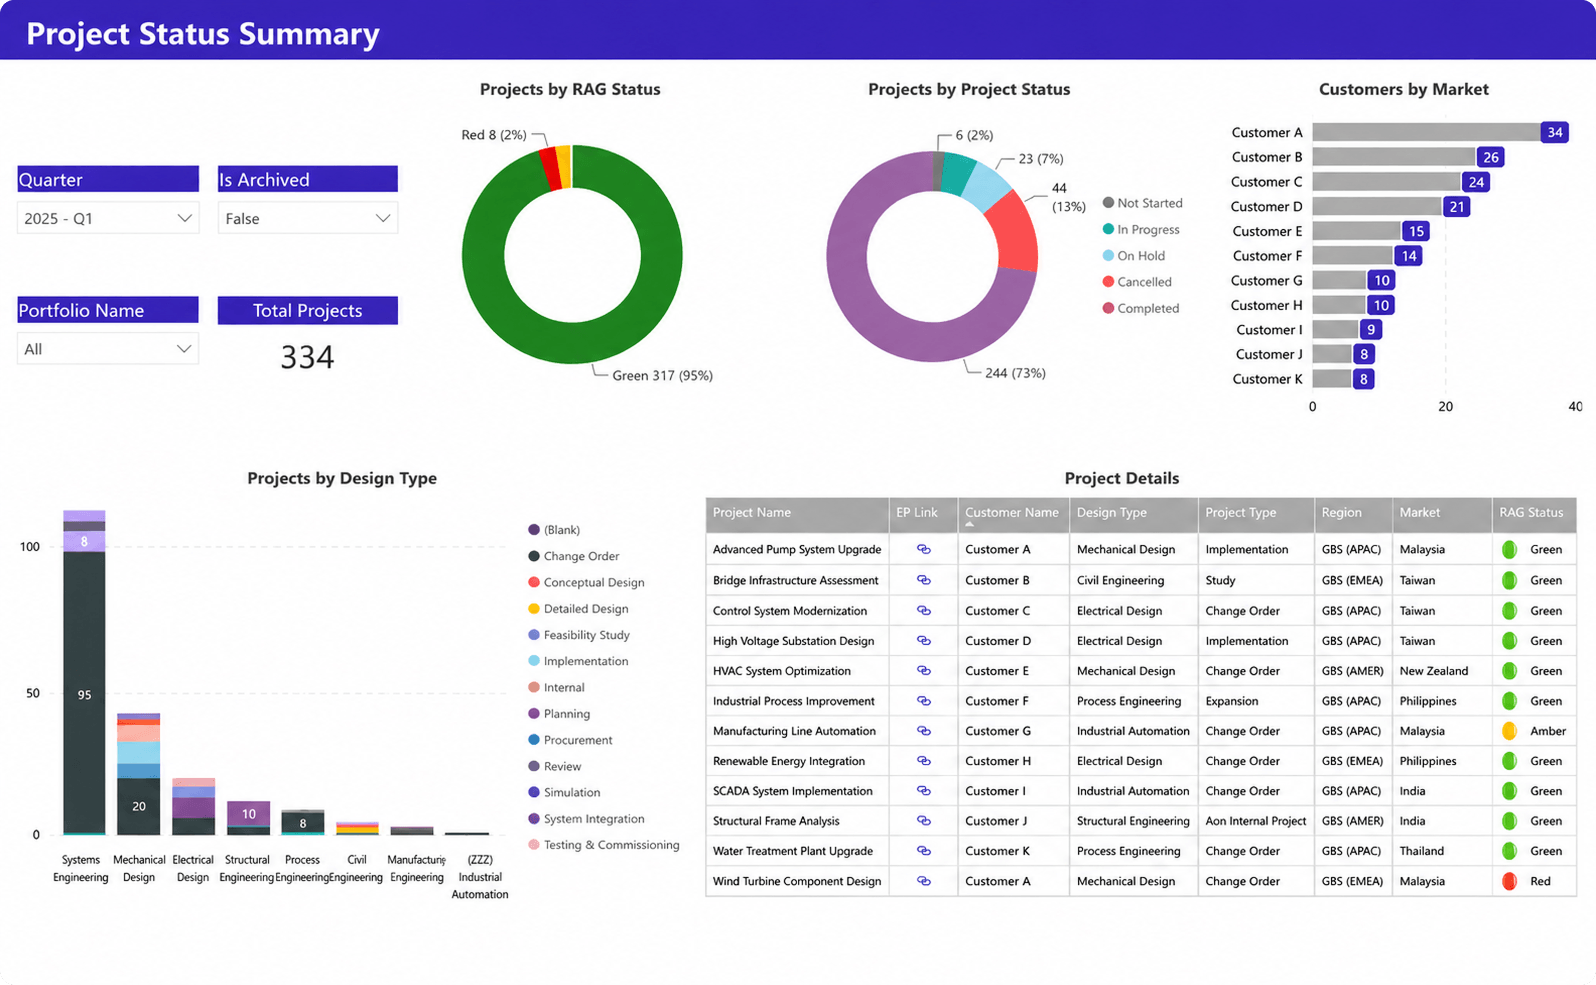
As engineering portfolios grow, maintaining visibility into project health becomes increasingly difficult. A project status summary dashboard provides a high-level view of status trends, project distribution, and projects that may require attention.
What it shows
- Project RAG (Red, Amber, Green) status
- Project status distribution
- Total project count
- Projects by design or service type
- Customer distribution
- Project portfolio summaries
- Active versus archived projects
- Project details and status indicators
Why it matters
As portfolios grow, tracking project health through individual reports becomes difficult. This dashboard provides an immediate view of project status and highlights areas that may require attention.
Decisions it supports
- Portfolio reviews
- Executive reporting
- Project prioritization
- Escalation management
- Resource allocation discussions
- Delivery oversight
- Portfolio governance
Actual and forecasted cost vs. budget dashboard
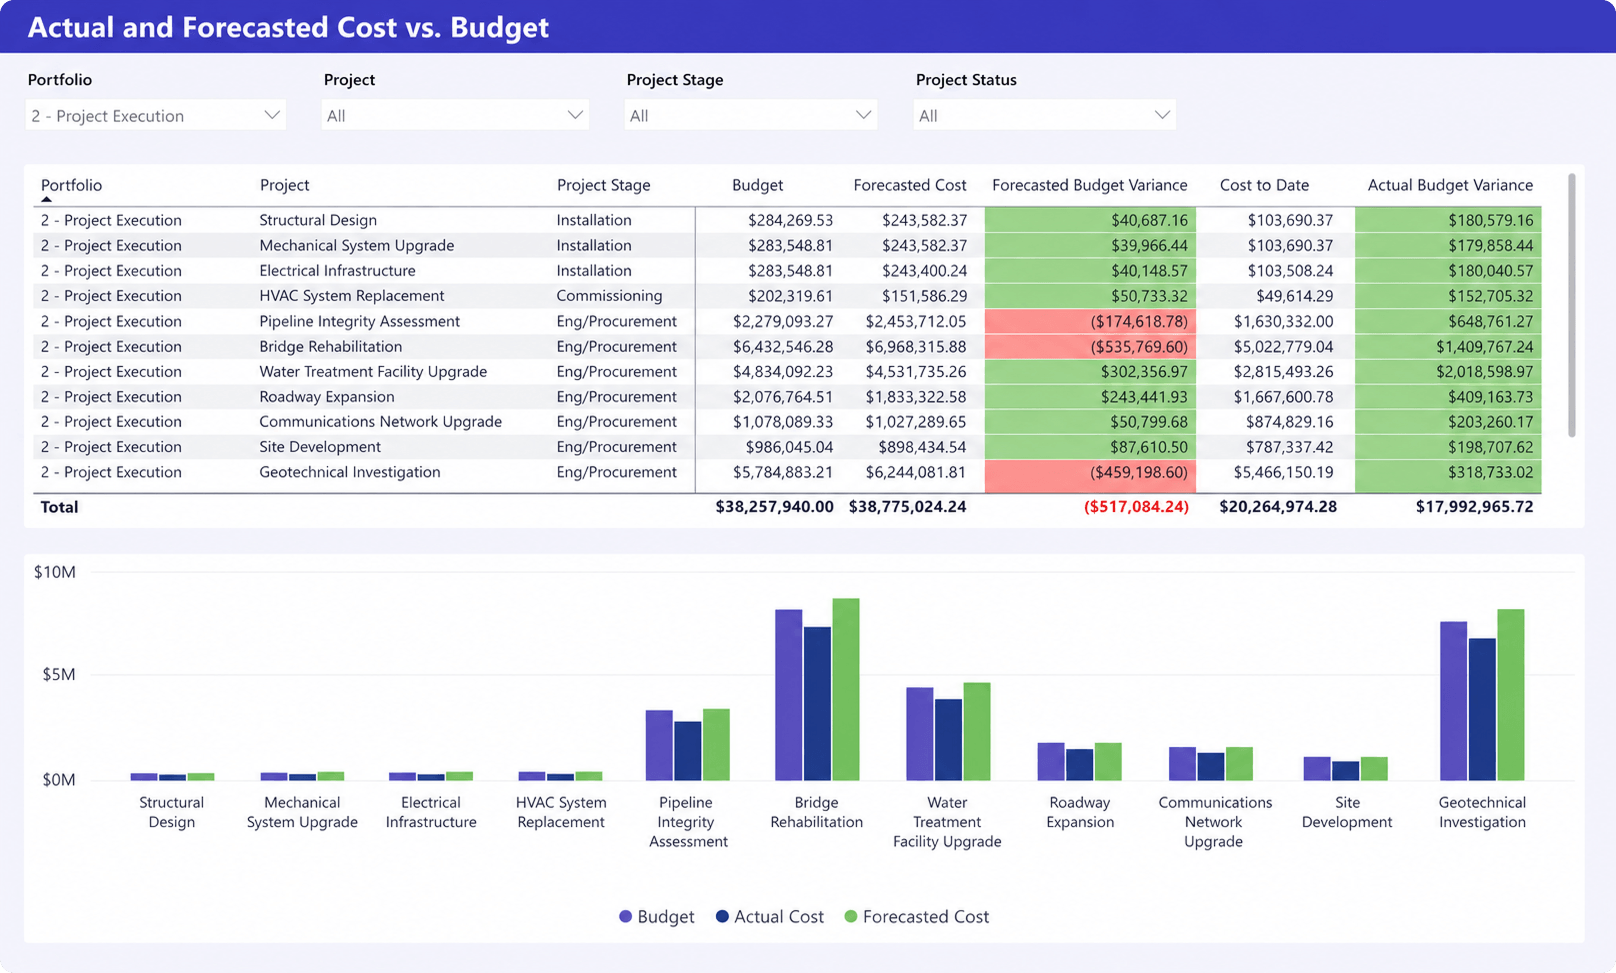
Engineering projects often involve significant labor costs and long delivery timelines. This dashboard compares approved budgets against actual and forecasted costs to help teams identify financial risks before they affect project outcomes.
What it shows
- Project budgets
- Actual costs to date
- Forecasted project costs
- Budget variance
- Forecasted budget variance
- Cost performance by project
- Financial performance across project stages
- Budget versus actual cost comparisons
- Forecasted project outcomes
Why it matters
Projects often appear healthy until costs are reviewed late in the lifecycle. This dashboard helps teams identify budget risks early by comparing actual and forecasted costs against approved budgets.
Decisions it supports
- Budget management
- Cost control initiatives
- Financial risk mitigation
- Forecast revisions
- Project recovery planning
- Resource allocation decisions
- Portfolio financial reviews
Which KPIs engineering firms should track
Engineering firms can track hundreds of metrics, but only a small number consistently influence staffing, delivery, profitability, and growth decisions. The most valuable KPIs help leaders understand whether projects are performing as planned and whether the organization has the capacity to support future demand.
Utilization
Utilization measures how much available time is spent on productive project work.
Low utilization leaves revenue on the table, while consistently high utilization can create burnout and delivery risks. Most firms monitor utilization to balance profitability with sustainable workloads.
Resource capacity
Resource capacity measures how much work the organization can realistically deliver with available resources.
Without capacity visibility, firms often commit to projects before confirming staffing availability. Capacity metrics help leaders identify future shortages, plan hiring, and avoid resource bottlenecks.
Project profitability
Project profitability measures the financial outcome of project delivery.
It helps organizations understand whether projects are generating healthy margins and can reveal issues such as underpricing, scope creep, cost overruns, and low-margin client work that may not be visible through schedule reporting alone.
Budget performance
Budget performance compares planned costs against actual spending.
Budget variance often provides the earliest warning sign of financial trouble. Tracking this KPI helps project managers identify overruns before they impact margins or client relationships.
Schedule variance
Schedule variance measures whether projects are ahead of or behind plan.
Persistent schedule delays can indicate broader problems involving resource availability, estimation accuracy, scope management, or project execution. Monitoring schedule variance helps teams address issues before delivery dates are affected.
Forecast accuracy
Forecast accuracy measures how closely forecasts match actual outcomes.
Organizations with poor forecast accuracy struggle to make confident hiring, budgeting, and portfolio decisions. Improving forecast accuracy leads to better resource planning, more reliable delivery commitments, and stronger financial performance.
Why dashboards often fail to deliver value
Many organizations invest heavily in reporting but still struggle to improve decision-making. The problem is rarely the dashboard itself. More often, the underlying data, reporting processes, and dashboard design prevent teams from getting useful insights.
Common reasons dashboards fail include:
- Data lives in multiple systems. Project information, time tracking, financial data, and resource plans are often stored in separate tools, making reports difficult to maintain and trust.
- Reporting is manual. Teams spend time exporting data and combining spreadsheets instead of analyzing results. By the time reports are distributed, the information may already be outdated.
- Teams don’t trust the data. When project managers, department leaders, and executives rely on different numbers, dashboards quickly lose credibility. Consistent definitions and reliable data sources are essential.
- Dashboards show information but not decisions. Some dashboards attempt to display everything at once. The most effective dashboards are designed around specific business questions and help users take action based on the information presented.
Building dashboards starts with reliable project data
A dashboard is only as useful as the data behind it. Many organizations focus on dashboard design before fixing fragmented reporting processes, which often leads to unreliable insights.
Effective reporting depends on consistent project, resource, time-tracking, and financial data. A capacity dashboard needs accurate resource assignments, while profitability and budget dashboards rely on trustworthy cost and revenue information.
This is why many organizations first establish a centralized source of operational data before building executive reporting. Platforms such as Birdview PSA can serve as that foundation by bringing project management, resource planning, time tracking, and financial data together before connecting it to Power BI.
The goal is not better dashboards. The goal is better decisions based on reliable data.
FAQ: Power BI dashboards for engineering firms
What should an engineering dashboard include?
An engineering dashboard should combine project, resource, financial, and operational KPIs in a single view. Common metrics include project health, utilization, capacity, budget performance, profitability, milestone completion, and forecasted workload.
Which KPIs are most important for engineering firms?
The most valuable KPIs typically include utilization, resource capacity, project profitability, budget variance, schedule variance, forecast accuracy, and portfolio health. These metrics help leaders balance delivery performance with financial outcomes.
How do engineering firms track resource utilization?
Most firms calculate utilization by comparing billable hours against available working hours. Resource utilization dashboards help identify underutilized staff, overloaded teams, and future capacity constraints before they affect project delivery.
Can Power BI combine project and financial data?
Yes. Power BI can combine information from project management systems, ERP platforms, accounting software, time tracking tools, and spreadsheets. This allows engineering firms to create unified reporting views across operations and finance.
What data sources are needed for engineering dashboards?
Most engineering dashboards use project schedules, resource plans, time tracking records, financial data, utilization metrics, and project portfolio information. The quality of the dashboard depends heavily on the quality and consistency of these underlying data sources.
Organizations that struggle with fragmented reporting often start by centralizing project, resource, time-tracking, and financial data before building dashboards in Power BI. Birdview PSA is one example of a platform used for that purpose.