Leonid Kostin
 - Poor project reporting is usually a data problem, not a reporting problem. Most organizations already have enough reports. The challenge is that the underlying data is fragmented, outdated, or inconsistent.
- Manual reporting doesn’t scale. As projects and teams grow, relying on spreadsheets and disconnected systems leads to conflicting reports, slower decisions, and reduced confidence in the numbers.
- Reporting should support decisions, not just document activity. Effective project reporting connects operational metrics with business outcomes such as profitability, resource capacity, delivery risk, and forecast accuracy.
- Dashboards improve visibility but can’t fix disconnected data. Business intelligence tools are only as valuable as the quality and consistency of the information behind them.
- The strongest reporting starts with a single source of truth. Connecting project management, resource planning, time tracking, budgeting, billing, and forecasting creates reporting leaders can trust and act on.
Project reporting should help leaders make decisions, not spend hours validating spreadsheets. Its purpose is simple: bring together project, resource, financial, and operational data so everyone understands how the business is performing and where attention is needed.
Yet reporting is one of the biggest frustrations for growing project-based organizations. Weekly reports take hours to prepare, executives question the numbers, and different departments arrive at the same meeting with different versions of the truth. Instead of discussing delivery risks, profitability, or future capacity, teams spend valuable time figuring out which report is correct.
The frustrating part is that this usually isn’t caused by poor reporting. Most organizations already produce plenty of reports. The real problem is that the information behind those reports lives in disconnected systems, is updated manually, and reflects different parts of the business. A dashboard can make information easier to consume, but it can’t fix fragmented data.
If reporting feels like a constant struggle, you’re likely dealing with an operational problem rather than a reporting problem.
Why reporting feels harder than it should
Most reporting processes break down because collecting data has become more difficult than analyzing it. As organizations grow, projects become more complex, teams become more specialized, and information spreads across multiple systems. What worked for ten projects rarely works for fifty.
Consider a typical reporting cycle in a professional services organization. Project managers update delivery schedules, resource managers maintain capacity plans, finance reconciles budgets and invoices, and executives expect a consolidated view of business performance. None of those activities is unusual. The challenge is that they often happen in different applications, maintained by different people, on different schedules.
By the time someone combines everything into a weekly or monthly report, the business has already changed. New opportunities have entered the pipeline, consultants have been reassigned, additional hours have been logged, and project forecasts have shifted. Even if every number is technically correct, the report no longer reflects the current state of the business.
This challenge appears consistently among growing service organizations. Spreadsheet dependency, fragmented tools, manual reporting, and limited portfolio visibility are among the most frequently mentioned operational problems. These issues don’t just make reporting slower. They make it increasingly difficult for leaders to trust the information they’re using to make decisions.
Some warning signs appear repeatedly:
- Weekly or monthly reports take hours to prepare.
- Different departments report different numbers for the same project.
- Executives regularly ask where the numbers came from.
- Capacity planning still relies on spreadsheets.
- Teams spend more time preparing reports than discussing actions.
- Project, financial, and resource reports rarely tell the same story.
If several of these sound familiar, the reporting process itself probably isn’t the root cause. More often, reporting has become the place where disconnected operational data finally collides.
The five reasons project reporting fails
Poor project reporting is usually a symptom of deeper operational problems. Organizations often look for better reports when they actually need better data, clearer processes, and a shared view of business performance.
Reporting depends on spreadsheets
Spreadsheets are excellent for analysis, but they become a problem when they serve as the primary source of operational data.
As organizations grow, it’s common to see separate spreadsheets for resource planning, budgets, utilization, and executive reporting. Each department updates its own files using different assumptions and schedules, creating multiple versions of the truth.
Every new project, consultant, or client increases the amount of manual reconciliation required. Eventually, reporting becomes less about understanding business performance and more about validating spreadsheets.
Data is scattered across multiple systems
Few project-based organizations operate from a single system. Sales lives in the CRM, delivery in a project management platform, finance in accounting software, while resource planning often remains in spreadsheets.
Each application serves its purpose, but together they create reporting gaps. A project may appear on schedule while exceeding its budget, or available capacity may ignore opportunities likely to close next week. Instead of supporting decisions, reporting becomes an exercise in stitching together disconnected information.
Reports measure activity instead of business outcomes
Many reports explain what teams did but not what leaders need to decide.
Metrics such as completed tasks, logged hours, and milestone status help manage delivery, but executives also need to understand profitability, delivery risk, future capacity, and revenue forecasts.
Strong project reporting connects operational metrics with business outcomes, helping leaders understand how delivery performance affects financial results and future growth.
Reports become outdated before they’re reviewed
Even accurate reports lose value when the data is already outdated.
In many organizations, project managers, finance teams, and resource managers update information on different schedules before someone combines it into a leadership report. By the time it’s reviewed, priorities, workloads, and forecasts have already changed.
The more manual the reporting process, the less useful the report becomes for operational decision-making.
Every department measures success differently
Reporting also breaks down when departments use different KPIs.
Operations focuses on delivery, finance on profitability, resource managers on utilization, PMOs on portfolio health, and executives on overall business performance. Each perspective is valid, but separate reports rarely provide a consistent view of the business.
Effective project reporting connects these perspectives, helping leaders understand how delivery, resources, and financial performance influence one another instead of optimizing each metric in isolation.
The hidden cost of poor reporting
Poor reporting affects far more than reporting itself. When leaders don’t have timely, reliable information, decisions slow down, risks are identified later, and operational problems become more expensive to fix.
Decision-making suffers because leadership teams spend time validating numbers instead of discussing actions. Rather than focusing on delivery priorities or business strategy, meetings become exercises in reconciling spreadsheets and explaining discrepancies.
Project delivery becomes more reactive. Without timely visibility into schedule changes, budget overruns, or resource constraints, small issues often go unnoticed until they’ve already affected clients, deadlines, or profitability.
Resource planning also becomes less reliable. When capacity forecasts rely on disconnected spreadsheets instead of real-time data, managers either overcommit their teams or hesitate to accept new work, reducing both delivery confidence and revenue opportunities.
Finally, poor reporting erodes executive confidence. When project, financial, and resource reports tell different stories, leaders stop trusting the information they’re given. Instead of making decisions based on a shared view of the business, they rely on individual updates and manual investigations.
The purpose of project reporting isn’t simply to describe what happened. It’s to give decision-makers the confidence to act before problems become larger and more expensive.
What dashboards solve, and what they don’t
Reporting dashboards improve visibility by presenting important information in a clear, real-time format. They help leaders monitor business performance, identify trends, and spot exceptions before they become larger problems.
A well-designed dashboard can replace hours of manual report preparation by automatically bringing together key metrics from across the organization. Instead of searching through multiple reports, executives can quickly see project health, utilization, profitability, financial performance, and portfolio status in a single view.
This makes dashboards particularly valuable for organizations that have outgrown spreadsheet-based reporting.
However, dashboards are often expected to solve problems they were never designed to fix.
A dashboard cannot correct inconsistent project data, reconnect disconnected systems, or standardize KPIs across departments. If project schedules, financial information, time entries, and resource plans all come from separate sources that don’t agree with one another, the dashboard simply presents those inconsistencies more clearly.
That’s why organizations sometimes invest in sophisticated business intelligence tools but see little improvement in reporting. The reporting interface changes, but the underlying data remains fragmented.
The most effective reporting dashboards aren’t necessarily the most visually impressive. They’re the ones built on accurate, connected operational and financial data that everyone in the business trusts.
The dashboards that make the biggest difference
Not every dashboard serves the same purpose. Different stakeholders need different levels of information, so the most effective reporting environments use a small number of focused dashboards rather than one report trying to answer every question.
Executive summary dashboard
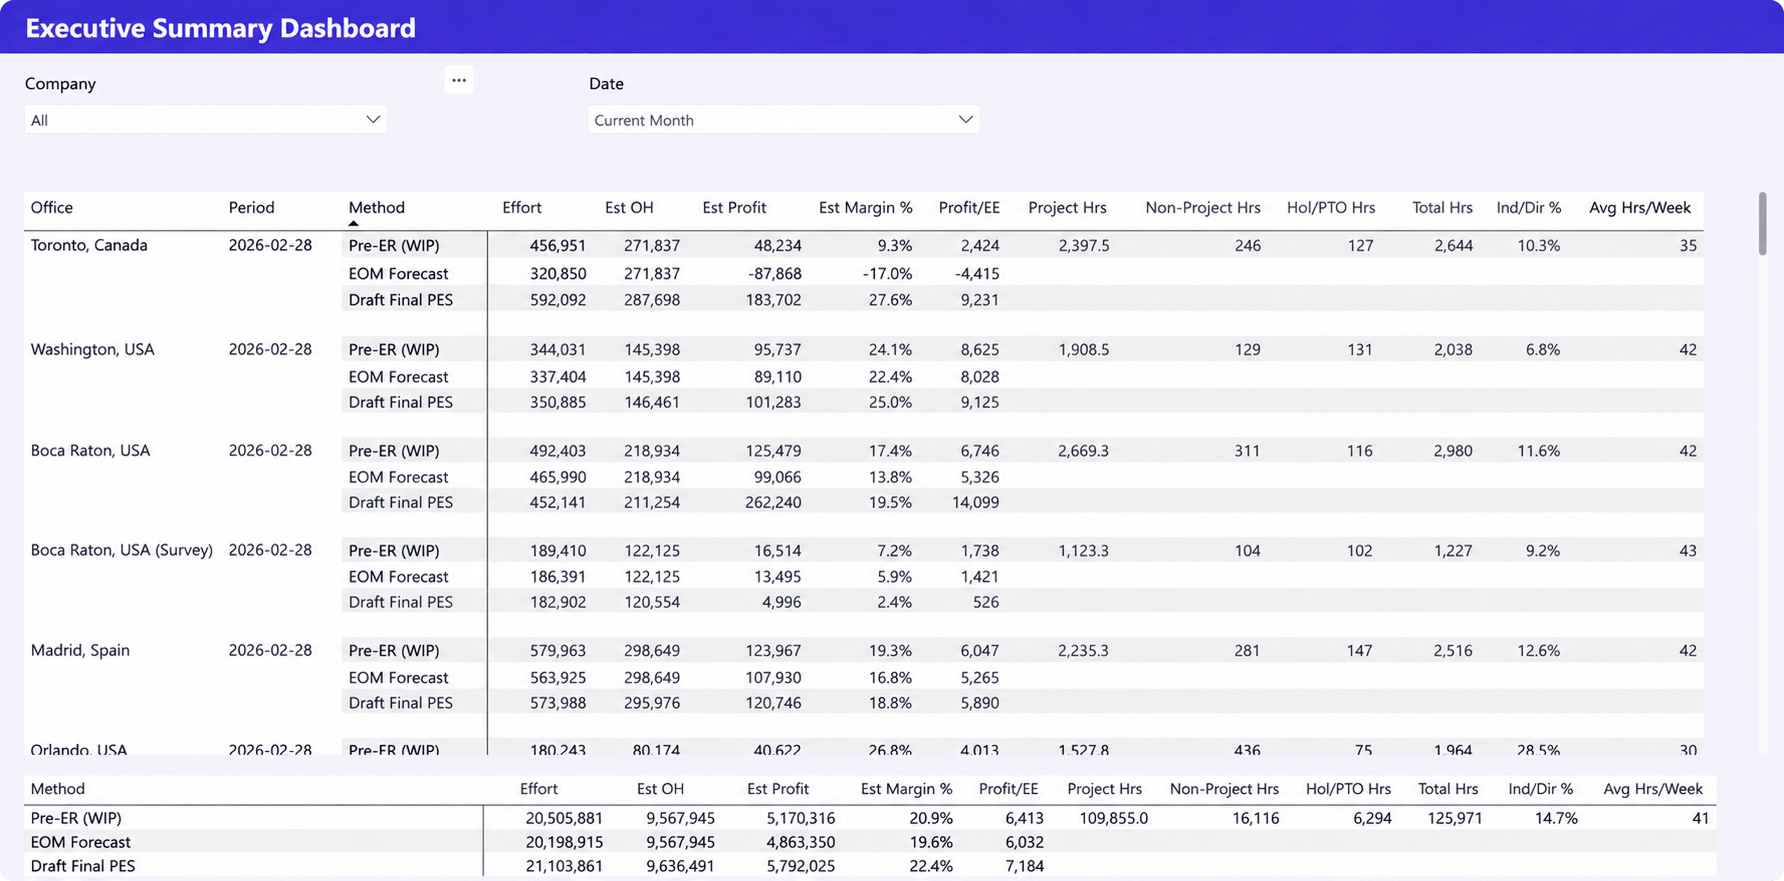
An Executive Summary Dashboard brings together high-level operational and financial KPIs, giving leadership a single view of business performance. Instead of reviewing separate reports, executives can quickly assess utilization, profitability, project hours, and overall business health to identify where attention is needed.
Portfolio summary dashboard
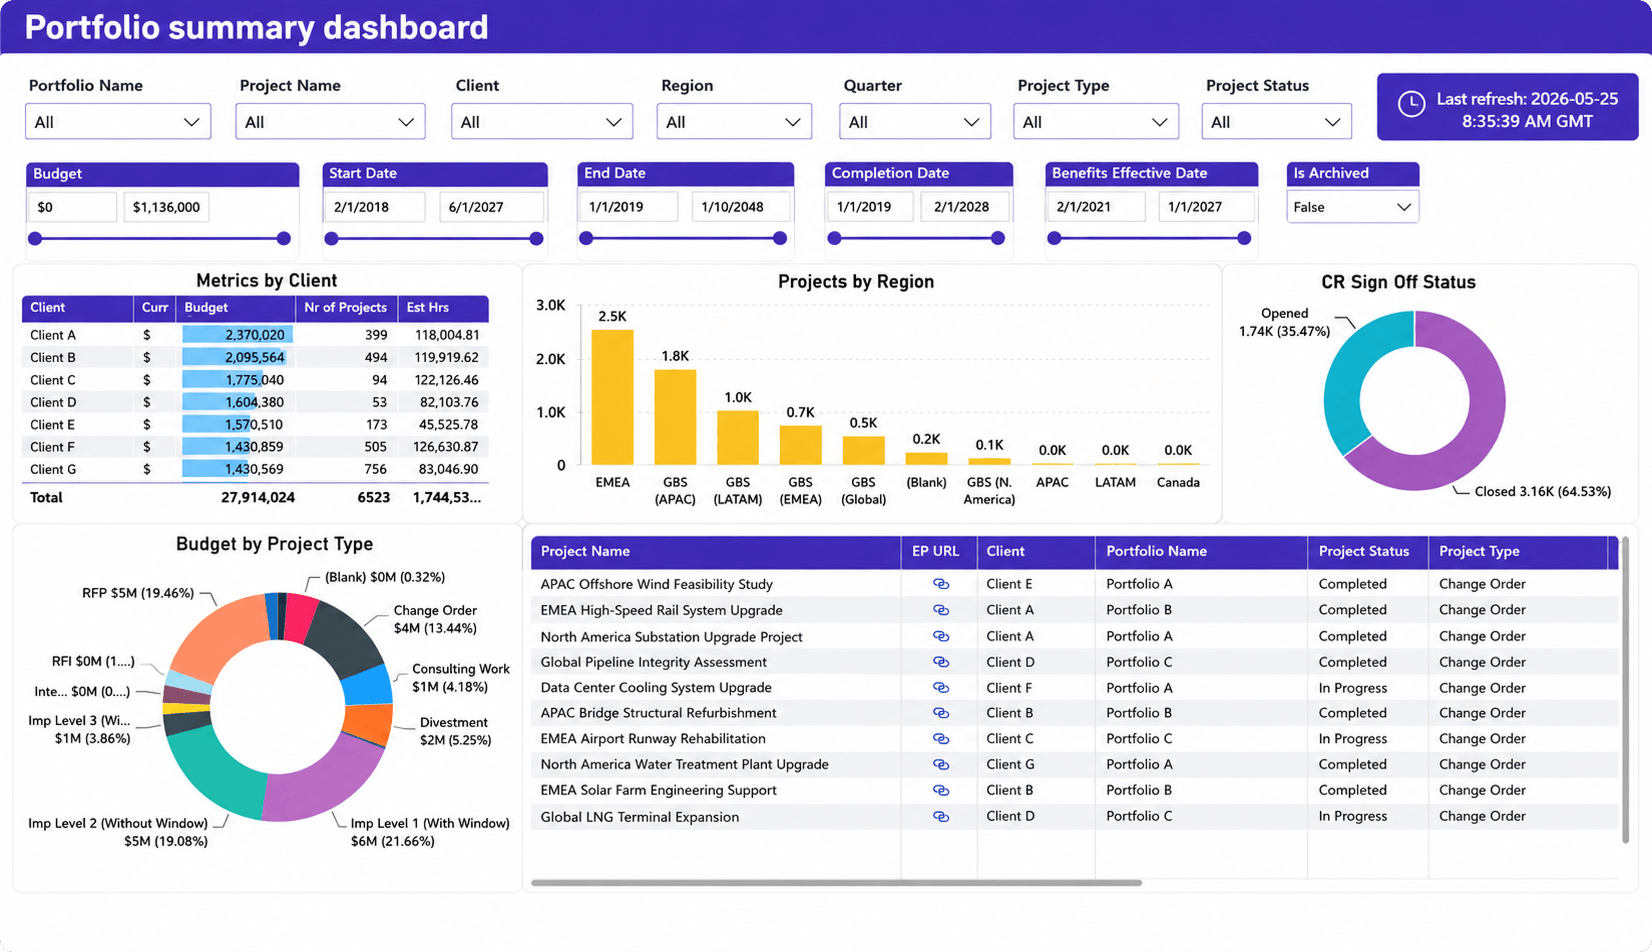
A Portfolio Summary Dashboard helps PMOs and operations leaders monitor delivery across multiple projects. It highlights portfolio health, budgets, project status, and emerging delivery risks, making it easier to prioritize resources and intervene before issues affect the wider portfolio.
Resource utilization dashboard
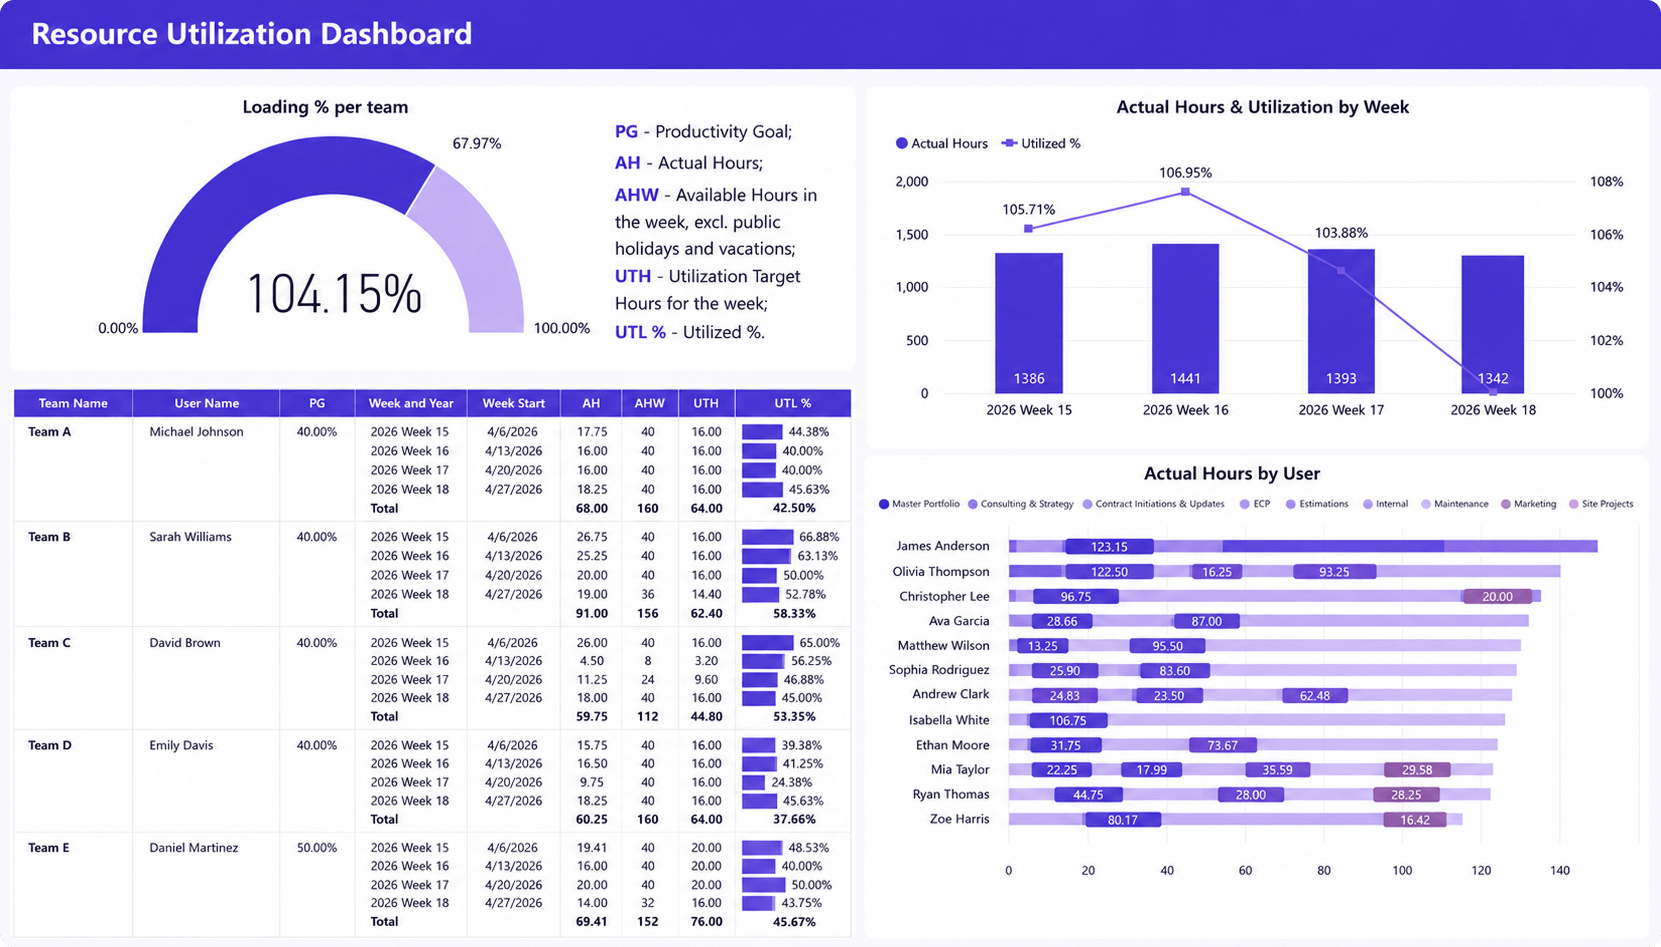
A Resource Utilization Dashboard provides real-time visibility into workloads, capacity, and utilization trends across teams and individuals. It helps managers identify overallocated resources, available capacity, and future staffing gaps, supporting better forecasting and resource planning.
Project performance dashboard
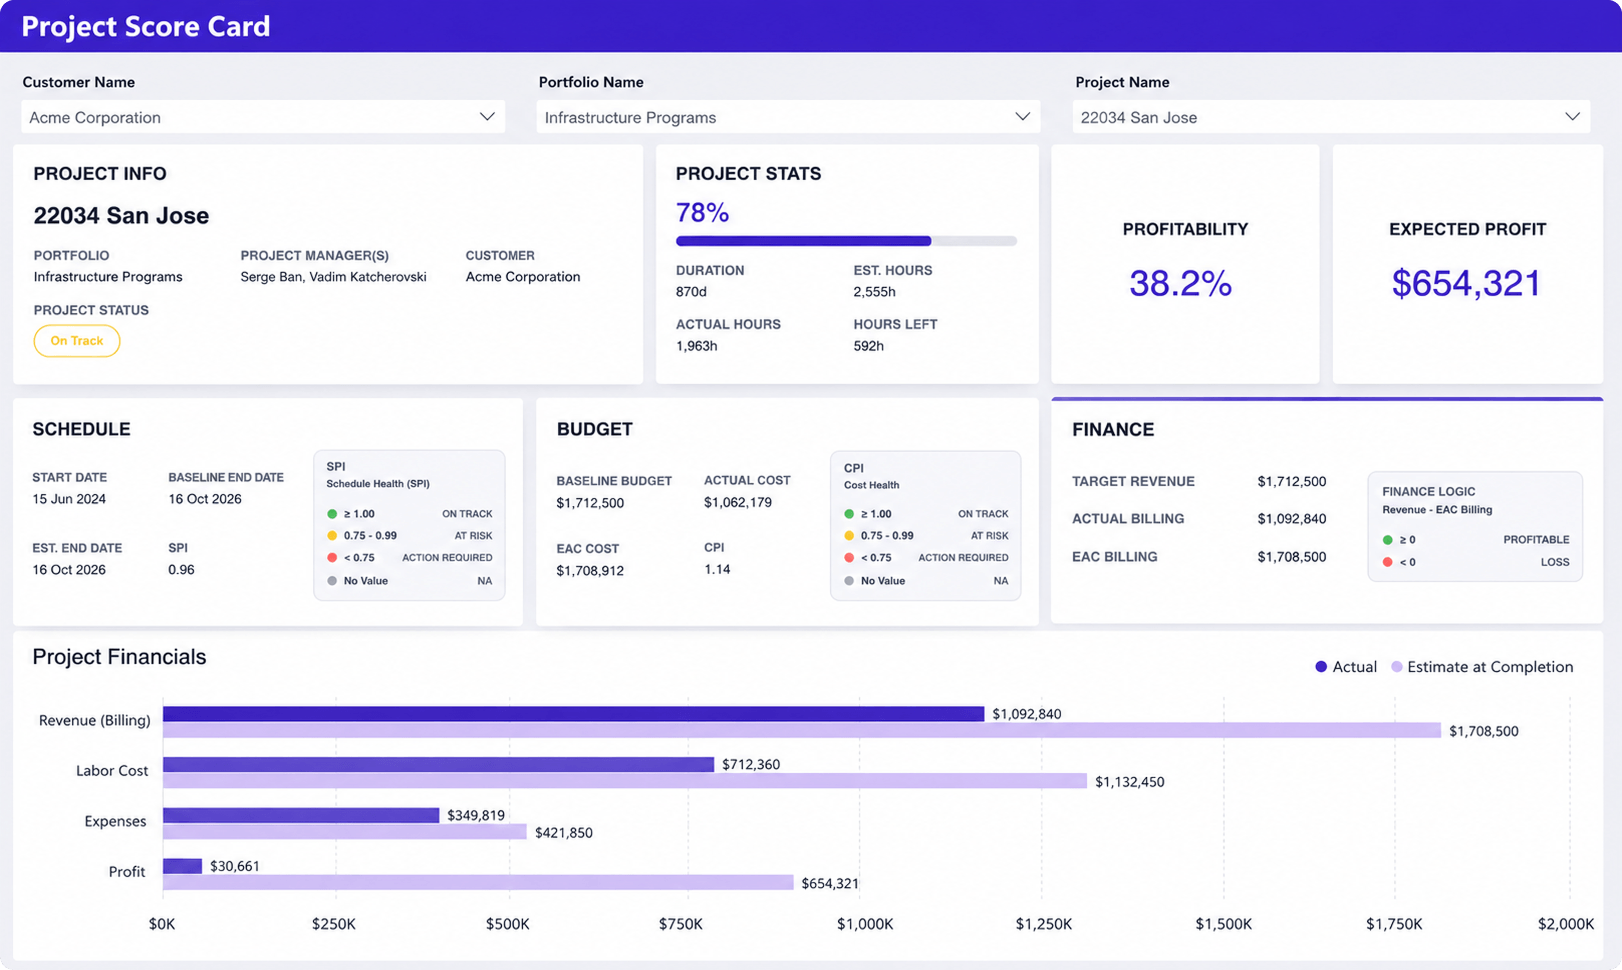
A Project Performance Dashboard combines schedule, budget, profitability, and delivery metrics for individual projects. It gives delivery managers and PMOs an at-a-glance view of project health, helping them identify risks early and take corrective action before they impact clients or portfolio performance.
Why connected data matters more than beautiful dashboards
The biggest reporting improvement doesn’t come from better visualizations. It comes from better data.
Organizations often assume their reporting problems can be solved by implementing Power BI or another business intelligence platform. While these tools are excellent for presenting information, they depend entirely on the quality of the data behind them.
Imagine a consulting firm that wins a new client.
The opportunity starts in the CRM. A project is created in the project management system. Resources are assigned based on future availability. Team members log time against the project. Approved hours flow into billing. Financial results are reflected in profitability reports, while executives monitor delivery and revenue through dashboards.
If each step happens in a different system that isn’t connected, reporting becomes a manual reconciliation exercise. Teams spend hours exporting data, comparing spreadsheets, and resolving discrepancies before anyone can trust the numbers.
When those systems share the same data, reporting changes fundamentally.
Capacity forecasts update as projects are staffed. Project budgets reflect approved time entries. Financial dashboards stay aligned with delivery progress. Executives no longer have to ask which report is correct because everyone is working from the same information.
This is why many organizations discover that replacing spreadsheets alone doesn’t solve their reporting challenges. The real improvement comes from creating a single source of truth that connects project management, resource planning, time tracking, budgeting, billing, and forecasting.
Platforms such as Birdview PSA illustrate this approach by bringing operational and financial data together before it’s presented in dashboards. Instead of manually combining information from multiple applications, organizations can build reporting on shared data that stays consistent across projects, resources, and finance. The dashboards themselves are important, but they’re only valuable because the underlying data is connected.
How project-based organizations build reporting leaders actually use
Improving project reporting isn’t about creating more reports. It’s about giving leaders reliable information they can use to make better decisions. Organizations that build effective reporting usually follow the same principles.
Standardize your KPIs
Different teams don’t need identical dashboards, but they should use the same definitions for key metrics such as utilization, project health, profitability, and forecast accuracy. Consistent KPIs eliminate conflicting reports and create a shared view of performance.
Connect operational and financial data
Projects shouldn’t be reported separately from budgets, resource plans, or billing. Bringing operational and financial data together helps leaders understand not only current performance but also its impact on future revenue, capacity, and profitability.
Automate data collection
If reporting depends on exporting spreadsheets every week, it won’t scale. Automating data collection reduces manual effort, improves data accuracy, and gives decision-makers access to current information instead of last week’s snapshot.
Build reports around decisions
Every dashboard should answer a business question. Instead of adding more metrics, focus on the information leaders need to prioritize projects, allocate resources, manage financial performance, or identify delivery risks.
Monitor leading indicators
Historical reports explain what happened. Leading indicators such as capacity forecasts, utilization trends, budget burn, and project health help teams identify problems early, giving them time to respond before issues affect delivery or profitability.
Signs your reporting process is ready for modernization
If your organization recognizes several of these warning signs, improving reporting is likely to deliver benefits well beyond faster reporting.
- Reports regularly take hours to prepare.
- Teams disagree about the numbers.
- Executives request additional analysis after every report.
- Project, resource, and financial reports don’t align.
- Capacity planning still relies on spreadsheets.
- Forecasting requires manual updates.
- Reporting delays slow important business decisions.
- Teams spend more time creating reports than acting on them.
Modern project reporting isn’t about producing more reports. It’s about giving leaders reliable information they can use immediately.
FAQ: Project reporting and dashboards
Why is project reporting so difficult?
Project reporting becomes difficult when project, resource, financial, and time-tracking data is spread across multiple systems. Teams spend more time collecting and validating information than analyzing it, making reports slow to produce and difficult to trust.
What’s the difference between reports and dashboards?
Reports provide detailed information for analysis, while dashboards present key metrics in a visual format for ongoing monitoring. Dashboards help leaders identify trends and exceptions quickly, whereas reports are typically used to investigate specific projects or business questions.
Can dashboards replace spreadsheets?
Not completely. Spreadsheets remain useful for ad hoc analysis and financial modelling. However, dashboards should replace spreadsheets as the primary way of monitoring business performance by automatically pulling data from connected systems.
What should a project reporting dashboard include?
An effective dashboard combines project health, resource utilization, financial performance, capacity, and forecasting metrics. The exact KPIs depend on the audience, but the goal is always the same: provide the information needed to make faster, better decisions.
Why do reporting initiatives fail?
Most reporting initiatives fail because organizations improve the visualization instead of the underlying data. Without consistent KPIs and connected operational and financial information, even the best dashboards will produce unreliable insights.
Better reporting starts with better data
If there’s one lesson to take away from this article, it’s this: poor project reporting is rarely a reporting problem.
Most organizations already have enough reports. What they lack is a reliable, connected view of their business. When project information, resource plans, financial data, and forecasts all exist in separate systems, reporting inevitably becomes slow, manual, and difficult to trust.
Modern reporting dashboards help solve this challenge by making information easier to access and understand, but they’re only as valuable as the data behind them. Organizations that see the greatest improvements don’t simply replace spreadsheets with dashboards. They build reporting on connected operational data that everyone trusts.
If you’re evaluating ways to improve project reporting, start by looking beyond the dashboard itself. Standardizing KPIs, connecting project and financial data, and reducing manual reporting effort will have a far greater impact than adding another report to the weekly leadership meeting.