- Architecture firms need visibility into workloads, capacity, utilization, project performance, and future staffing demand to make informed resource decisions.
- The most valuable dashboards combine project, resource, and financial data rather than reporting on projects in isolation.
- Resource utilization and staff utilization dashboards help identify overloaded teams, underutilized employees, and emerging capacity risks before they affect project delivery.
- Capacity planning dashboards improve forecasting by comparing future project demand against available resources, helping firms anticipate hiring and staffing needs.
- Portfolio, executive, and project scorecard dashboards provide leadership with the information needed to monitor project health, financial performance, backlog, and strategic priorities.
- Many reporting challenges stem from spreadsheets, disconnected systems, and manual data consolidation rather than the dashboards themselves.
- Dashboards become significantly more valuable when project planning, resource management, time tracking, and financial data are connected in a single reporting environment.
Resource dashboards for architecture firms provide visibility into workloads, capacity, utilization, project performance, and future staffing needs. They help leaders understand whether the firm has the right people available to deliver current and upcoming projects without creating scheduling conflicts, burnout, or profitability risks.
Many architecture firms still rely on spreadsheets and manual reporting. That approach becomes difficult when resources are shared across multiple projects, deadlines shift, and project teams work across several phases simultaneously.
The most effective dashboards combine project, resource, and financial data in one place, helping operations leaders, principals, and resource managers make better staffing, forecasting, and portfolio decisions.
Why architecture firms need better project and resource visibility
Architecture firms often manage long projects with resources shared across multiple teams and project phases. Without portfolio-level visibility, it becomes difficult to understand who is available, where bottlenecks are developing, and whether future demand can be supported.
Common challenges include:
- Team members become overloaded across multiple projects
- New opportunities are accepted without understanding staffing availability
- Utilization varies significantly between teams or studios
- Reporting depends on manual spreadsheet consolidation
- Hiring decisions are based on assumptions rather than forecasted demand
One of the most common issues is discovering resource conflicts too late. An architect may appear available on one project while already committed elsewhere. Good dashboards help identify these conflicts before they affect delivery.
What architecture leaders should track
Effective architecture dashboards focus on the metrics that influence staffing, delivery, and profitability decisions.
Project progress
Track milestone completion, project phase status, schedule variance, critical deadlines, and deliverables to understand whether projects are progressing according to plan.
Resource utilization
Monitor billable and non-billable utilization, workload distribution, and utilization trends to ensure resources are used effectively without creating burnout.
Capacity availability
Measure available capacity against existing commitments, planned leave, and future demand to identify staffing gaps before they affect project delivery.
Project profitability
Track budgets, labor costs, revenue forecasts, margins, and write-offs to understand the financial performance of projects throughout their lifecycle.
Future workload demand
Combine project pipeline data with resource forecasts to anticipate hiring needs, capacity constraints, and future staffing requirements.
7 project and resource dashboards every architecture firm should use
Different dashboards serve different audiences. A project manager, principal, and resource manager often need very different views of the same data.
Resource utilization dashboard
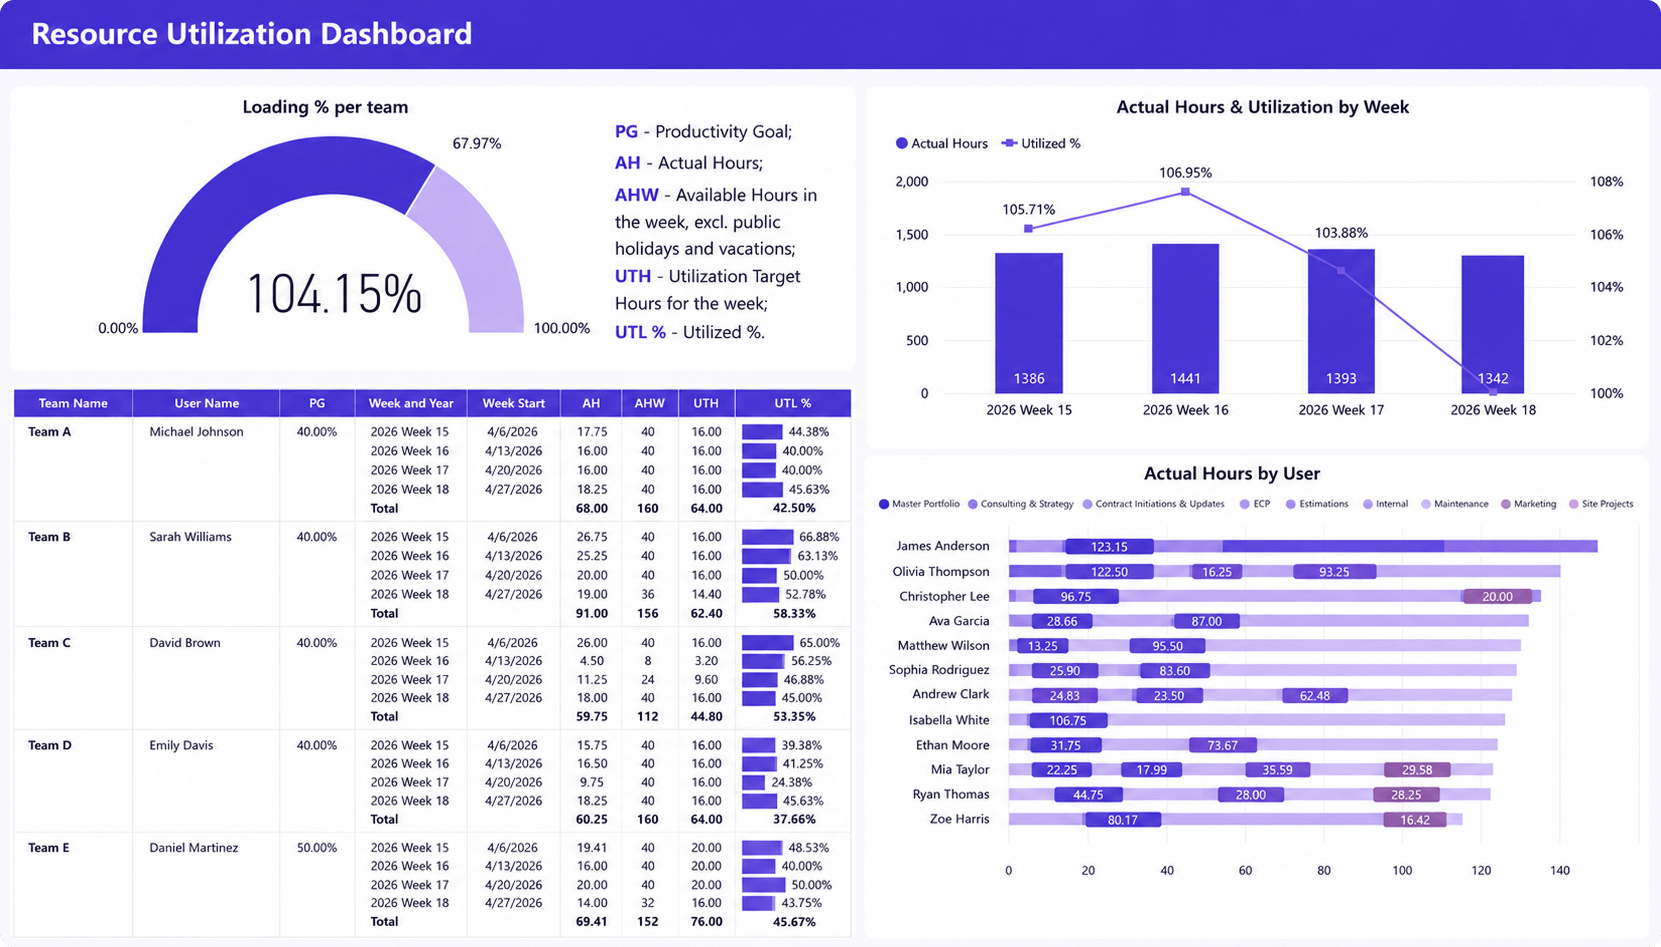
A resource utilization dashboard helps architecture firms understand how effectively people are allocated across active projects. It combines utilization targets, actual utilization, workload trends, and individual resource data in a single view.
Leaders can quickly identify overloaded team members, underutilized staff, and emerging capacity issues before they affect project delivery.
Operations leaders and resource managers can use this dashboard to:
- Identify overloaded team members before delivery quality is affected
- Find underutilized staff who can support new projects
- Compare actual utilization against firm-wide targets
- Monitor workload distribution across studios and disciplines
- Support staffing decisions using real capacity data rather than assumptions
Why it matters for architecture firms: Architecture firms often share resources across multiple projects and studios. This dashboard helps maintain healthy workloads, improve utilization, and identify capacity risks before schedules or deadlines are affected.
Capacity planning dashboard
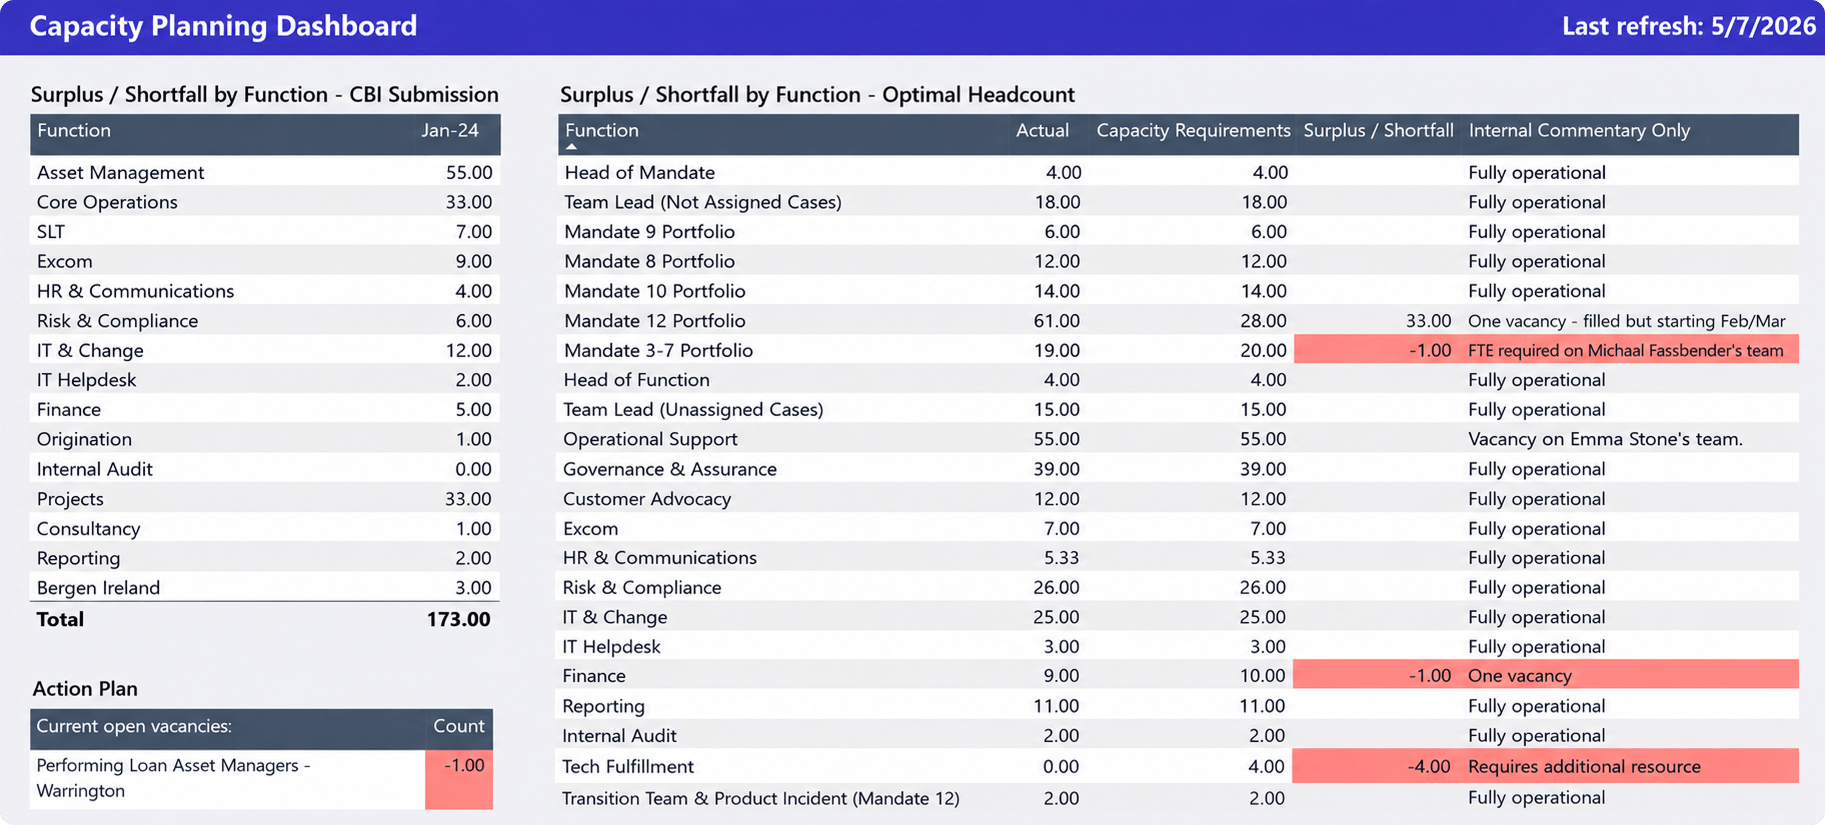
Most staffing problems are visible weeks or months before they affect project delivery. A capacity planning dashboard helps architecture firms compare future demand with available resources, making it easier to identify shortages before deadlines are at risk.
Operations leaders and resource managers can use this dashboard to:
- Identify future resource shortages before they affect project delivery
- Compare planned work against available capacity
- Forecast hiring and subcontracting needs
- Evaluate whether the firm can take on additional projects
- Analyze demand by skill set, project type, region, or client
- Understand which assignments are creating upcoming capacity constraints
Why it matters for architecture firms: Architecture projects rely on specialized skills that are difficult to replace quickly. This dashboard helps firms forecast hiring needs, avoid last-minute staffing decisions, and plan growth more effectively.
Portfolio summary dashboard
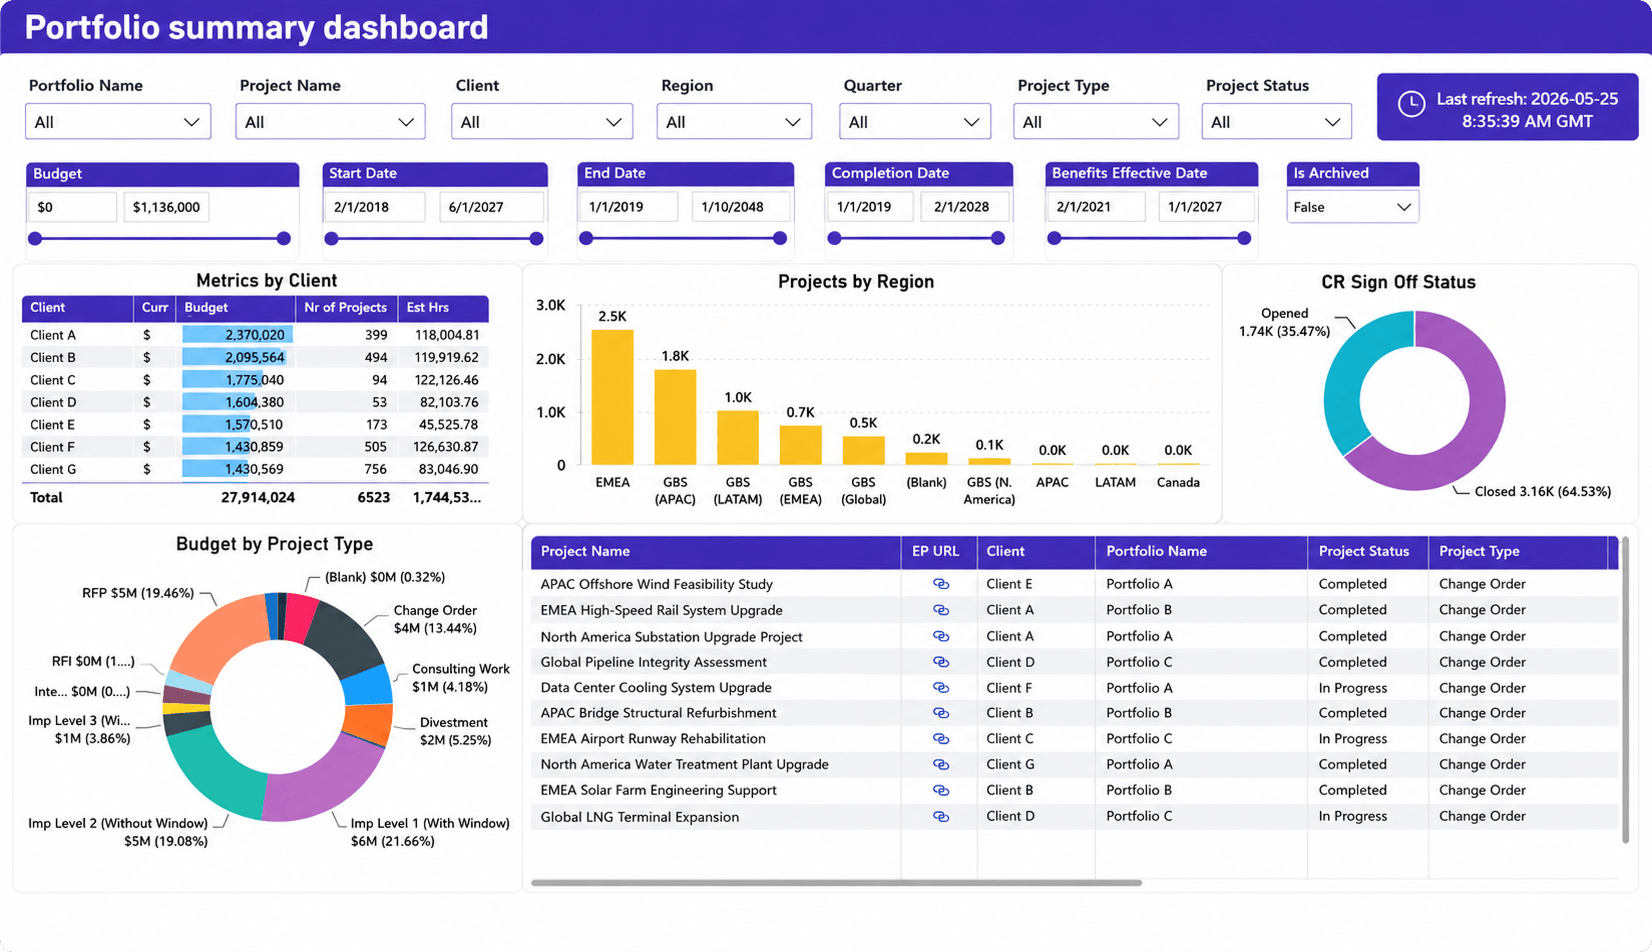
How many projects are active? Which clients generate the most work? Which regions or practice areas are growing fastest? A portfolio summary dashboard answers these questions from a single view.
Operations leaders, principals, and PMO teams can use this dashboard to:
- Monitor project status across the entire portfolio
- Analyze budgets by client, project type, or region
- Track project distribution across offices and markets
- Identify high-value clients and project segments
- Review project approval and sign-off progress
- Support executive reporting with portfolio-level data
Why it matters for architecture firms: Architecture firms often manage dozens of projects simultaneously. A portfolio dashboard helps leadership prioritize investments, monitor performance, and make decisions based on portfolio-wide trends.
Staff utilization dashboard
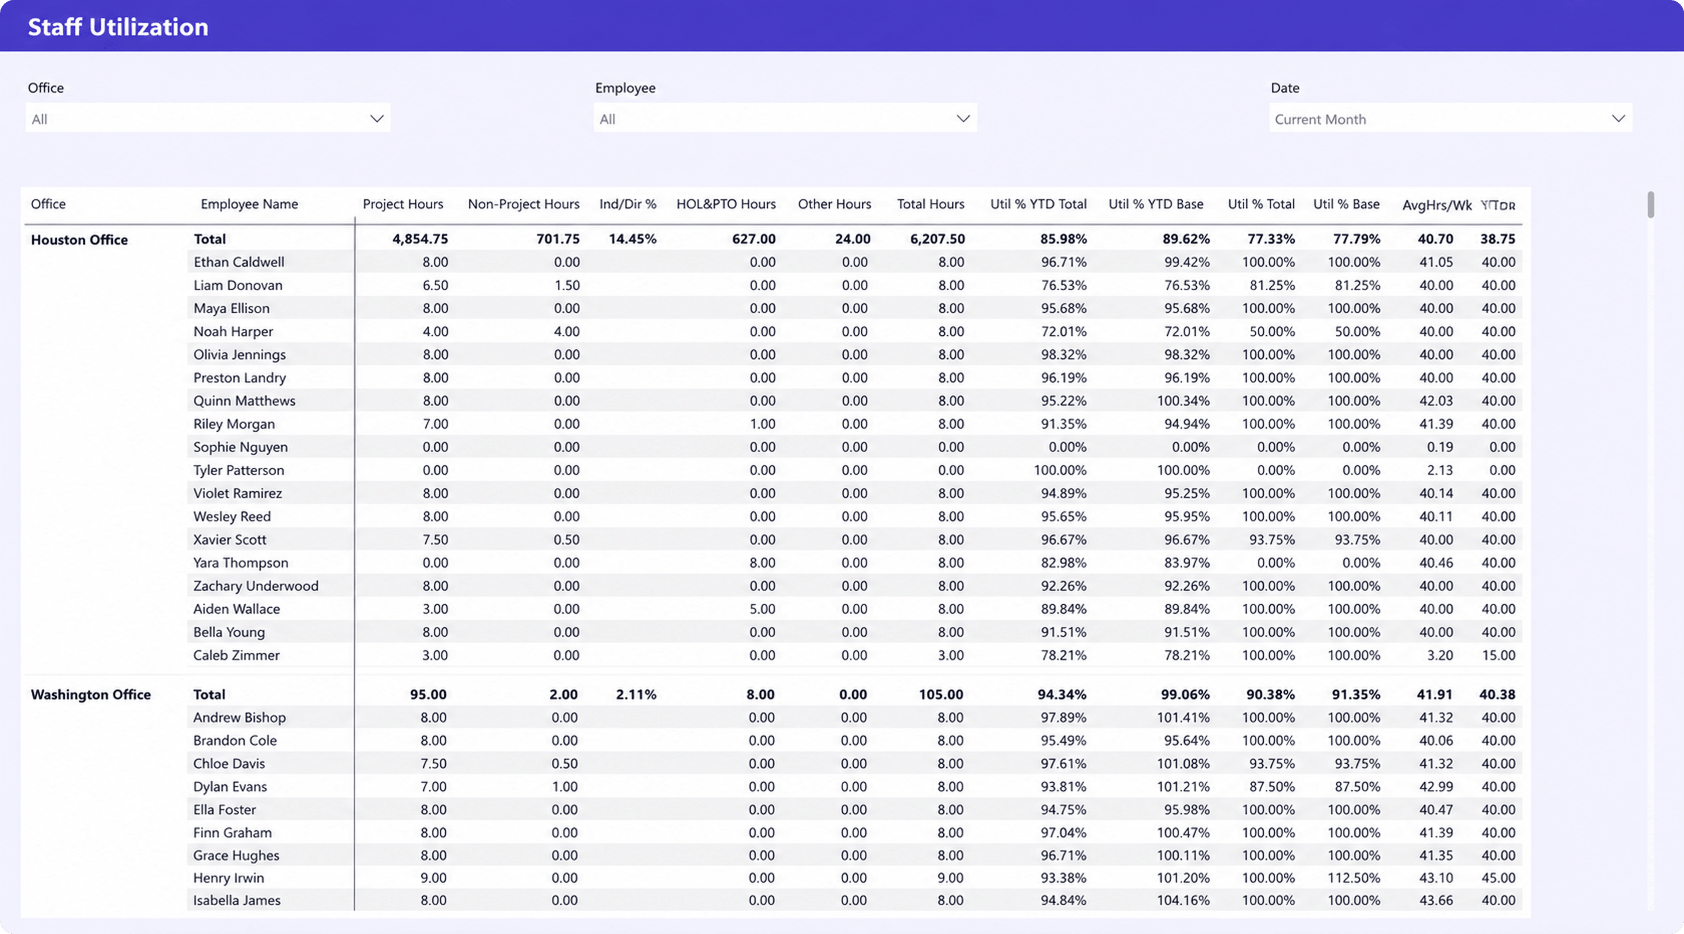
Firm-wide utilization can look healthy while some teams are overloaded and others have excess capacity. A staff utilization dashboard helps uncover those differences by showing utilization at the office, team, and individual level.
Operations leaders and resource managers can use this dashboard to:
- Monitor utilization performance across offices and teams
- Compare actual utilization against firm targets
- Identify employees who are consistently underutilized or overloaded
- Analyze the balance between project and non-project work
- Track availability and workload trends by location
- Support staffing and resource allocation decisions with real utilization data
Why it matters for architecture firms: Multi-office architecture firms need visibility into how work is distributed across the organization. This dashboard helps improve utilization while maintaining sustainable workloads.
Project score card
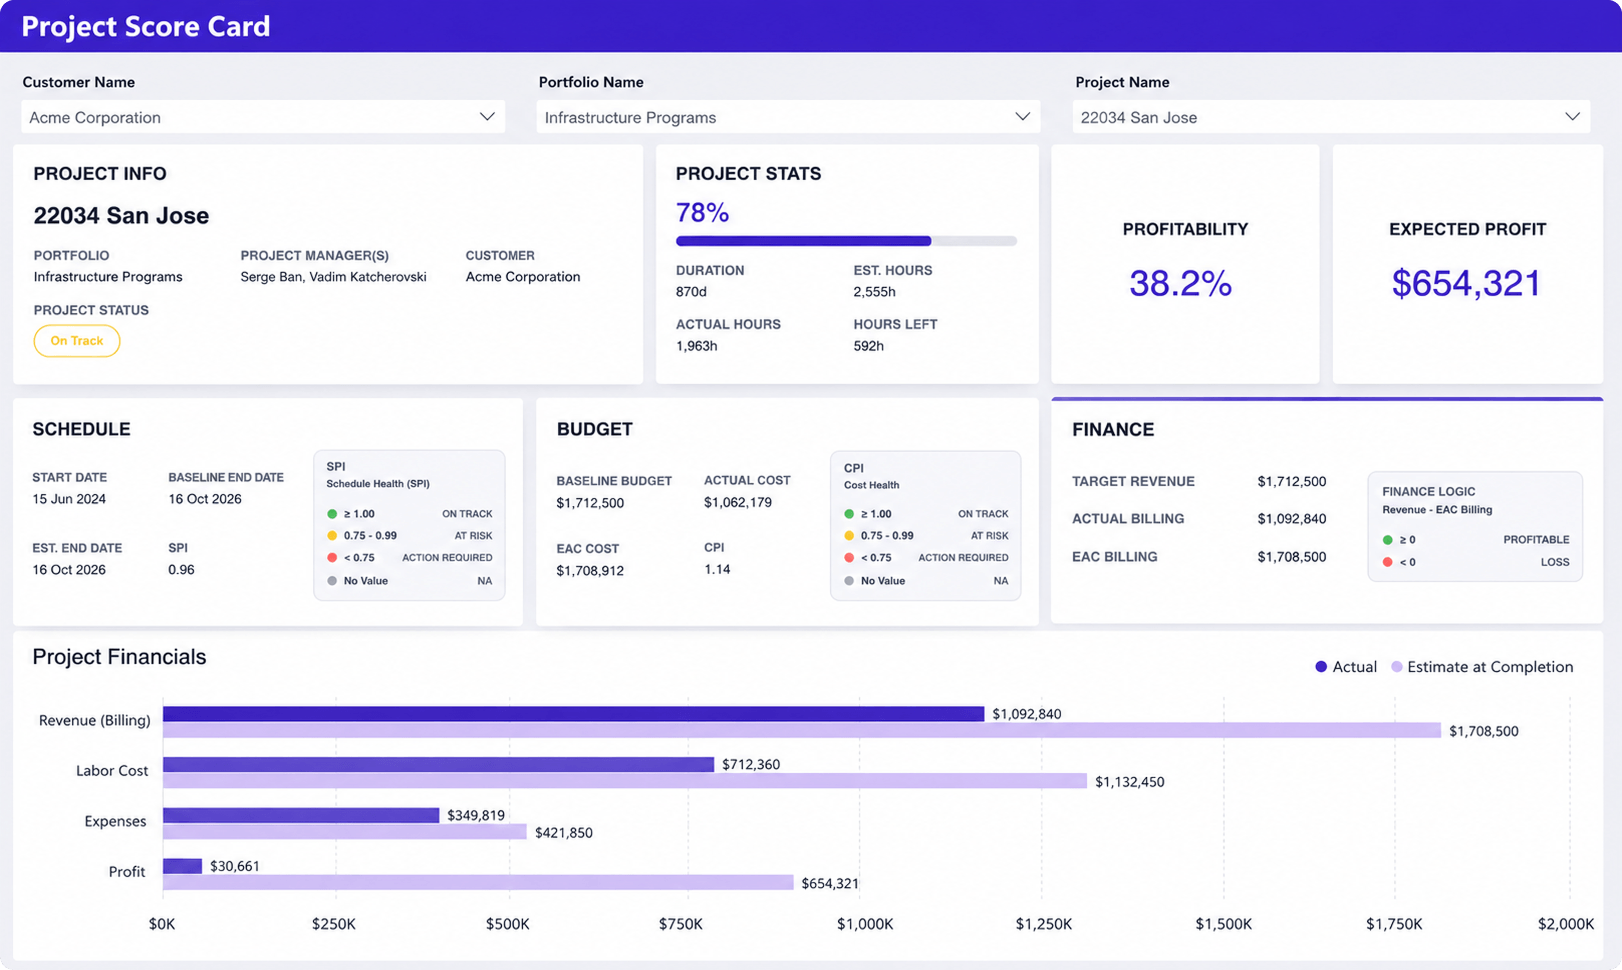
Project managers often need to know one thing quickly: is the project healthy? A project scorecard brings schedule, budget, effort, and financial metrics together so problems can be identified before they become client issues.
Project managers, operations leaders, and principals can use this dashboard to:
- Monitor project progress against planned schedules
- Compare actual hours with estimated effort
- Track project profitability and expected profit
- Evaluate budget and cost performance
- Review revenue, billing, and financial forecasts
- Identify projects that require corrective action before issues escalate
Why it matters for architecture firms: Small delays, budget overruns, and scope changes can significantly affect project margins. This dashboard helps teams address problems before they impact financial results.
Executive dashboard
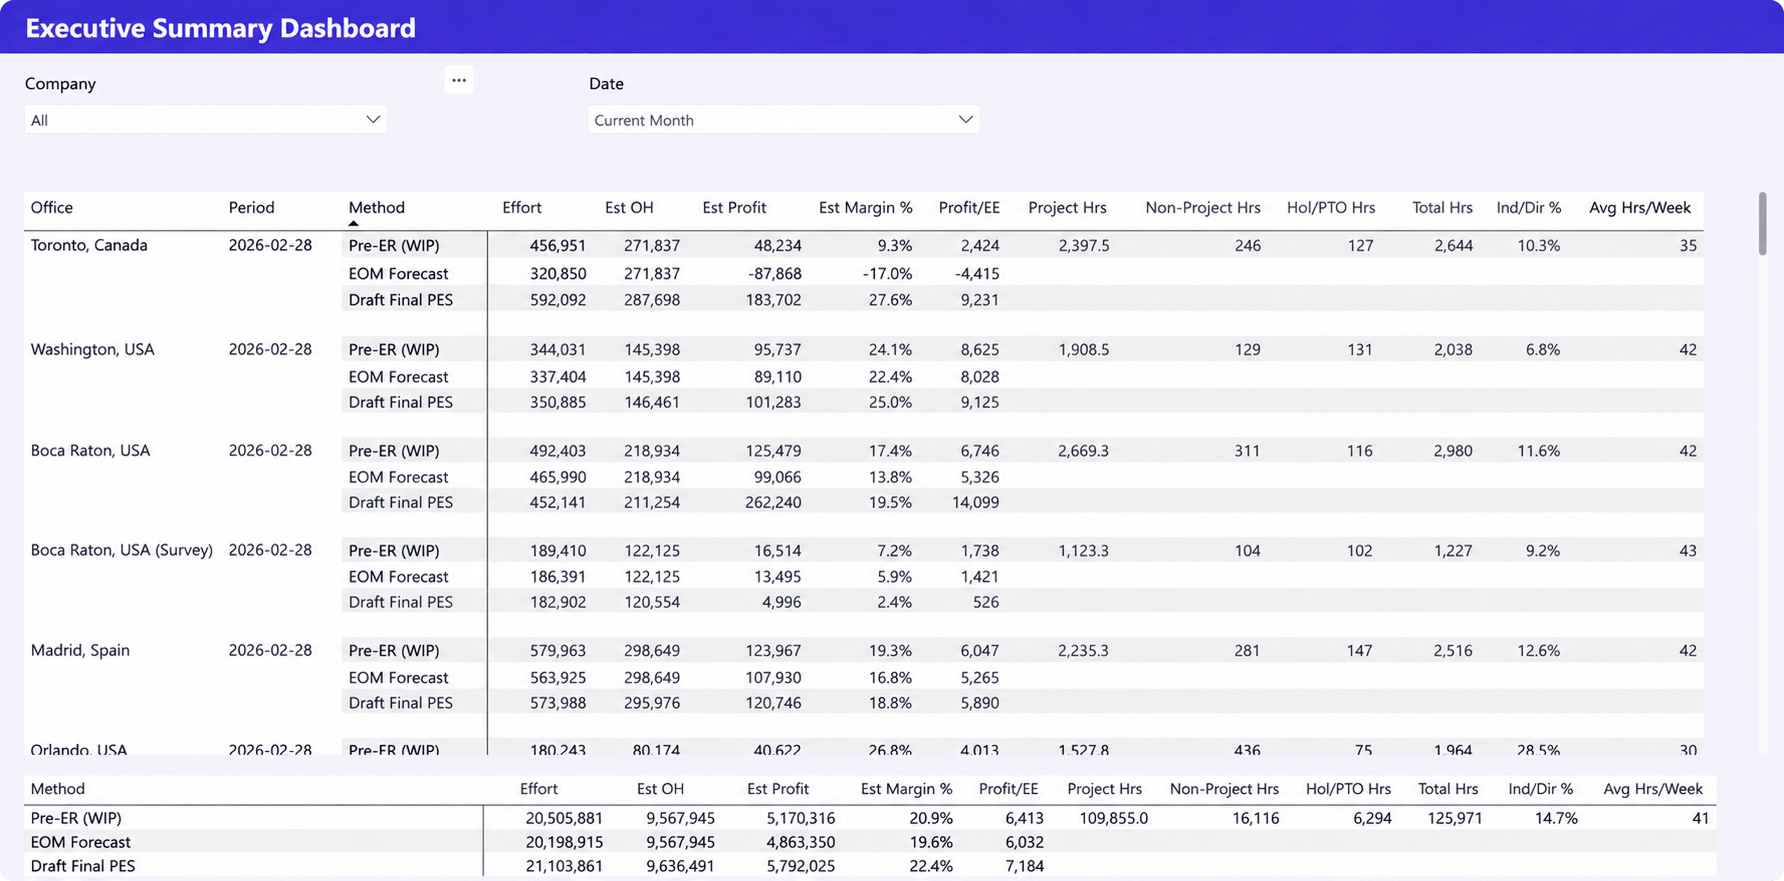
Principals and operations leaders rarely need task-level detail. They need a clear view of revenue, profitability, utilization, and delivery performance across the business. An executive dashboard consolidates these metrics into a single report.
Principals, operations leaders, and executive teams can use this dashboard to:
- Monitor financial performance across offices and regions
- Compare forecasted revenue, profit, and margins
- Track utilization and workload at the organizational level
- Analyze the balance between project and non-project work
- Identify high-performing and underperforming business units
- Support strategic planning and resource investment decisions
Why it matters for architecture firms: As architecture firms grow, leadership needs visibility beyond individual projects. This dashboard supports strategic planning by connecting financial, operational, and resource data.
Profit forecast dashboard
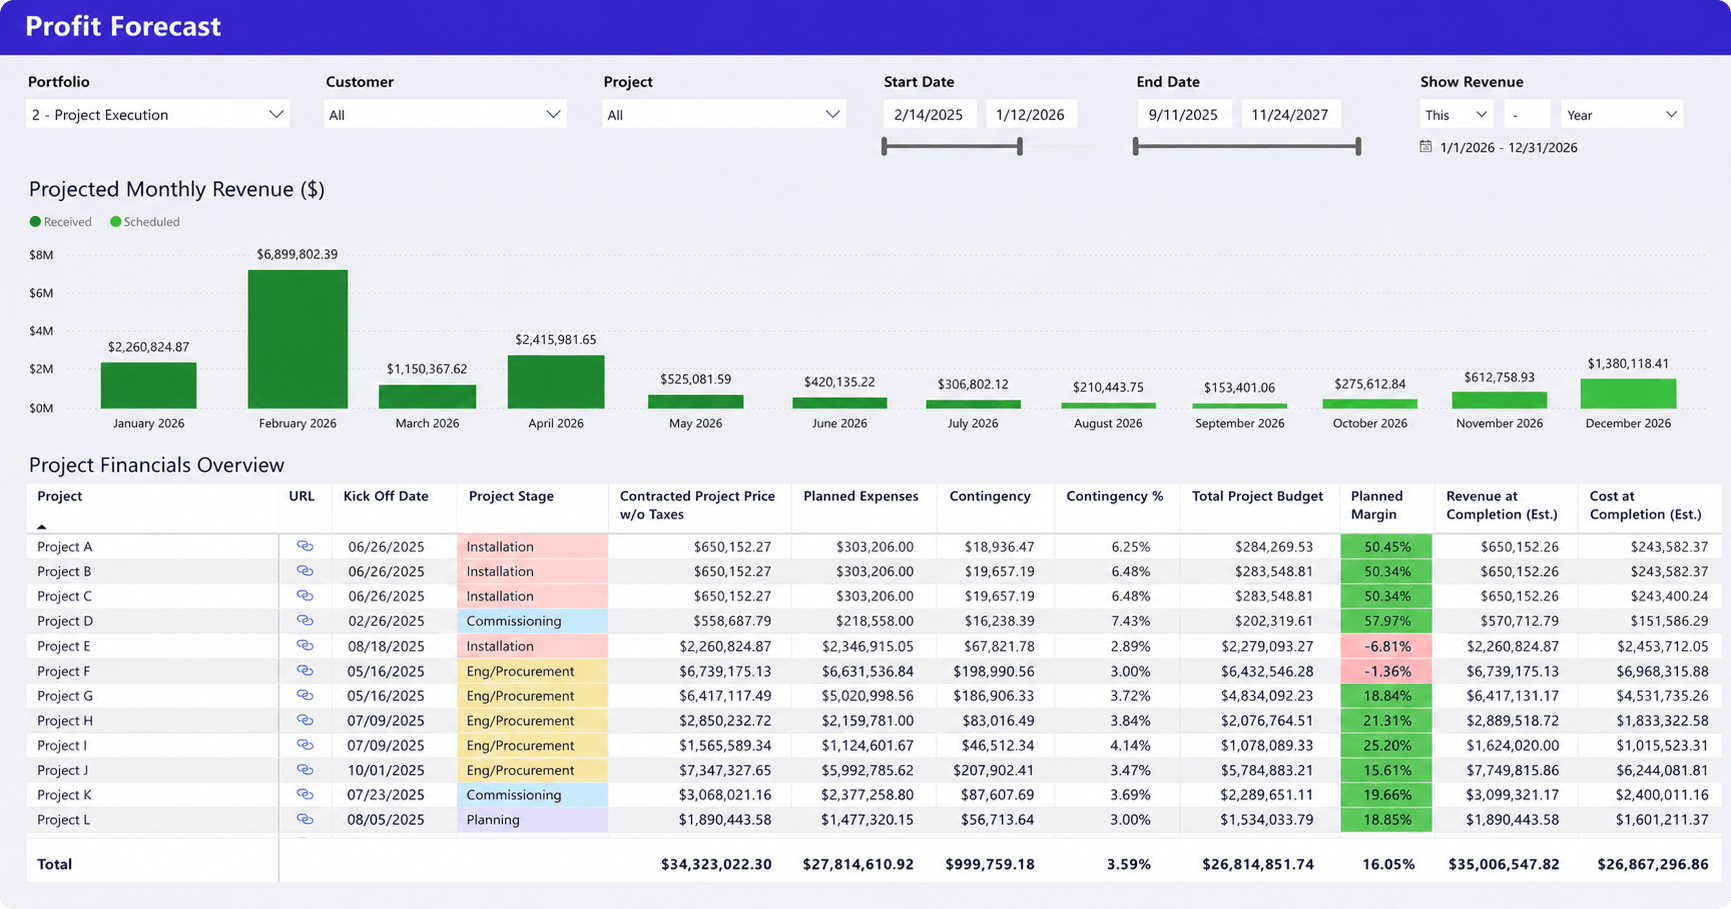
A profitable project today is not always a profitable project at completion. A profit forecast dashboard helps firms understand how current staffing, budgets, and project performance are likely to affect future margins.
Principals, finance teams, and operations leaders can use this dashboard to:
- Forecast future project revenue and profitability
- Compare projected margins across projects and portfolios
- Identify projects with declining profit expectations
- Monitor estimated revenue and costs at completion
- Evaluate the financial impact of budget changes and contingencies
- Support portfolio planning using projected financial performance
Why it matters for architecture firms: Scope changes, staffing adjustments, and budget shifts can significantly affect project margins. This dashboard helps firms identify risks early and protect profitability across the portfolio.
The most important KPIs for architecture firms
Many architecture firms collect dozens of metrics. Only a handful consistently influence operational decisions.
Utilization rate
Utilization measures how effectively project resources are used. Many firms target utilization ranges between 70% and 85%, although optimal levels vary depending on project mix and business model.
Capacity availability
Capacity availability shows how much future work the team can realistically absorb. This KPI becomes especially important during growth periods.
Backlog
Backlog represents contracted work that has not yet been completed. For architecture firms, backlog is often one of the strongest indicators of future revenue and staffing demand because it shows how much work is already committed for upcoming project phases.
Project profitability
Profitability remains one of the most important business metrics because project activity alone does not guarantee financial success. A busy team can still deliver unprofitable projects.
Resource forecast accuracy
Forecast accuracy measures how closely resource plans match actual demand. Poor forecast accuracy often leads to hiring delays, resource shortages, and inconsistent utilization.
Project schedule performance
Schedule performance shows whether projects are progressing according to planned timelines. Consistent schedule delays often indicate resource constraints or planning issues elsewhere in the organization.
Why architecture firms struggle with reporting
Most reporting problems start with fragmented and unreliable data rather than the dashboards themselves.
Common challenges include:
- Resource planning in spreadsheets: Multiple versions of the truth, manual updates, limited forecasting capabilities, and growing reporting effort as project volume increases.
- Disconnected systems: Project schedules, time tracking, financials, and resource plans often live in separate tools, making reporting a manual process.
- Time-consuming reporting: Operations leaders spend significant time gathering, validating, and reconciling data before reports can be produced.
- Assumption-based capacity planning: Staffing decisions are often made without reliable portfolio-level visibility into future resource demand.
When project, resource, and financial data are disconnected, reporting becomes slower, forecasting becomes less reliable, and resource decisions become harder to make with confidence.
How dashboards improve planning and capacity management
Good dashboards do more than display information. They help architecture firms make better staffing, forecasting, and delivery decisions.
Earlier visibility into resource shortages
Resource shortages rarely appear suddenly. They typically develop as project demand increases, making dashboards valuable for identifying capacity risks before delivery commitments are affected.
Better workload balancing
Workload balancing becomes easier when managers can see allocations across teams rather than within individual projects. This helps reduce resource conflicts while preventing some employees from becoming overloaded.
Improved forecasting
Forecasting becomes more reliable when project pipeline data, resource plans, and utilization trends are analyzed together. This provides a more realistic view of future staffing requirements and capacity constraints.
Faster executive reporting
Leadership teams need timely information to make informed decisions. Automated dashboards reduce reporting effort while improving consistency and accuracy, allowing leaders to focus on action rather than data collection.
Reliable dashboards require reliable project and resource data
Dashboard quality depends on data quality. When project planning, resource management, time tracking, and financial data live in separate systems, reporting becomes slower and less reliable.
The most effective reporting environments connect these data sources, allowing dashboards to support operational decisions rather than simply report on past performance.
For example, some firms use platforms such as Birdview PSA to combine project planning, resource forecasting, time tracking, and reporting data. This allows utilization, capacity, project performance, and financial dashboards to draw from the same source rather than multiple spreadsheets and disconnected applications.
When project and resource data remain connected, dashboards become operational tools rather than reporting exercises.
Final thoughts
Architecture firms succeed when they balance project delivery, resource utilization, staffing capacity, and financial performance simultaneously.
The most valuable resource dashboards for architecture firms are not necessarily the most complex. They are the dashboards that help leaders answer practical questions about workloads, capacity, profitability, and future demand.
When project, resource, and financial data are connected, architecture leaders gain the visibility needed to make better staffing decisions, improve forecasting accuracy, and support sustainable growth.
If your reporting process still depends heavily on spreadsheets and manual consolidation, reviewing how project and resource data is collected may deliver more value than adding another dashboard.
FAQ
What should an architecture dashboard include?
An architecture dashboard should combine project performance, resource utilization, capacity planning, workload distribution, financial metrics, and forecasting indicators. The most useful dashboards connect operational and business data rather than reporting on projects alone.
How do architecture firms track resource utilization?
Most architecture firms compare allocated or billable hours against available working hours. Resource utilization dashboards help identify underutilized staff, overloaded teams, and future capacity constraints.
What KPIs matter most for architecture firms?
The most important KPIs typically include utilization rate, capacity availability, project profitability, project backlog, schedule performance, and forecast accuracy. Together, these metrics provide visibility into both delivery performance and business health.
How do dashboards improve capacity planning?
Dashboards improve capacity planning by comparing future project demand against available resources. This helps firms identify staffing shortages, hiring needs, and allocation conflicts before they affect project delivery.
Can project and resource data be combined in one dashboard?
Yes. Many architecture firms combine project schedules, resource plans, utilization metrics, time tracking, and financial data into a single reporting environment. This provides a more complete view of portfolio performance and future resource demand.