Leonid Kostin
 - Power BI dashboards help consulting firms combine project, resource, financial, and time-tracking data into a single reporting environment that supports operational and strategic decision-making.
- Resource utilization, profitability, capacity planning, forecasting, and portfolio performance dashboards provide visibility into the factors that most directly affect consulting firm growth and profitability.
- Capacity planning and resource forecasting dashboards help firms align hiring, staffing, and project commitments with future demand before shortages affect delivery.
- Profitability dashboards help leaders identify margin erosion early by connecting project delivery performance with budgets, costs, revenue, and forecasted outcomes.
- Business development dashboards improve forecasting by connecting proposal activity, pipeline performance, and future resource demand.
- The most effective reporting environments rely on connected project, resource, financial, and time-tracking data rather than spreadsheets and disconnected systems.
Power BI dashboards for consulting firms help transform project, resource, financial, and time-tracking data into actionable insights. The best dashboards allow consulting leaders to monitor utilization, profitability, capacity, forecasting, and project delivery performance in one place instead of relying on spreadsheets and disconnected reports.
For many consulting firms, reporting is no longer the challenge. The challenge is turning large amounts of operational data into decisions. Leaders need to know whether teams are fully utilized, which projects are profitable, when hiring is required, and whether revenue forecasts remain realistic. Well-designed dashboards answer those questions quickly.
Why consulting firms rely on dashboards for operational visibility
Consulting businesses are built around people. Revenue depends on how effectively firms manage utilization, staffing, project delivery, and client relationships. Dashboards provide visibility into these areas and help leaders identify risks before they affect profitability.
Many consulting firms experience similar reporting challenges as they grow.
- Utilization uncertainty often makes staffing decisions difficult. Managers may know their teams are busy but lack visibility into future availability.
- Fragmented reporting creates delays. Project data may sit in one system, financial data in another, and resource planning in spreadsheets.
- Disconnected project and financial data makes profitability difficult to measure. Teams can track project progress without understanding whether the work remains financially healthy.
- Forecasting difficulties become more common as firms scale. Sales pipelines, resource plans, and project schedules frequently change, making manual forecasts unreliable.
- Limited executive visibility prevents leadership teams from seeing portfolio performance at a glance. By the time monthly reports are compiled, the information is often outdated.
These challenges explain why consulting firms increasingly invest in consulting business intelligence and reporting environments that combine operational and financial data.
What makes a good consulting dashboard?
A good dashboard helps consulting leaders make decisions, not just review metrics. The most effective dashboards combine operational and financial data to provide visibility into utilization, profitability, capacity, project performance, and future demand.
Key characteristics of a strong consulting dashboard include:
- Actionable KPIs that support staffing, delivery, and financial decisions
- Connected operational and financial data that links project performance to profitability
- Portfolio-level visibility across projects, clients, and teams
- Forecasting capabilities that highlight future resource and revenue trends
- Executive-level reporting that summarizes business performance without overwhelming users with detail
The best consulting dashboards help leaders understand not only what is happening today, but also what is likely to happen next.
Top 9 Power BI dashboards for consulting firms
Consulting firms typically need more than one dashboard to understand business performance. While utilization may be the most closely watched metric, leaders also need visibility into profitability, capacity, forecasting, project delivery, and service performance.
The most effective reporting environments combine several specialized dashboards, each designed to answer a different operational question. Together, these dashboards provide a complete view of consulting performance, from day-to-day resource management to long-term strategic planning.
| Dashboard | Primary purpose | Key KPIs |
| Resource utilization dashboard | Improve resource efficiency and workload balancing | Utilized %, available hours, actual hours, utilization targets, workload distribution |
| Project profitability dashboard | Track project financial performance | Profitability %, expected profit, revenue, project costs, budget performance |
| Capacity planning dashboard | Forecast staffing needs and resource availability | Available capacity, planned work, staffing gaps, planned hours, skills availability |
| Revenue recognition dashboard | Track earned revenue throughout project delivery | Recognized revenue, actual hours, revenue recognition %, billing value, cumulative revenue |
| Project portfolio dashboard | Monitor portfolio delivery performance | Project status, completion progress, portfolio budgets, project counts, delivery metrics |
| Resource forecasting dashboard | Compare future workforce demand against available capacity | Projected workload, available capacity, labor demand, staffing gaps, resource forecasts |
| Business development dashboard | Monitor pipeline health and future demand | Contracts won and lost, proposal value, proposal aging, hit rate, pipeline performance |
| Billable vs. non-billable dashboard | Measure workforce productivity and utilization | Billable hours, non-billable hours, billable %, logged time, utilization trends |
| Service portfolio performance dashboard | Analyze profitability and performance of service offerings | Revenue by service, margins, project volume, labor effort, service profitability |
Resource utilization dashboard
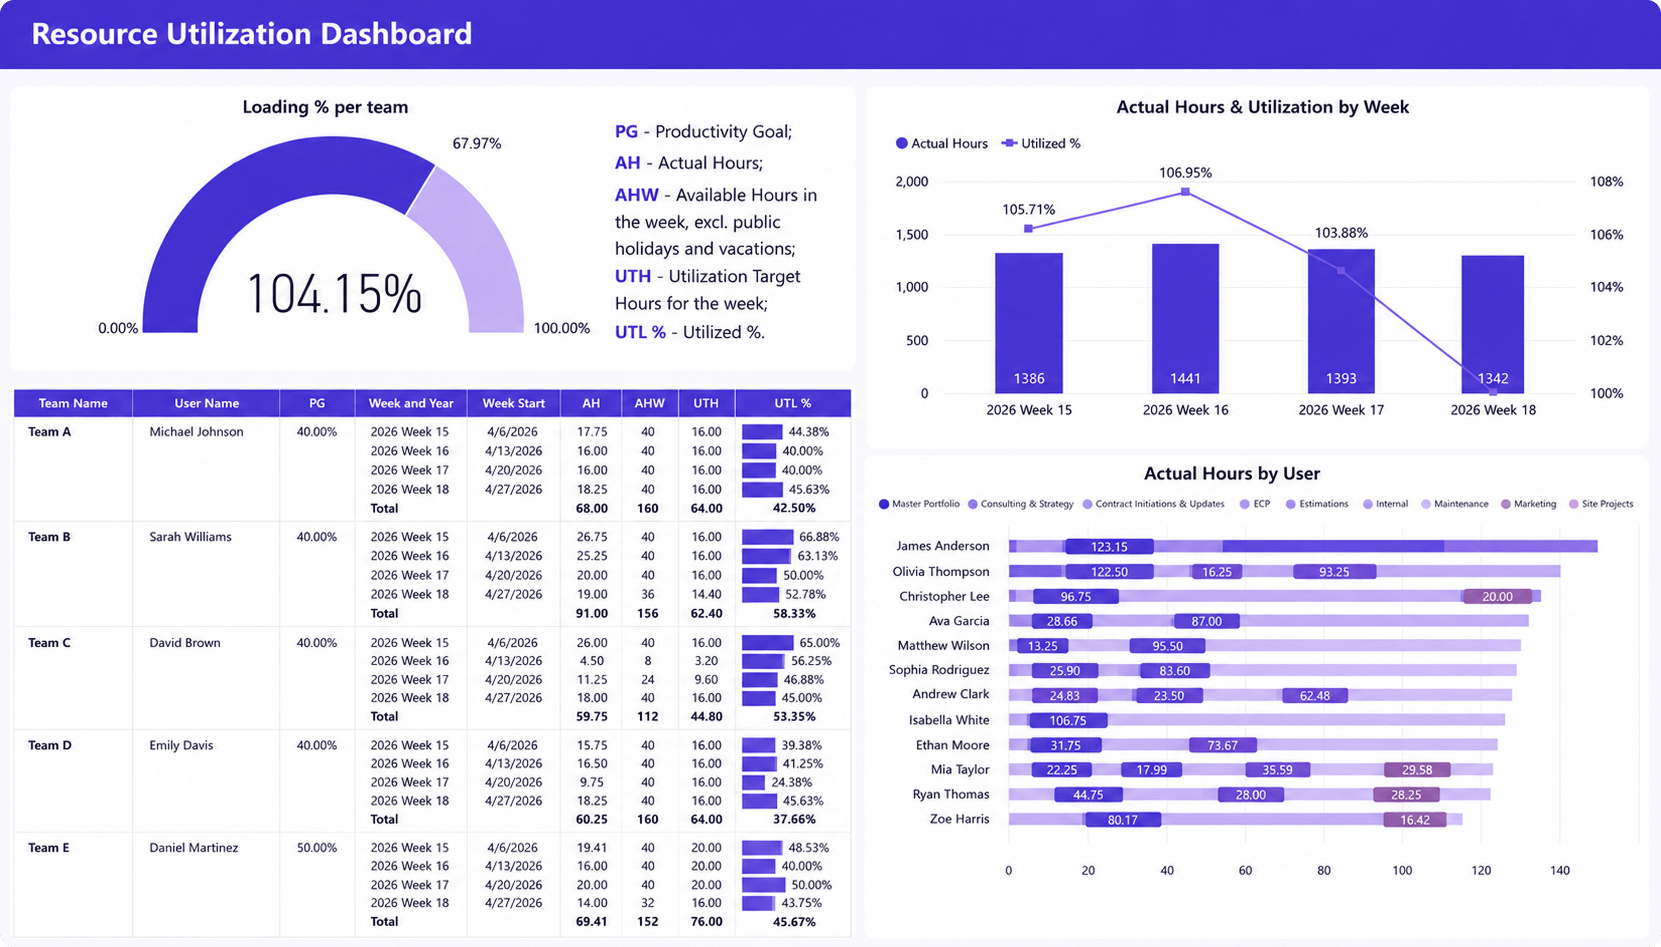
A resource utilization dashboard helps consulting firms understand how effectively their teams are being used. This dashboard combines utilization rates, available capacity, actual hours worked, and workload distribution to provide a clear view of resource performance across the organization.
What it shows
- Team utilization rates
- Actual versus available hours
- Weekly utilization trends
- Workload distribution by consultant
- Utilization targets and goals
Why it matters
Utilization directly affects consulting profitability. High utilization is not always a positive sign. Teams that consistently operate near full capacity often struggle to absorb new work, handle client changes, or cover unexpected absences. This dashboard helps leaders identify underutilized consultants, overloaded team members, and capacity gaps before they impact project delivery or revenue.
Consulting profitability dashboard
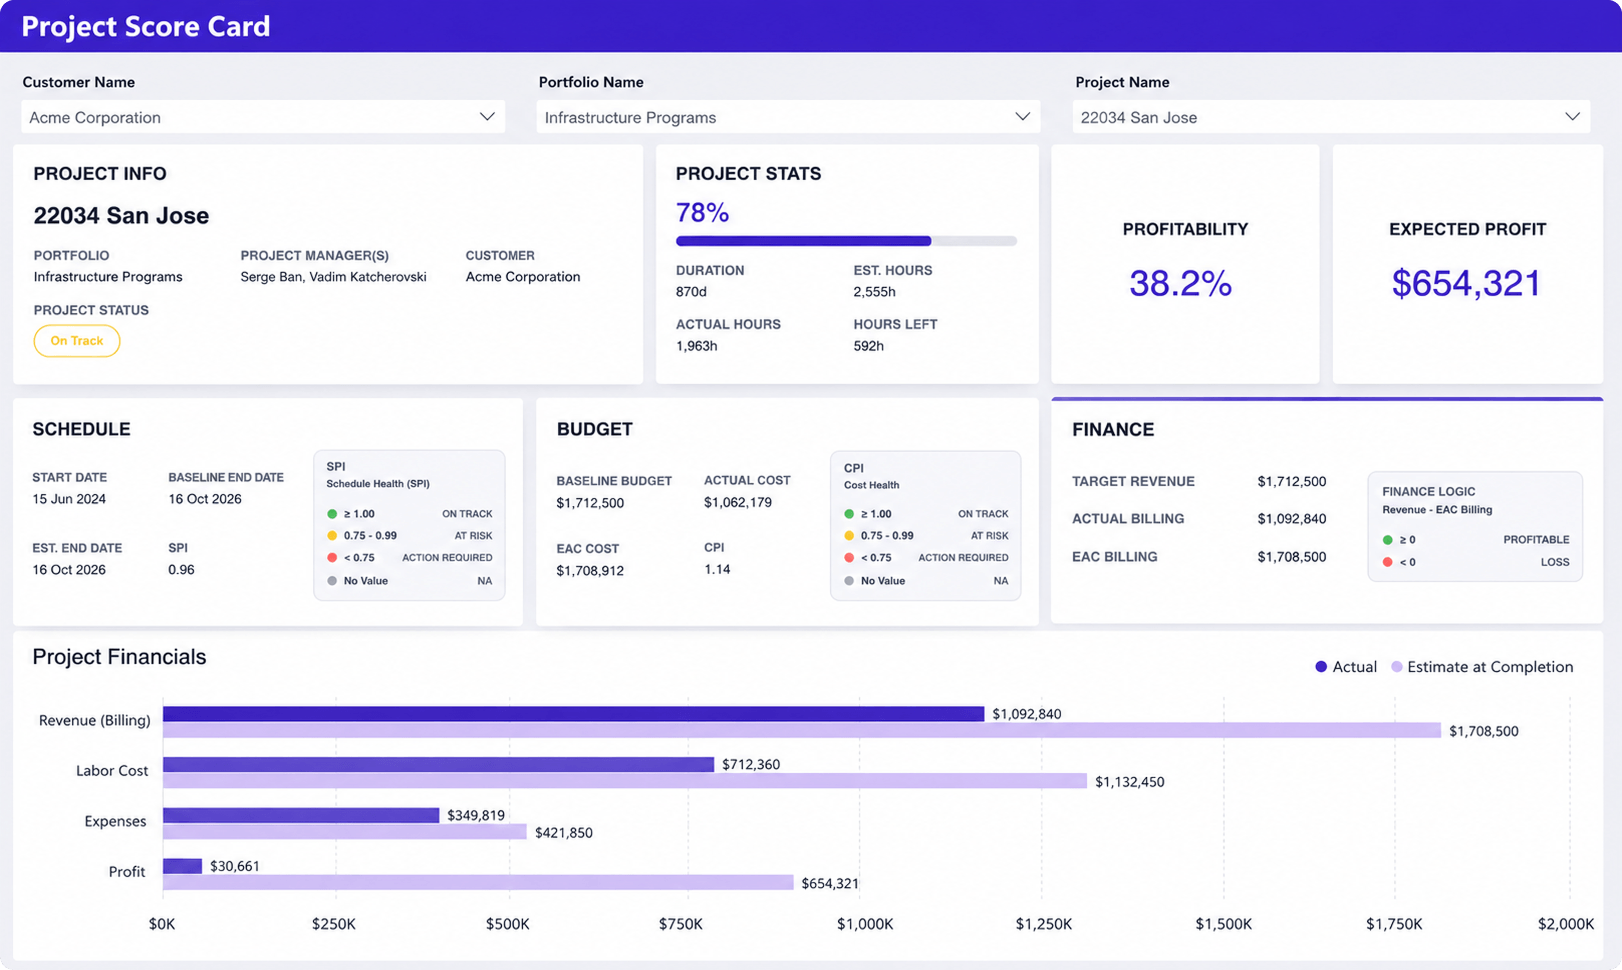
A project profitability dashboard helps consulting firms understand whether projects are delivering the expected financial results. For example, Birdview’s Project score card combines project performance, budget health, revenue, costs, and profit forecasts, providing a complete view of project financial performance.
What it shows
- Project profitability and expected profit
- Revenue, billing, and project costs
- Budget performance
- Schedule and cost health indicators
- Actual versus forecasted financial results
- Remaining hours and project progress
Why it matters
Projects can appear healthy from a delivery perspective while still underperforming financially. This dashboard helps leaders identify margin risks early, compare actual results against forecasts, and understand which projects contribute most to overall profitability. Profitability issues rarely appear suddenly. Small budget overruns, additional meetings, and unplanned client requests often reduce margins gradually throughout a project. Background on a full set of services KPIs sits in a separate guide.
Capacity planning dashboard
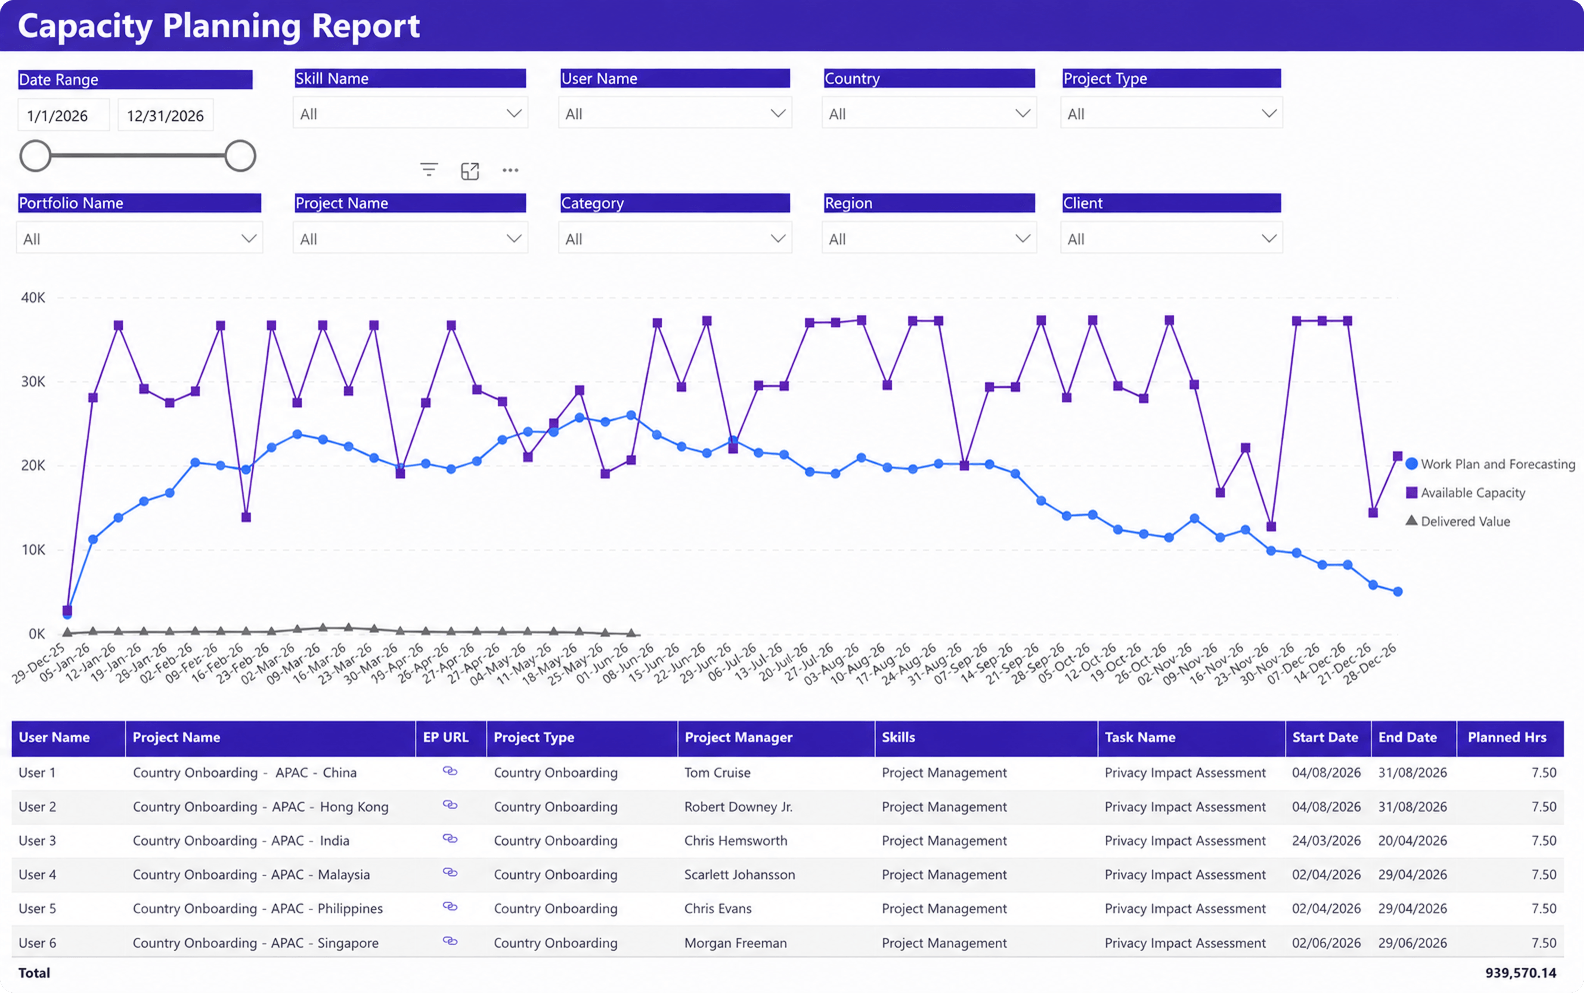
A capacity planning dashboard helps consulting firms compare future demand against available resources. By combining planned work, available capacity, and project schedules, it provides visibility into upcoming staffing needs and potential resource shortages.
What it shows
- Available capacity versus planned work
- Future workload and demand trends
- Resource allocation by project
- Skills and role availability
- Project schedules and planned hours
- Capacity gaps across teams or regions
Why it matters
Many consulting firms struggle to see resource shortages until projects are already underway. This dashboard helps leaders identify capacity constraints early, improve staffing decisions, and align hiring plans with forecasted demand. In many consulting firms, hiring decisions take weeks or months to execute. Visibility into future demand is often more valuable than understanding current utilization.
Revenue recognition dashboard
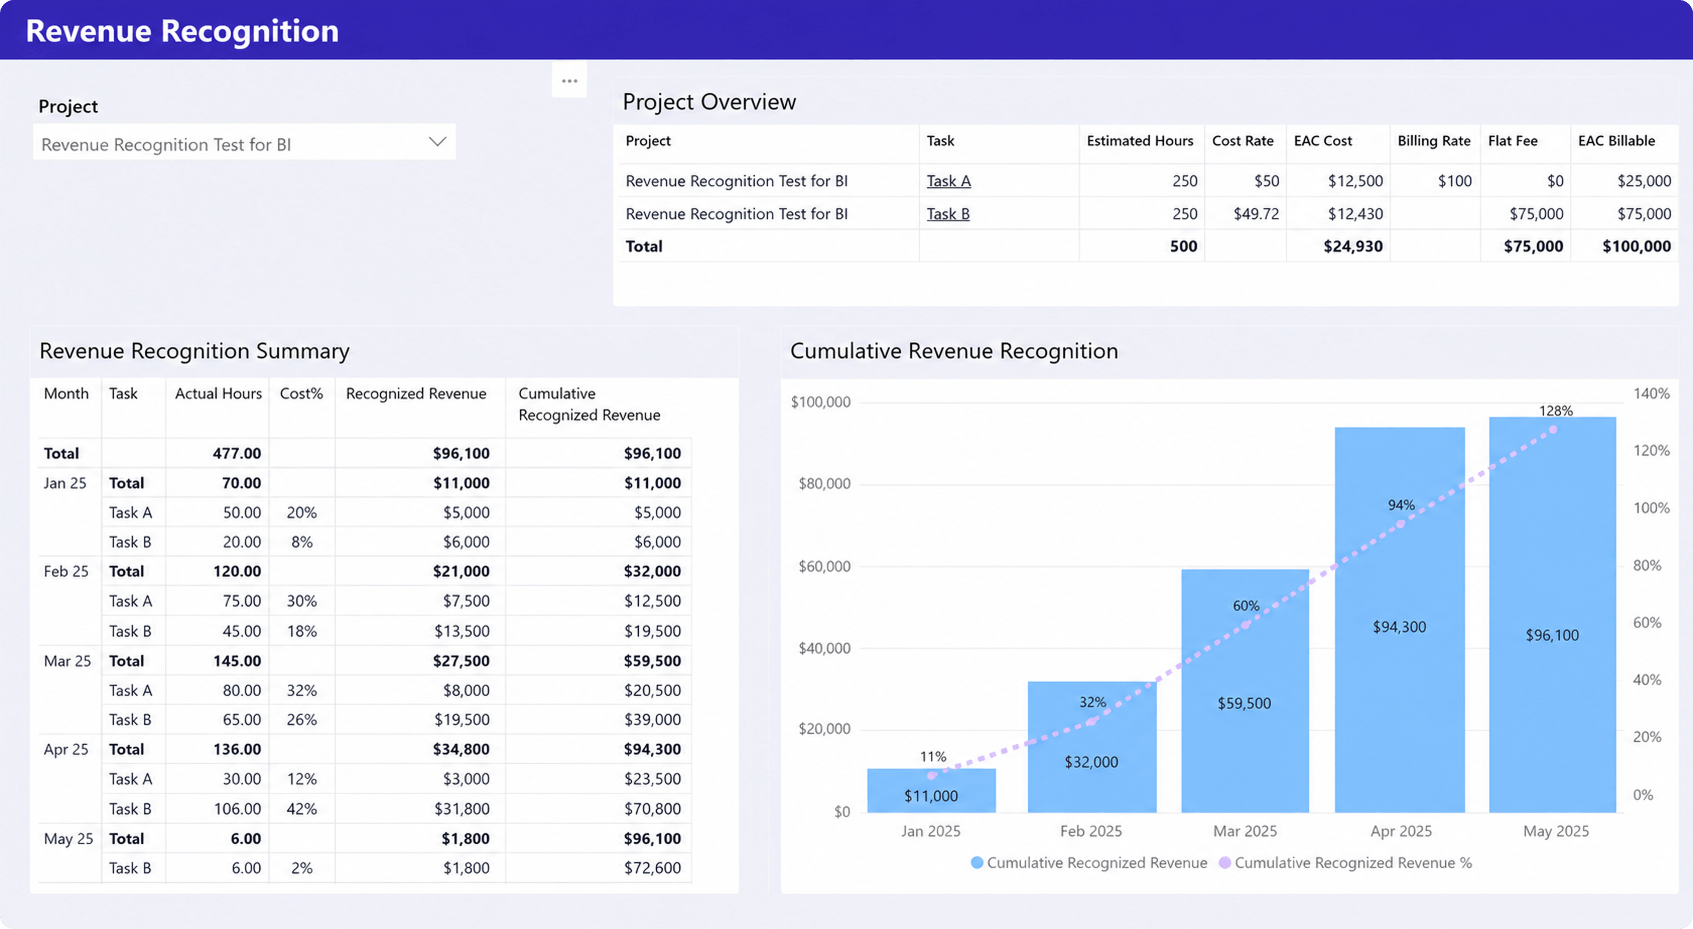
A revenue recognition dashboard helps consulting firms track how project revenue is earned and recognized over time. It connects project progress, actual effort, billing data, and recognized revenue to provide a clearer picture of financial performance throughout the project lifecycle.
What it shows
- Recognized revenue by project and period
- Actual hours and project progress
- Revenue recognition percentages
- Estimated versus actual project values
- Billing rates, costs, and project revenue
- Cumulative recognized revenue trends
Why it matters
For fixed-fee and long-term consulting projects, revenue is often recognized gradually rather than when invoices are issued. This dashboard helps finance and operations teams monitor earned revenue, improve financial reporting accuracy, and understand how project delivery translates into recognized business performance. This becomes particularly important for fixed-fee and long-term engagements where project progress and invoicing schedules do not always align.
Project portfolio dashboard
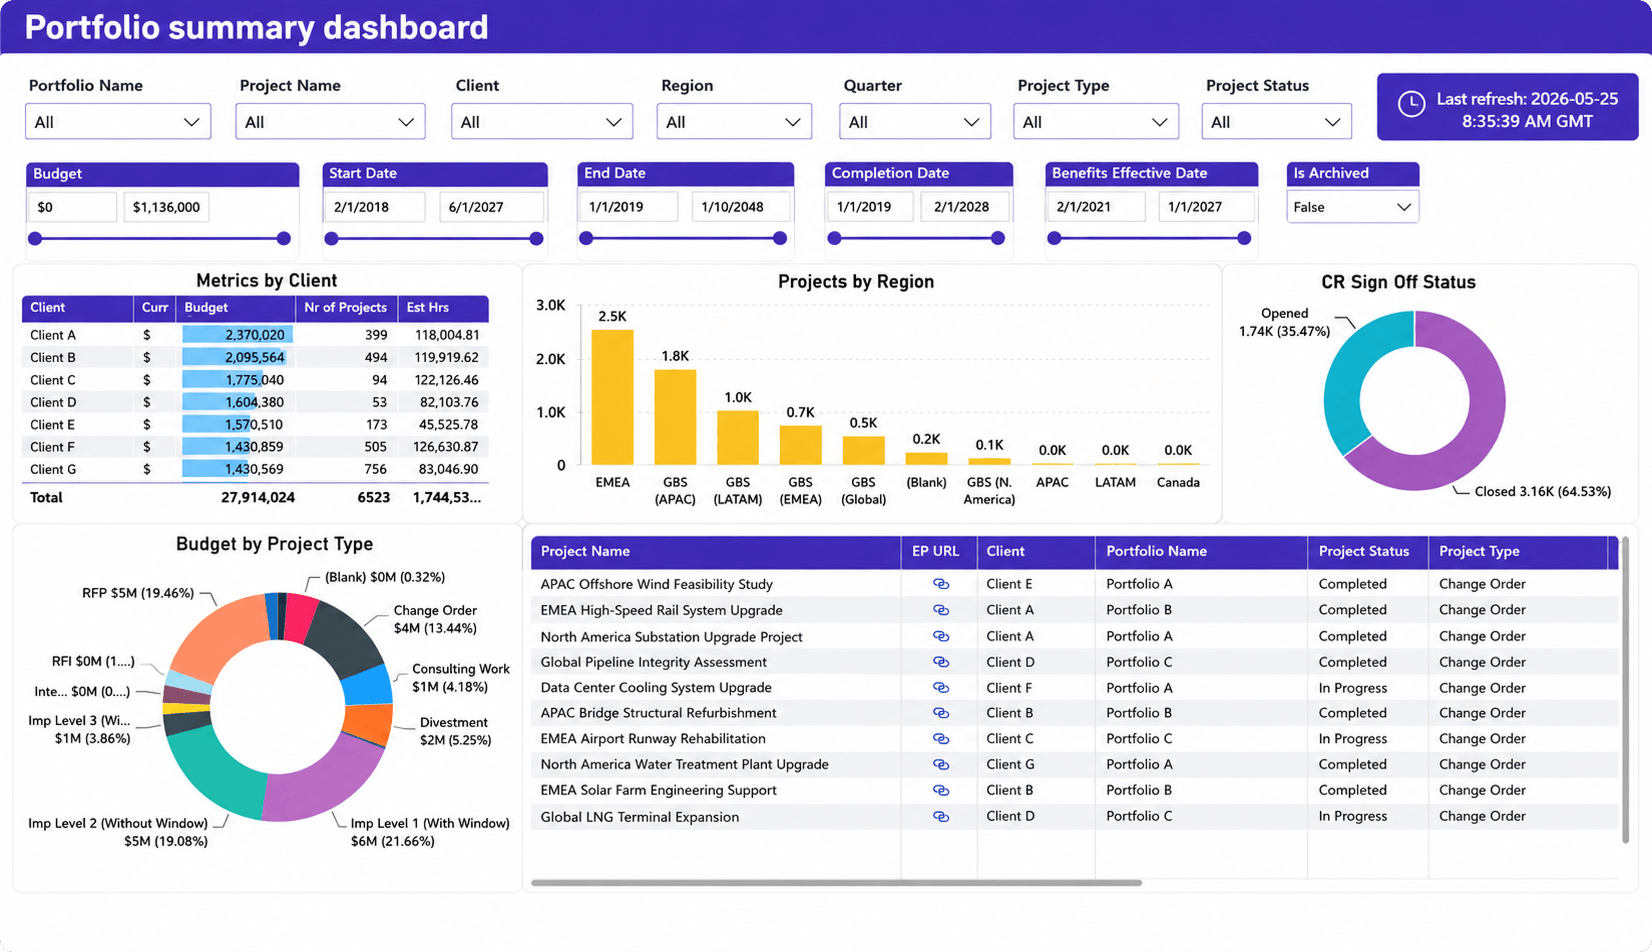
A project portfolio dashboard provides a high-level view of all projects across the organization. It combines project status, budgets, timelines, clients, and portfolio performance metrics to help leaders monitor delivery and prioritize investments.
What it shows
- Portfolio and project performance summaries
- Project status and completion progress
- Budget distribution across projects
- Projects by region, client, or portfolio
- Project counts and delivery metrics
- Portfolio-level financial and operational trends
Why it matters
As consulting firms grow, managing projects individually becomes difficult. This dashboard gives executives, PMO leaders, and operations teams a portfolio-wide view of delivery performance, helping them identify risks, track strategic initiatives, and make better prioritization decisions.
Resource forecasting dashboard
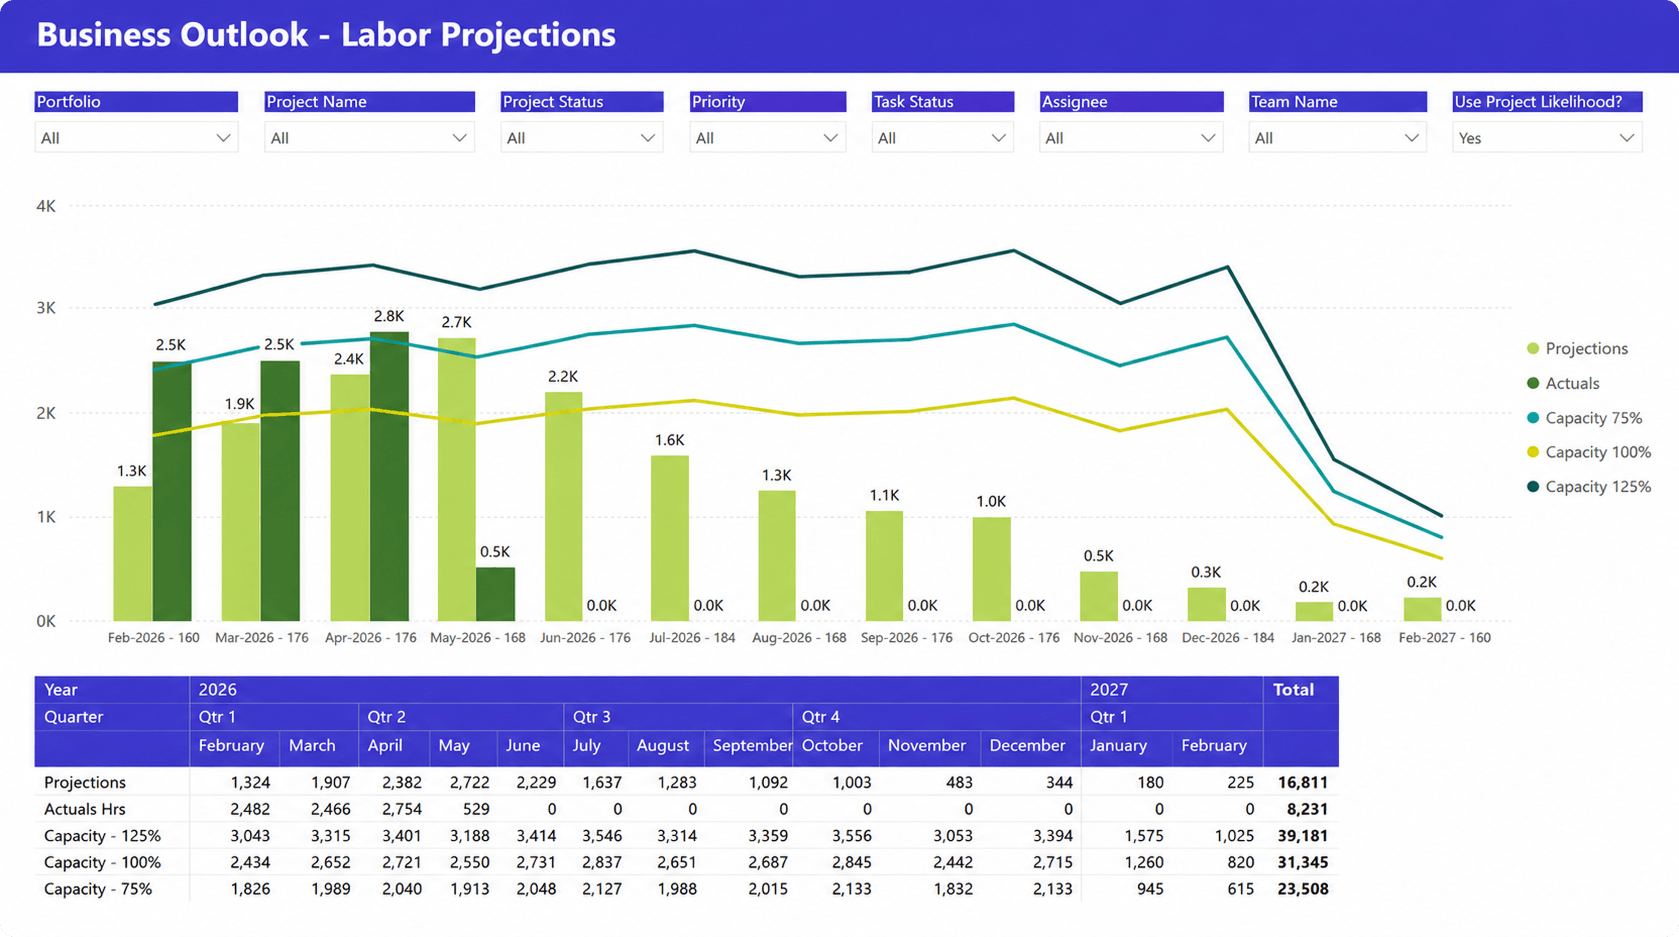
A resource forecasting dashboard helps consulting firms anticipate future workforce demand by comparing projected work against available capacity. For example, the Labor projections dashboard provides a forward-looking view of staffing requirements, helping leaders identify potential shortages or excess capacity before they affect project delivery.
What it shows
- Projected workload versus available capacity
- Future labor demand trends
- Resource capacity scenarios
- Planned versus actual labor requirements
- Upcoming staffing gaps
- Forecasted workload by period
Why it matters
Many consulting firms can see current utilization but struggle to predict future resource needs. This dashboard helps leaders align hiring, staffing, and project commitments with expected demand, reducing the risk of overstaffing, resource shortages, and missed delivery targets.
Business development dashboard
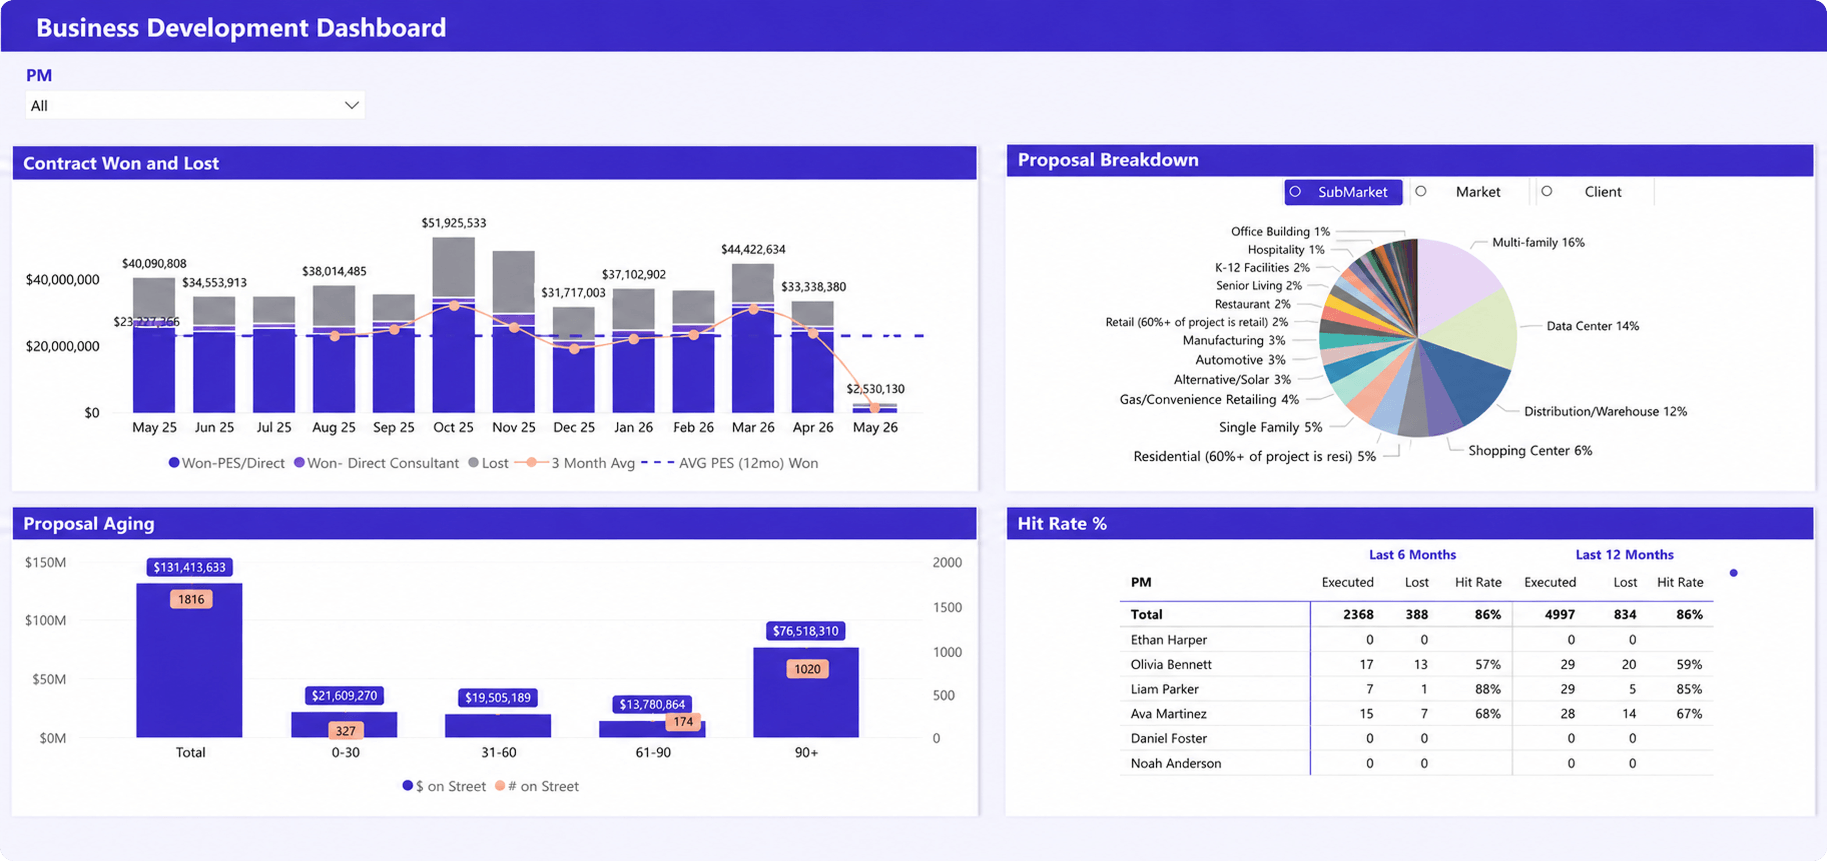
A business development dashboard helps consulting firms monitor pipeline performance, proposal activity, and future revenue opportunities. By tracking sales outcomes and proposal trends, it provides visibility into the work that will drive future utilization, revenue, and growth.
What it shows
- Contracts won and lost over time
- Proposal pipeline value
- Proposal aging and sales cycle trends
- Win rates and hit rates
- Opportunities by industry or market
- Business development performance by manager or team
Why it matters
Consulting firms cannot forecast resources and revenue accurately without understanding future demand. This dashboard helps leaders evaluate pipeline health, identify bottlenecks in the sales process, and understand whether enough work is being generated to support future growth and staffing plans. For consulting firms, pipeline visibility is not only a sales concern. It directly affects hiring decisions, resource forecasting, and future utilization levels.
Billable vs. non-billable dashboard
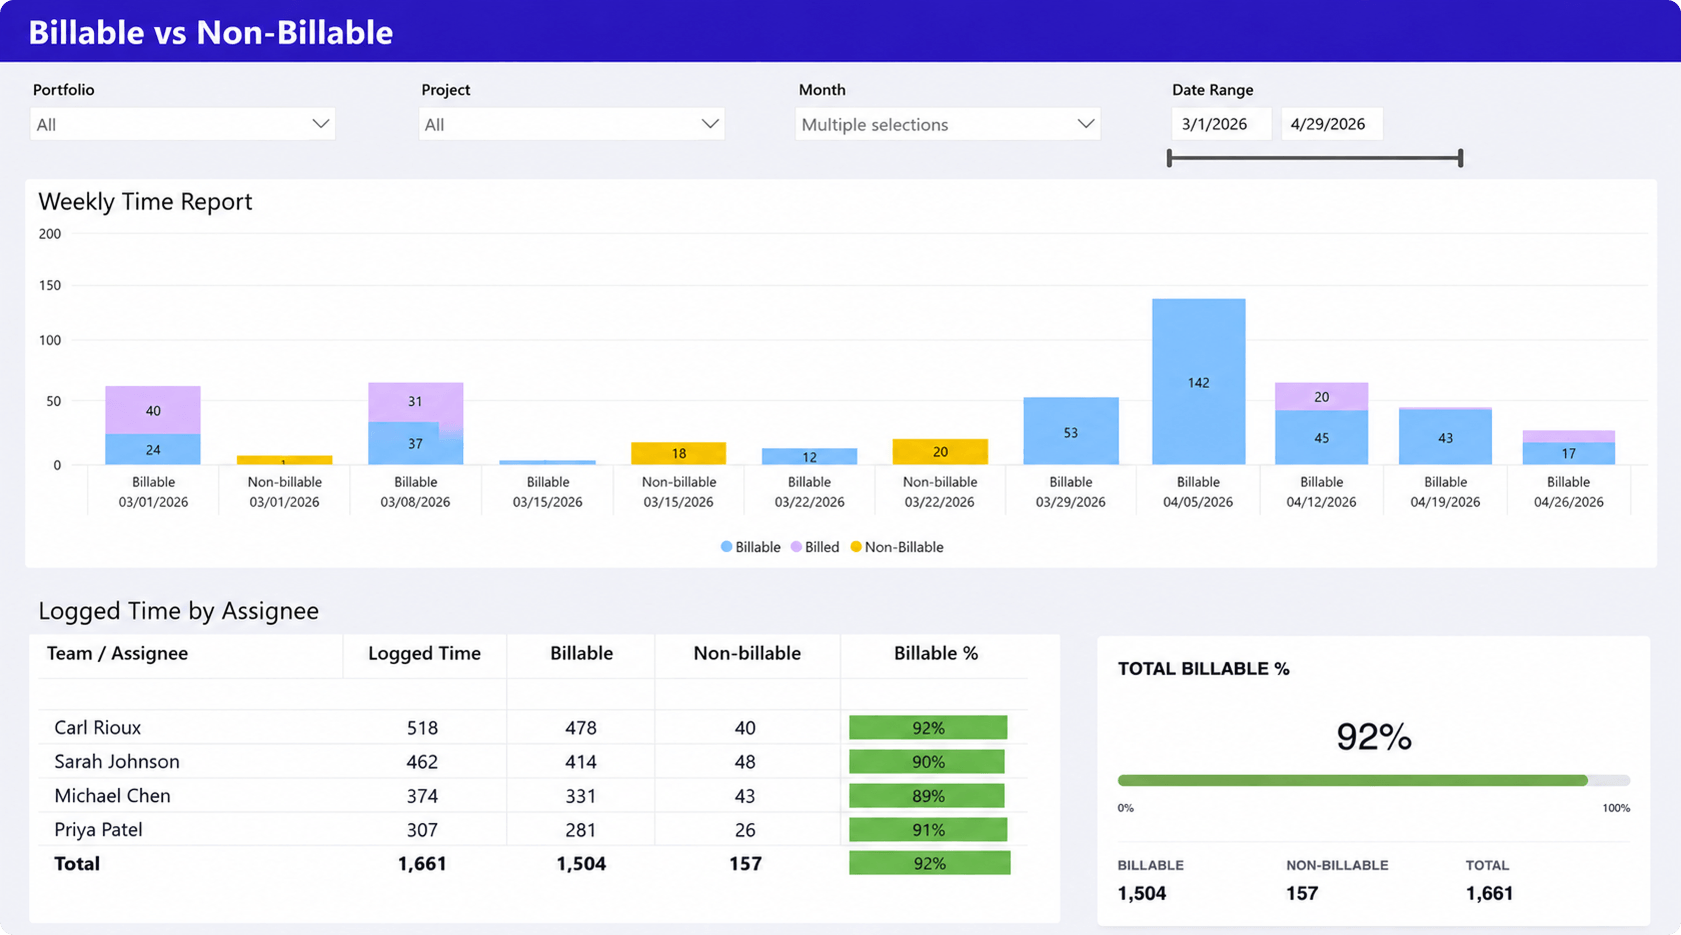
A billable versus non-billable dashboard helps consulting firms understand how employee time is being spent. By comparing billable and non-billable hours across teams and individuals, it provides insight into utilization performance and revenue-generating capacity.
What it shows
- Billable versus non-billable hours
- Billable utilization percentages
- Time logged by consultant
- Weekly time trends
- Team and individual performance
- Total billable percentage across the organization
Why it matters
Consulting profitability depends on balancing billable work with the internal activities required to run the business. This dashboard helps leaders identify utilization trends, understand where non-billable time is increasing, and ensure resources are spending an appropriate amount of time on client work.
Service portfolio performance dashboard
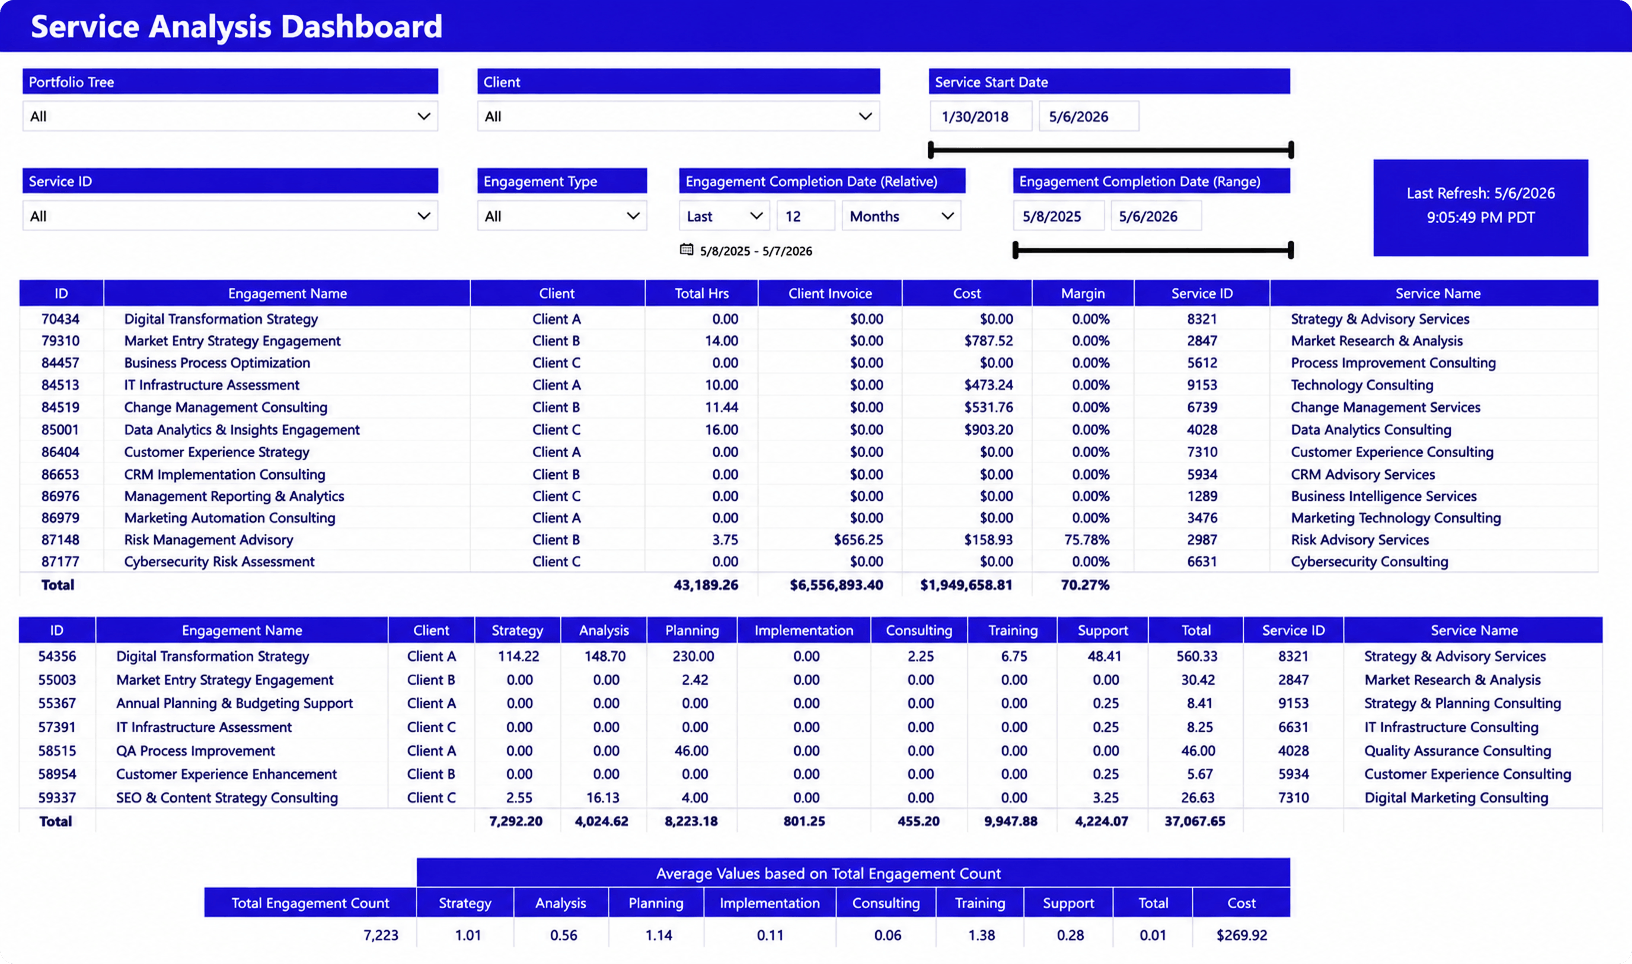
A service portfolio performance dashboard helps consulting firms analyze the financial and operational performance of their service offerings. It combines revenue, profitability, project volume, and resource consumption data to show which services contribute most to business growth.
What it shows
- Revenue and invoicing by service line
- Profit margins by offering
- Project volume by service
- Labor effort by department or role
- Service profitability trends
- Revenue and cost contribution by offering
Why it matters
Not all consulting services generate the same level of revenue or profitability. This dashboard helps leaders understand which offerings drive growth, consume the most resources, and generate the strongest margins. These insights support strategic decisions around service expansion, pricing, staffing, and investment priorities.
The most important KPIs for consulting firms
Consulting firms can track hundreds of metrics, but only a handful directly influence profitability, resource planning, and growth decisions. The KPIs below form the foundation of most consulting performance dashboards and help leaders understand both current performance and future business health.
| KPI | What it measures | Why it matters |
| Billable utilization | Percentage of available time spent on client work | Indicates how effectively revenue-generating resources are being used |
| Realization rate | Revenue collected compared to billable work performed | Reveals write-offs, discounting, scope creep, and pricing issues |
| Project profitability | Profit margin generated by individual projects | Helps identify the most profitable services, clients, and project types |
| Revenue forecast accuracy | Difference between forecasted and actual revenue | Measures forecasting reliability and planning effectiveness |
| Resource capacity | Available hours compared to future demand | Supports hiring, staffing, and workload balancing decisions |
| Demand versus capacity | Forecasted work compared to available resources | Highlights future resource shortages or excess capacity |
| Billable percentage | Ratio of billable to non-billable hours | Provides visibility into workforce productivity and revenue potential |
| Service profitability | Revenue and margin performance by service offering | Helps prioritize high-performing services and investment areas |
Why reporting remains difficult for many consulting firms
Many consulting firms invest in reporting tools but still struggle to gain reliable visibility into performance. The problem is rarely the dashboard itself. More often, resource plans remain in spreadsheets, project teams use different systems than finance teams, and forecasts require constant manual updates. As a result, leaders spend significant time consolidating data instead of analyzing it.
These challenges make it difficult to answer critical business questions such as whether resources are fully utilized, which projects are most profitable, and whether future demand can be supported with existing staff. By the time monthly reports are prepared, project schedules, resource allocations, and financial forecasts may already have changed. Without portfolio-level visibility, prioritization often becomes reactive rather than data-driven.
How dashboards improve consulting performance
The value of dashboards comes from helping leaders make faster, better decisions. By combining project, resource, financial, and forecasting data, dashboards provide visibility into both current performance and future risks.
Key benefits include:
- Better utilization management through visibility into workload imbalances and available capacity
- More accurate forecasting by combining demand, staffing, and project data
- Improved profitability visibility through real-time financial performance tracking
- Stronger staffing decisions based on future capacity and resource needs
- Faster executive reporting with up-to-date business insights in a single view
The best dashboards start with connected data
The most valuable dashboards combine project, resource, time tracking, and financial data into a single reporting layer. When information remains scattered across spreadsheets and disconnected tools, reporting becomes unreliable regardless of the dashboard technology being used.
Many consulting firms struggle with reporting because project teams, finance teams, and resource managers work from different data sources. Connecting these systems creates a more complete view of utilization, profitability, capacity, and future demand. Platforms such as Birdview PSA can serve as the operational data source that feeds Power BI reporting and analytics.
FAQ: Power BI dashboards for consulting firms
What should a consulting dashboard include?
A consulting dashboard should combine utilization, capacity planning, profitability, forecasting, project delivery, and service performance metrics. The most useful dashboards connect operational and financial data rather than focusing on projects alone.
Which KPIs matter most for consulting firms?
The most important KPIs typically include billable utilization, realization rate, project profitability, revenue forecast accuracy, resource capacity, demand versus capacity, billable percentage, and service profitability.
How do consulting firms track utilization?
Most firms calculate utilization by comparing billable hours against available working hours. Utilization dashboards help identify underutilized consultants, overloaded teams, and future capacity constraints.
What dashboards help improve profitability?
Profitability dashboards, utilization dashboards, billable versus non-billable dashboards, and service portfolio performance dashboards help firms improve profitability by connecting resource performance with financial outcomes.
How do dashboards support forecasting?
Forecasting dashboards combine project demand, sales pipeline information, resource availability, and historical performance data. This helps firms anticipate future staffing needs, revenue performance, and capacity risks more accurately.