Project profitability is the ultimate truth serum for service businesses. It doesn‘t care how exciting the work was, how happy the client seems, or how “strategic” the project felt in the kickoff deck. It answers one brutal question: Did this engagement actually make money once real delivery costs hit the ledger?
That‘s where many teams get blindsided. A project can look fantastic at the proposal stage (hello, “45% margin”) and quietly turn into a profit leak once scope creep, unbilled time, and underpriced labor pile up. If you only check profitability at the end, you‘re not measuring performance; you‘re doing an autopsy.
This guide shows you exactly how to calculate project profitability, what data you need, and how to monitor margin while you can still fix it.
Quick answer: Project profitability formula (gross margin)
To calculate project profitability, use gross margin:
Gross margin = (Project revenue − Project cost) ÷ Project revenue
Include real revenue (after discounts/write-offs) and total project cost, which should cover:
- Labor: tracked hours × fully loaded cost rate by role (not just wages)
- Project expenses: contractors, travel, project software, tools
- Non-billable project time: internal meetings, client comms, rework (it still costs money)
Rule of thumb: If you‘re using estimated hours or wage-only rates, your “profitability” is probably optimistic fiction.
Why projects appear profitable when they are actually losing money
Projects often look profitable because margins are calculated using estimates instead of real costs. You know the situation. The proposal looks solid, the team is confident, and the projected margin sits at a comfortable 45%. A few months later, the financial results tell a very different story.
This gap between billable revenue and actual project cost is where margins quietly disappear. The project appears healthy on paper, but the true costs are buried in day-to-day operations.
Estimated effort vs actual work
Many project calculations rely on planned hours rather than what the work actually requires. As projects move forward, additional effort accumulates in small, hard-to-track ways that rarely make it into the original estimate.
Invisible work that never gets billed
A large portion of project effort often goes untracked or unbilled, including:
- Internal status meetings
- Writing and responding to emails
- Coordinating with stakeholders
- Managing client expectations
These hours are frequently treated as general administrative work rather than direct project costs. When these hours are excluded, profitability appears higher than it really is because part of the work is absorbed by overhead rather than the project itself.
Fully loaded cost rates (not just wages)
Another common issue is how internal cost rates are calculated. Many teams base profitability on gross hourly wages alone, which leaves out significant expenses such as:
- Benefits and payroll taxes
- Office space and utilities
- Software licenses and tools
- Equipment and insurance
A true margin calculation requires fully loaded cost rates. Without them, a project may appear profitable while barely breaking even. For example, a senior developer earning $60 per hour may actually cost the business $90 per hour once overhead is included. Budgeting based on the lower figure underestimates costs by more than 30 percent from the start.
📚 Read more: Project cost management: definition and best practices
Comparison: profitability factors
| Variable | Why it gets missed | Impact on Profitability |
| Administrative Time | Considered “too small” to track. | Can reduce margin by 10-15%. |
| Software Licenses | Usually hidden in the general overhead. | Distorts the “Cost of Delivery.” |
| Revisions/Scope Creep | Managed via Slack or email. | The #1 reason projects lose money. |
Key takeaway: don’t ignore the drips
Profitability leaks rarely happen all at once. They are usually small drips from untracked meetings and unbilled emails. If you do not patch these holes, your revenue will eventually sink. These “small” costs are often the difference between a growing firm and one that is just breaking even.
What project profitability means (in simple terms)
Project profitability measures the specific contribution of an engagement to the firm’s bottom line by isolating direct delivery efficiency from general overhead. While this sounds straightforward, the nuance lies in determining exactly what counts as a cost. It is not just about whether you invoiced more than you paid in salaries. It is about measuring the efficiency of your delivery engine.
Gross margin vs contribution margin
It is critical to distinguish between these two metrics. Gross margin subtracts the fully loaded cost of goods sold (COGS) from revenue. This is the gold standard for measuring project delivery performance because it includes labor and direct expenses. Contribution margin often goes a step further by subtracting variable costs to see what the project contributes to covering fixed overhead. For most project managers and operations leaders, gross margin is the primary lever. You cannot control the office rent (a fixed cost) but you can control how many hours a senior consultant spends on a task.
Why profitability changes during the project
Profitability is not a static number you arrive at when the project closes. It is a dynamic curve that shifts every day. In the early stages of a project, profitability often looks high because complex work has not started yet. As the project enters the “messy middle,” hours burn faster and margins compress. If you only look at profitability at the end, you have missed the window to act. Understanding this timeline helps you avoid the “watermelon effect,” where a project looks green on the outside in status reports but is red on the inside in financials until it bursts.
The data you need to calculate profitability
You need four distinct data points to run an accurate calculation: precise time logs, verified cost rates, tracked expenses, and a baseline budget. Attempting to calculate service project profitability without these four pillars yields estimates that can lead to dangerous strategic decisions.
Revenue (net of discounts/write-offs)
Revenue is usually straightforward but must reflect reality. Write-offs and discounts should be deducted from invoiced amounts. Costs require more care and include direct labor, project-related expenses, and indirect project costs. Leaving out any of these inputs makes profitability look better than it really is. For longer projects, it is also important to consider revenue recognition timing, since revenue may be recognized gradually while costs are incurred upfront.
Accurate time tracking by project and role
Time tracking needs to show where effort is actually spent. Billable work, non-billable project work, and general admin time should be clearly separated. Project-related work that is logged outside the project hides real costs and inflates margins.
Clear billing rates and cost rates
Each resource should have both a bill rate and a fully loaded cost rate. Cost rates should include salary, benefits, and overhead. Using salary alone consistently overstates margins, so rates should be reviewed and updated regularly.
Tracked expenses and write-offs
Project-specific expenses such as subcontractors, travel, and software must be tied directly to the project. Non-billable time and write-offs also need to be tracked, since they represent lost revenue and directly reduce project profitability.
How to calculate project profitability: The project margin calculation formula
The most reliable measure of project profitability is gross profit margin. This metric shows how efficiently your team delivers work relative to what you charge.
Gross Profit Margin = (Total Project Revenue – Total Project Cost) / Total Project Revenue
Getting the total project cost right is critical. It should include direct labor based on hours worked and fully loaded cost rates, along with all project-specific expenses such as travel, contractor fees, and software purchased for the engagement.
It is also important to separate gross margin from net margin. Gross margin focuses on delivery efficiency, which project teams can influence directly. Net margin includes a share of company-wide overhead, like sales and executive costs.
When gross margin is strong, but net margin is weak, the issue usually sits outside project delivery. When gross margin is low, the problem is typically in scoping, pricing, or project management. For a deeper explanation of margin analysis, Investopedia offers a clear and practical breakdown.
Applying the formula: A step-by-step project profitability example
Calculating margin on a fixed-fee project begins by subtracting the actual cost of all hours worked from the fixed revenue amount, regardless of the number of hours originally estimated. A theoretical margin is useless. This walkthrough demonstrates how actual delivery variables can drastically shift the final profit. Consider a realistic scenario in which a marketing agency bills $50,000 for a website redesign.
1. Establish the budget and estimated hours
First, define the initial scope by allocating hours by role. For example, you estimate 200 hours for a Designer with a fully loaded cost of $60/hour and 100 hours for a Developer with a cost of $80/hour. This sets your baseline for calculating project margin with time tracking.
2. Calculate the planned margin
Before work starts, you calculate what success looks like. Your total estimated cost is (200 hours * $60) + (100 hours * $80), which equals $20,000. The potential profit is $50,000 minus $20,000, leaving $30,000. Your planned margin is a healthy 60%.
3. Introduce reality and scope creep
The project begins, and things change. The client requests design revisions that add 50 hours of design time ($3,000 cost). Communication drags on, adding 20 hours of unplanned project management time at $70/hour ($1,400 cost) that was not in the original budget.
4. Calculate actual margin
Now you look at the final numbers based on tracking costs and revenue for projects. Your new cost basis has shifted significantly:
-
- Design Cost: $15,000 (250 total hours * $60)
- Development Cost: $8,000 (100 total hours * $80)
- PM Cost: $1,400 (20 hours * $70)
- Total Actual Cost: $24,400
Your profit drops to $25,600. The margin falls to 51.2%.
Your margin dropped nearly 9 points. While 51% is still healthy, notice how quickly “small” changes eroded nearly $5,000 of profit. If the project had dragged on further with additional unbilled hours or technical debt, that margin could easily slide below 40%. This calculation proves that fixed-fee projects are only profitable when you strictly control scope and effort.
How to monitor profitability while the project is still running
The key to protecting project margins is monitoring profitability during delivery, not after the final invoice. This means tracking burn rate against percentage complete so you can spot issues early, while there is still time to act.
Why waiting until the end does not work
Calculating profitability only after a project is finished leaves no room to recover losses. By then, overspending has already happened. Real-time tracking shows when a project is 50 percent complete but has already consumed 70 percent of its budget, giving you a chance to adjust course.
Warning signs your margin is slipping
Pay attention to these early indicators:
- Planned vs actual hours trending over by 10 percent or more
- Budget burn is accelerating faster than project progress
- Rising non-billable time tied to rework, unclear scope, or blockers
These issues rarely resolve on their own and often grow if left unaddressed.
How mid-project adjustments protect profit
Ongoing margin monitoring allows teams to intervene before losses are locked in. Common actions include trimming low-value scope, reassigning work to lower-cost resources, or changing how reviews and approvals are handled to reduce delays. The Project Management Institute (PMI) consistently highlights proactive cost control as a key factor in successful project delivery.
Industry benchmarks: What is a healthy profit margin in 2026?
For professional services firms, typically, a healthy net profit margin fo falls between 10% and 20%. These figures serve as a baseline for determining if your firm is operating efficiently relative to the market.
PSA (Professional Services Automation) project profitability is closely tied to utilization rates. According to Service Performance Insight (SPI Research) , high-performing firms typically maintain billable utilization rates closer to 70-75%. However, recent trends show averages dipping below 70%. When utilization drops, overhead costs consume a larger percentage of revenue.
Firms specializing in SaaS or productized services may target slightly different margins due to the recurring nature of their revenue, but the fundamentals remain the same. If a project’s gross margin consistently dips below 30%, it is often a signal that your pricing model is flawed or your delivery process is fundamentally broken. For example, if you want to price SEO projects sustainably and profitably then you need to hit that ratio. Using the 30% minimum benchmark keeps you profitable.
How Birdview helps track project profitability
Birdview helps teams track project profitability by bringing time, budget, and billing data into one system. This removes the need for manual spreadsheet work and gives project managers daily visibility into financial performance, not just month-end summaries. Operational decisions are directly reflected in financial results as work happens.
Real-time visibility into project margins
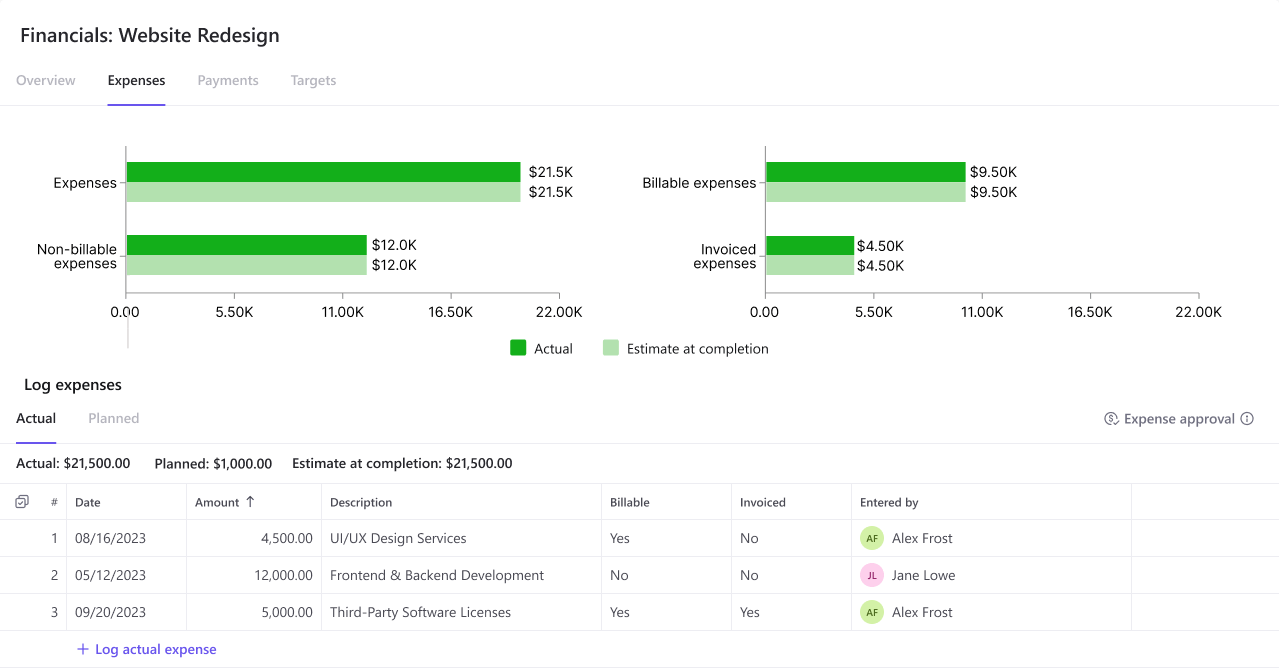
Birdview‘s Project Profit Report shows the current financial health of every active project. It combines actual labor costs from time logs, cost rates, and expenses with project revenue to calculate gross margin in real time. Managers can drill down into specific phases or tasks to see exactly where costs are increasing, making it easier to address issues early.

Forecasting future profitability
In addition to showing where a project stands today, the Expected Revenue Report helps teams understand where it is heading. By analyzing resource bookings and scheduled work, Birdview forecasts future revenue and costs. This allows teams to identify projects that may become unprofitable before the remaining budget is spent and make adjustments in advance.
One system instead of disconnected tools
Many organizations manage time tracking, project plans, and billing in separate systems. Birdview connects these areas into a single workflow. When time is logged, project schedules, invoice drafts, and profitability reports are updated at the same time. This creates a single source of truth that project managers, finance teams, and executives can rely on.
Project profitability FAQs
Q: What is the difference between project margin and operating margin?
A: Project margin focuses strictly on direct delivery costs like labor and expenses relative to project revenue. Operating margin includes firm-wide overhead like rent, sales, and executive salaries that are not directly tied to a specific project.
Q: How often should I calculate project profitability?
A: You should calculate profitability in real time or at least weekly. Weekly reviews allow you to adjust scope or resources to protect the margin while the project is active.
Q: How do I handle non-billable time in profitability calculations?
A: Non-billable time related to the project, such as internal status meetings or admin work, must be assigned a cost and deducted from the project’s gross margin. If you ignore these hours, you are artificially inflating your profit numbers.
Q: What is a good profit margin for a service business?
A: A healthy service business typically aims for a 40% to 50% gross margin on projects. This level is necessary to cover firm-wide overhead and achieve a sustainable 15% to 20% net margin.
Q: Can software automate these calculations?
A: Yes, PSA software automatically tracks time, costs, and billing to display live profitability margins. This eliminates the need for manual spreadsheet updates and ensures your data is always accurate.