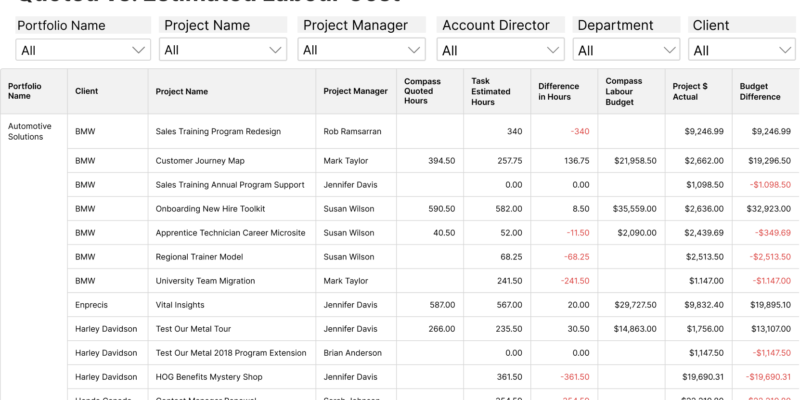
Quoted vs. Estimated Labour Cost
The Quoted vs. Estimated Labor Cost Report is a financial report that allows project managers to compare the quoted (estimated) cost of a project with the actual cost of the project.
This report is useful for tracking the financial performance of a project and can be filtered and aggregated by any data point, such as a customer, to compare the financial performance across different criteria.
To generate the report, the project manager compares the labor costs that were quoted or estimated at the beginning of the project with the actual labor costs that were incurred during the project.
The report may include metrics such as:
- the total labor cost,
- the variance between the quoted and actual labor costs,
- the percentage difference between the quoted and actual labor costs.
By using this report, the project manager can identify areas where costs may have exceeded the original estimate and take corrective action to manage the project budget more effectively in the future. For example, the project manager may decide to adjust future estimates or negotiate more effectively with customers to ensure that the project remains profitable.
The Quoted vs. Estimated Labor Cost Report is a valuable tool for project managers who need to track the financial performance of their projects and make informed decisions about budgeting and resource allocation. The report can be filtered and aggregated to provide a detailed analysis of the financial performance of different projects or customers, making it a powerful tool for strategic decision-making.
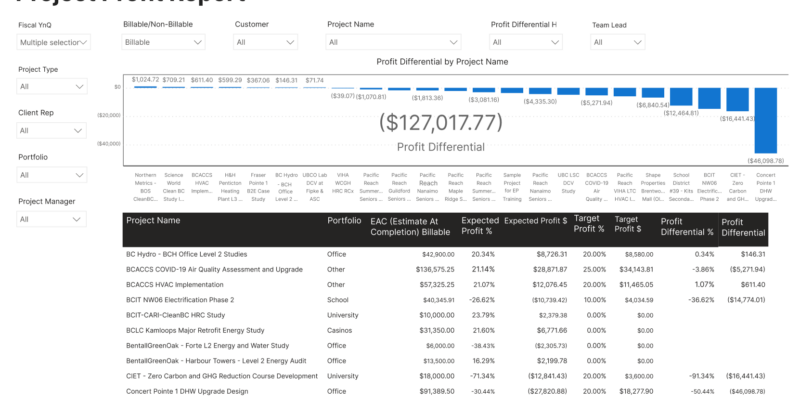
Project Profit Report
The Project Profit Report is a suite of financial reports that are based on the profit generated by a project.
These reports can be filtered and aggregated by any data point, such as customer, to provide a visual representation of the profit generated by different projects.
The reports may include metrics such as:
- revenue, expenses, and profit margin, which can help project managers identify which projects are generating the most profit and which projects may need additional attention to improve profitability.
- a profit differential calculation, which compares the actual profit generated by a project with the estimated or target profit for that project.
By using the Project Profit Report, project managers can identify areas where profitability may be lower than expected and take corrective action to improve the financial performance of the project. For example, the project manager may decide to renegotiate contracts, adjust pricing, or reduce expenses to improve profitability.
The Project Profit Report is a valuable tool for project managers who need to track the financial performance of their projects and make informed decisions about resource allocation, pricing, and other factors that can impact profitability. By providing a detailed analysis of the profit generated by different projects, the report can help project managers optimize their project portfolios and improve the overall financial performance of the organization.
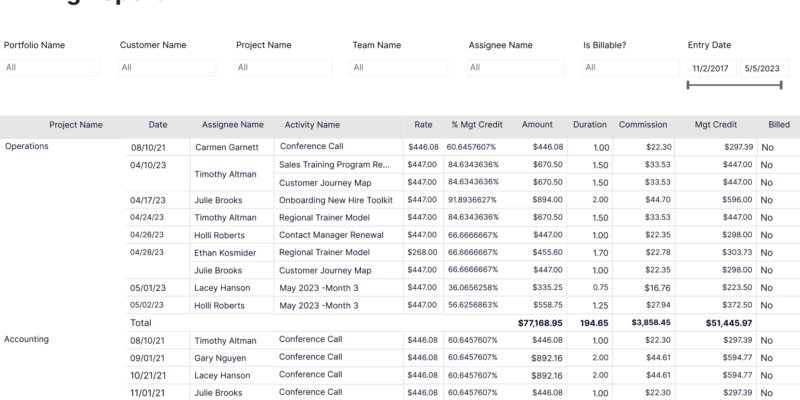
Billing Rate Analysis Report
The Billing Rate Analysis Report is used to analyze billing rates and revenue generated from each customer or project. This report provides a detailed breakdown of the number of hours logged each month for each customer or project, the rate used, as well as the amount billed for those hours.
The report typically consists of a table or chart that lists each customer or project, along with the hours logged and revenue generated for each month. The report may also include additional information, such as the billing rate per hour or any discounts or adjustments made to the billing.
The Billing Rate Analysis Report is a valuable tool for project managers and finance teams, as it allows them to track revenue and analyze billing rates for each customer or project. It can help identify areas where billing rates may need to be adjusted, as well as areas where more resources may be needed in order to increase revenue.
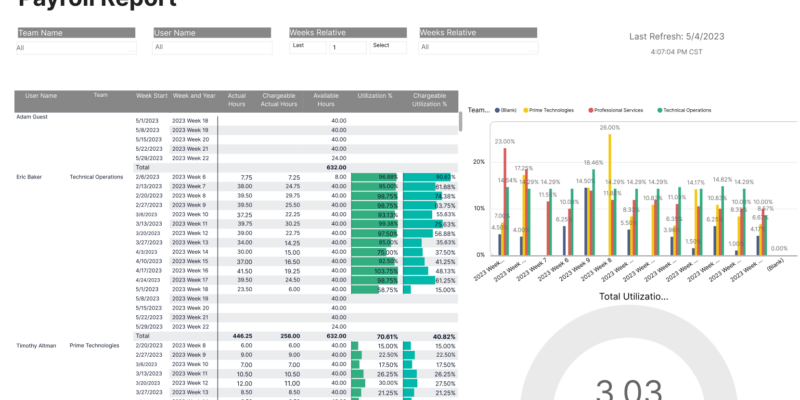
Payroll Report
A Payroll Report provides a detailed breakdown of the hours worked by each employee within a specified date range. The report typically consists of a table that lists each employee, along with the hours worked and any relevant payroll information, such as hourly rate, overtime pay, and benefits.
The Payroll Report allows clients to see:
- a detailed breakdown of each employee’s hours worked over a specified time period, which can be useful for tracking employee performance, ensuring compliance with labor laws, and calculating payroll accurately.
- information about vacation time, sick leave, and other time off taken by each employee.
The Payroll Report can be generated on a regular basis, such as weekly or bi-weekly, in order to provide ongoing payroll tracking and analysis.
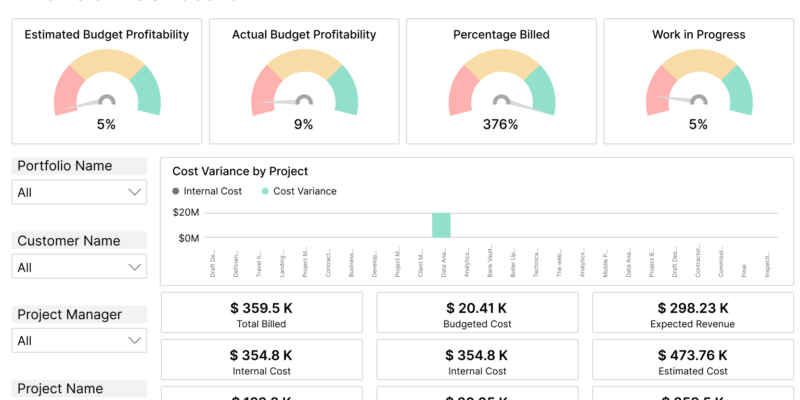
Financial Dashboard
A Financial Dashboard provides a central, aggregated view of the finances for your projects.
- The dashboard can be filtered and aggregated based on any data point, such as portfolio, customer, or any other custom field, allowing project managers to easily roll up and drill down into the financial details of their projects.
- The Financial Dashboard may include a variety of financial metrics, such as revenue, expenses, profit margin, budget, and actuals.
- The metrics can be displayed using a variety of visualization types, such as charts, graphs, and tables, to provide an easy-to-understand overview of the financial performance of your projects.
By using the Financial Dashboard, project managers can quickly identify areas where financial performance may be below expectations and take corrective action to improve profitability. For example, the dashboard may highlight projects that are over budget or have a negative profit margin, allowing the project manager to identify the root cause of the issue and take action to address it.
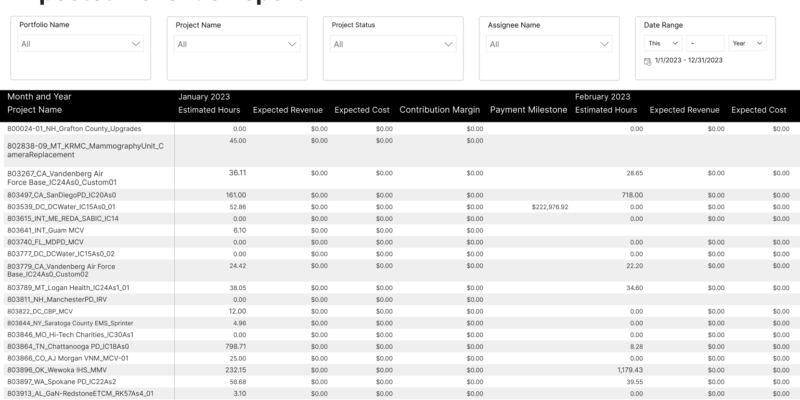
Expected Revenue Report
The Expected Revenue Report is a financial report that allows project managers to calculate their expected revenue based on the estimated hours, billing rates, and expected expenses for their projects. The report can be fully enhanced by adding additional filters or data points to the table.
To produce the report, the project manager needs to input the estimated hours and expected expenses for each project, along with the billing settings, such as the hourly rate or fixed fee.The report then calculates the expected revenue for each project based on these inputs, allowing the project manager to predict their cash flow in real-time.
- The Expected Revenue Report may include metrics such as the total expected revenue, the expected revenue by project or customer, and the expected revenue by billing type.
- By using this report, the project manager can identify areas where revenue may fall short of expectations and take corrective action to manage the project budget more effectively in the future.
For example, the project manager may decide to adjust their billing settings or negotiate more effectively with customers to ensure that revenue remains consistent with expectations. By using the Expected Revenue Report, project managers can make informed decisions about resource allocation, pricing, and other factors that can impact revenue and profitability.
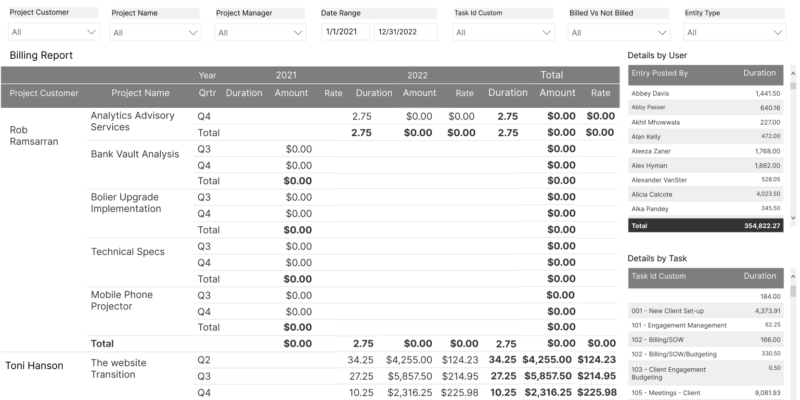
Billing Report
The Billing Report helps project managers track their project billing in real time. The report provides a centralized view of billing information across multiple projects and can be customized to include custom field data and calculations to automate the billing process.
- By using the Billing Report, project managers can eliminate the need for manual billing processes in spreadsheets, saving time and reducing the risk of errors.
- The report may include a variety of billing metrics, such as the total amount billed, the amount outstanding, and the billing status of each project.
- The report can be enhanced to include additional data points or filters, such as the billing method (hourly rate, fixed fee, etc.) or the customer name.
- Custom calculations can be added to the report to automate the billing process, such as calculating the total amount billed based on the hours worked or the expenses incurred.
By providing a centralized view of billing information, the Billing Report can help project managers identify areas where billing may be falling behind or where additional invoicing may be required. This can help to ensure that revenue is being collected in a timely and efficient manner, improving the financial performance of the organization.