Project Exception
The Project Exception Report is a customized report that helps project managers identify projects where important data is missing.
- This report is designed to help project managers ensure that all necessary data is entered and that projects are properly tracked and managed. This can help improve project performance and ensure that projects are completed on time and within budget.
- The report can be customized to identify missing data in a variety of areas, such as project start date, estimated hours, or any other custom fields that have been defined for the project.
- report can also use conditional formatting to highlight missing data points, making it easy for project managers to identify which data points are missing at a glance.
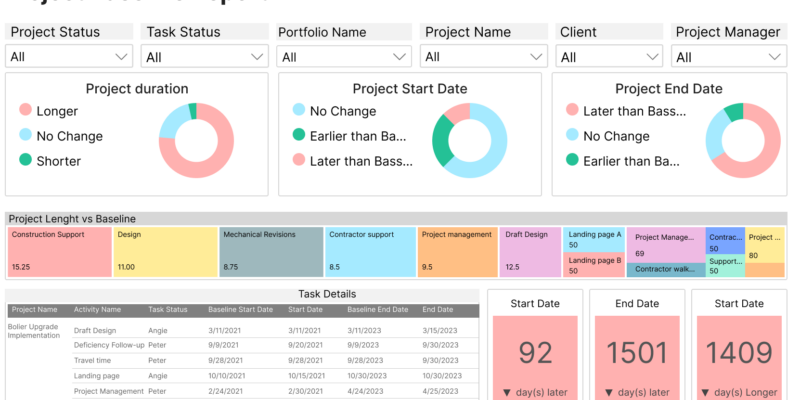
Project Baseline
The Project Baseline Report is a customized report that builds on the Baseline feature to help project managers easily identify which projects are behind or ahead of their schedule. The Baseline feature allows project managers to create a snapshot of the project plan at a specific point in time, which can be used as a reference point to measure progress.
- The Project Baseline Report takes this a step further by providing a clear view of how the actual progress of the project compares to the baseline plan.
- By filtering the report, project managers can quickly identify projects that are ahead or behind schedule and take appropriate actions to keep the project on track.
- The report can be customized to include a variety of data points, such as task duration, start and end dates, and resource allocation.
By using the report to track progress against the baseline plan, project managers can make informed decisions about resource allocation and project prioritization.
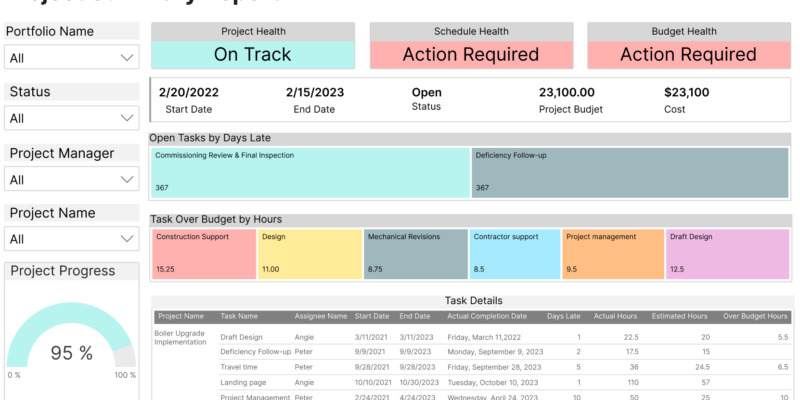
Project Summary
The Project Summary Report is a custom report that provides an at-a-glance view of the performance and status of a given project. The report includes visual indicators for overall, schedule, and budget health, making it easy for project managers to identify any risks or issues that require attention.
- The report can be customized to fit specific project requirements, using a variety of visual elements such as charts, tables, gauges, and more. This eliminates the need for manual report preparation, saving time and effort for project managers and their teams.
- Some of the key data points that can be included in the report are project status, schedule and budget health, tasks over budgets by hours, open tasks by days, other task details, resource allocation, etc.
By monitoring these data points on a regular basis, project managers can quickly identify any areas of concern and take action to mitigate risks and keep the project on track.
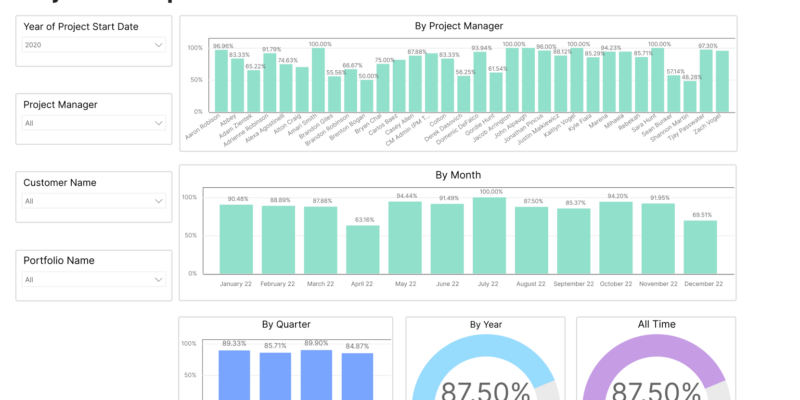
Projects Completed on Time
The Projects Completed on Time Report helps companies track the percentage of projects completed on time. This report is valuable for project managers who want to identify trends and areas for improvement in their project management processes.
- The report can be customized to group projects by native or custom fields, providing a macro view of project completion rates across different criteria such as customer, portfolio, project type, etc .
- The report can also be filtered by date range, enabling project managers to track completion rates over time and identify trends in project performance. Additionally, the report can be drilled down to the employee level to identify individual challenges and opportunities for improvement.
Projects Overview Dashboard
The Projects Overview Dashboard is valuable for project managers who want to monitor the health of their projects in real-time and quickly identify any areas that require attention. By providing an at-a-glance view of your project data, the dashboard allows you to stay on top of project performance and take action to improve project outcomes.
The dashboard typically includes a range of visualizations such as project status summaries, timeline charts, budget tracking charts, and resource allocation charts. These visualizations allow you to quickly understand the overall health of your projects, and identify any areas that require attention.
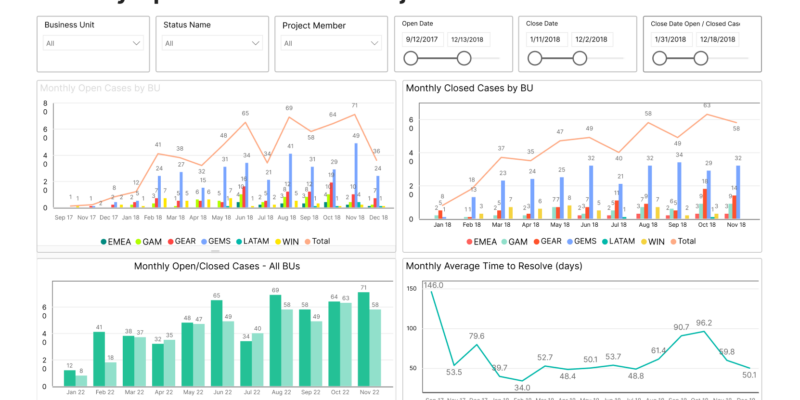
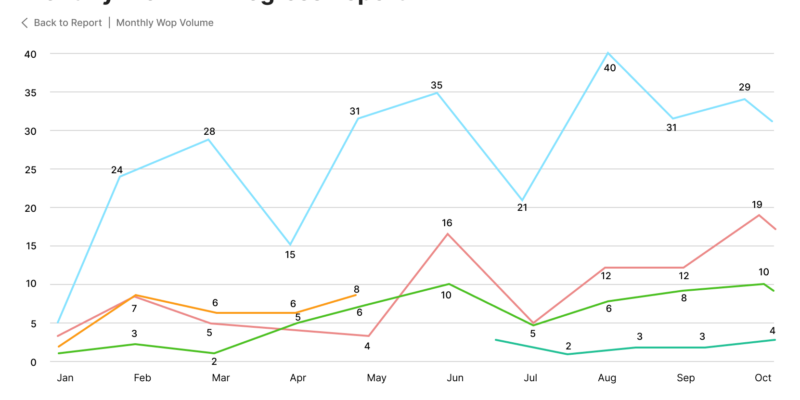
Monthly Opened and Closed Projects
A Monthly Opened and Closed Projects Report provides an overview of the total number of projects opened and closed within a specific period, typically a month.
The report typically includes a line-and-bar chart that shows the trend in the total number of projects opened and closed over time, with the line representing the total number of projects and the bars representing the number of projects opened or closed by a specific business unit, customer, or portfolio.
The report can be customized to group and filter data by any desired criteria, such as business unit, status, etc. This allows stakeholders to analyze the data from different perspectives and identify trends or patterns in the data. The report can also be used to monitor performance metrics, identify areas of improvement, and make informed decisions based on the data.
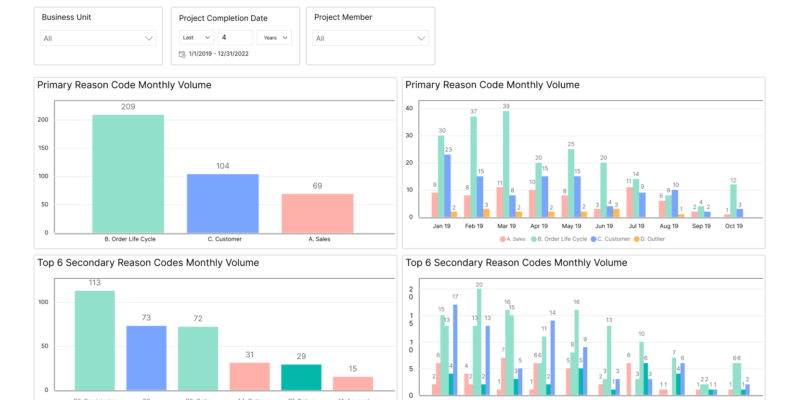
Projects by Reason Code
Projects by Reason Code is a report that helps to identify the reasons or factors that are driving projects to be opened.
- The report typically includes a table and a historical chart that show the volume of projects for each reason code over time.
- The table in the report shows the top reasons for project opening in the last month, along with the number of projects and the percentage of total projects that are attributed to each reason. The top three reasons for project opening in the last month can help stakeholders identify current trends and areas of focus for improvement.
- The historical chart in the report shows the volume of projects for each reason code over time. This chart can help stakeholders identify trends and patterns in project opening over a longer period, such as a year or several years.
- The reason codes used in the report can be customized to fit the specific needs of the organization. Common reason codes include customer demand, new product development, operational improvements, and regulatory compliance.
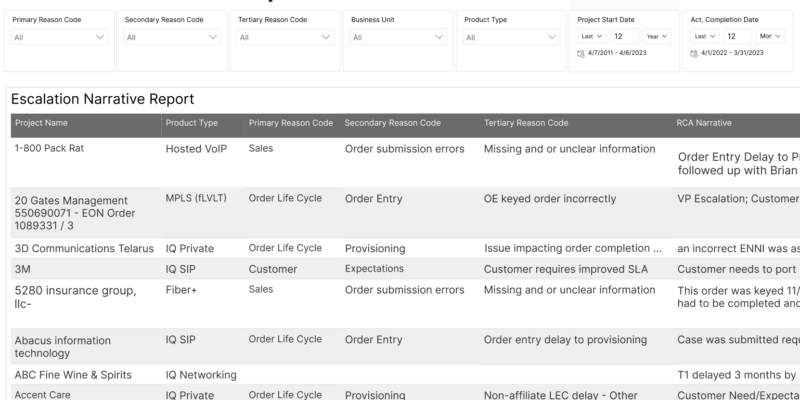
Escalation Narrative Report
The Escalation Narrative Report typically includes a narrative section that provides detailed information about the cause of the escalation, as well as a summary section that shows the number of escalations by cause and any other relevant criteria, such as team, portfolio, or customer.
- The narrative section of the report provides a detailed description of the cause of each escalation, including any contributing factors, actions taken to address the issue, and any follow-up actions that may be necessary.
- It can be customized to filter and group data by any desired criteria, such as team, portfolio, or customer. This allows stakeholders to analyze the data from different perspectives and identify trends or patterns in the data.
By analyzing the specific causes of escalations within projects, stakeholders can take action to address the root causes and improve project performance. This can help to reduce the frequency and severity of escalations, improve project outcomes, and increase stakeholder satisfaction. The Escalation Narrative Report can be a valuable tool for project managers, team members, and other stakeholders who are responsible for managing and improving project performance.
Project Selection Report
A Project Selection Report is a report that helps organizations identify which projects they should prioritize and move forward with based on a list of factors that can be customized to fit the specific needs of the organization. The report typically includes a table and a bar graph that shows the prioritization of projects based on the selected factors.
- The table in the report shows a list of all the projects being considered, along with a score for each project based on the selected factors. The factors can be customized to fit the specific needs of the organization and may include factors such as risk, value, effort, or any other relevant criteria.
- The score for each project is calculated based on the weight assigned to each factor and can be used to prioritize projects and make informed decisions about which projects to move forward with.
- The bar graph in the report shows a visual representation of the project scores, making it easy to identify the best candidate projects.
By using a Project Selection Report, organizations can make more informed decisions about which projects to prioritize and move forward with, based on a comprehensive analysis of multiple factors. This can help to ensure that resources are allocated to projects that will provide the greatest value and contribute most effectively to the organization’s goals. The report can be a valuable tool for project managers, executives, and other stakeholders who are responsible for selecting and prioritizing projects within their organization.
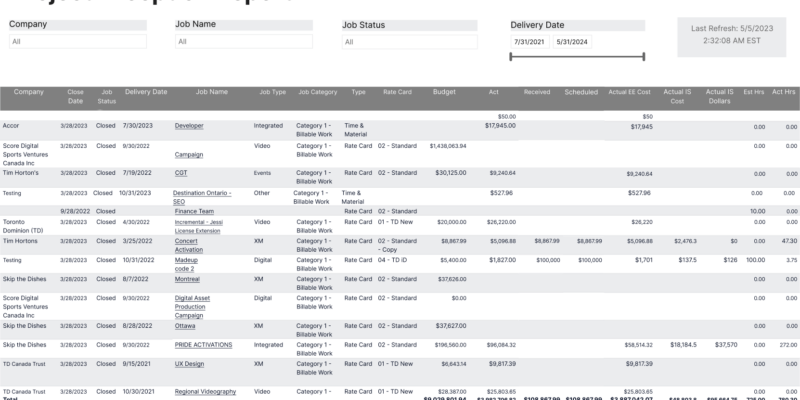
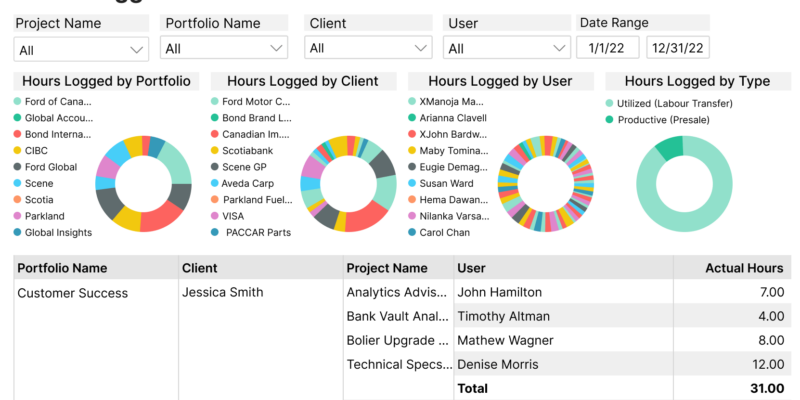
Monthly Work-in-Progress
A Monthly Work-in-Progress Report is a summary of the progress made on all the ongoing projects during a given month. The report helps project managers, team leaders, and other stakeholders to stay up-to-date on the status of projects and identify areas where improvements can be made.
The report includes a count of the active projects that the team tackled during the month, along with other details like the project manager in charge, department, customer, region, and more. By using custom fields and standard fields, the report can be tailored to suit the specific needs of the team and stakeholders.
Some of the key benefits of using a Monthly Work-in-Progress Report include:
- Improved visibility: The report provides a clear picture of the progress made on all the projects, which helps stakeholders stay informed and make informed decisions.
- Better resource allocation: The report can help project managers identify areas where resources may be over-allocated or underutilized, and make adjustments accordingly.
- Increased accountability: The report can help team members stay accountable for their work and ensure that projects are progressing as planned.
- Continuous improvement: By tracking progress and identifying areas for improvement, the team can make ongoing improvements to their processes and project management practices.
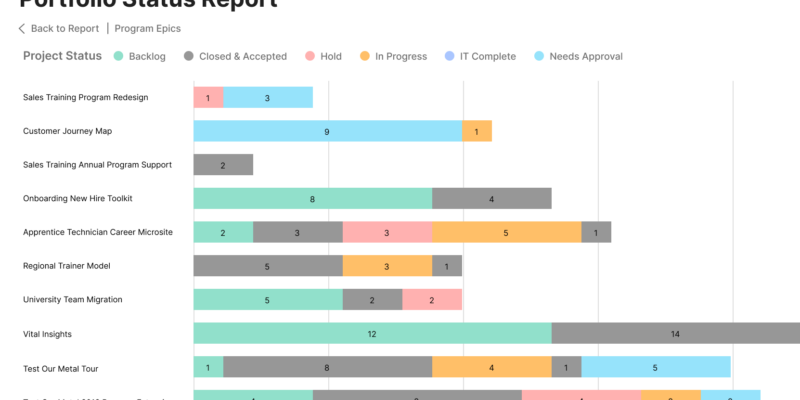
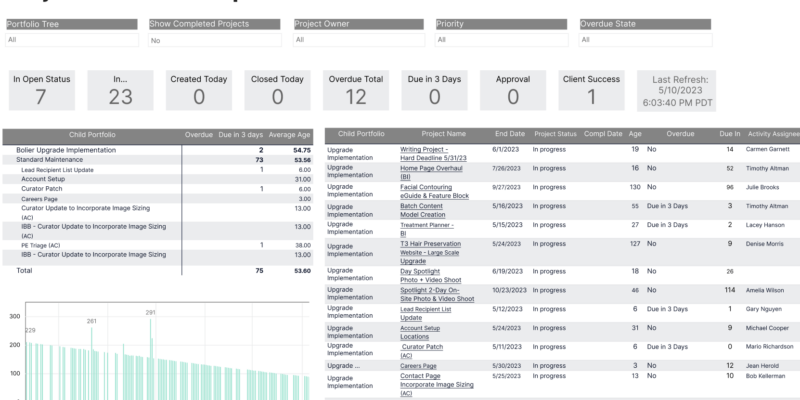
Portfolio Status Report
A Portfolio Status Report is a high-level summary of the status of projects within a portfolio or program. It provides an overview of how many projects are currently active and their current status, including any issues or risks that may be affecting them. The report can be filtered down further by Project Manager in charge, department, end date, and other factors to provide more detailed information as needed.
The main purpose of a Portfolio Status Report is to provide a consolidated view of the status of all projects within a portfolio or program. This helps stakeholders to identify any issues or risks that may be affecting the portfolio as a whole, and to take corrective action if necessary.
The report may include information on:
- The number of projects in the portfolio
- The status of each project (e.g. on track, delayed, at risk)
- The Project Manager in charge of each project
- The department responsible for each project
- The end date for each project
- Any issues or risks that may be affecting the portfolio as a whole
The report can be used by executives, project managers, and other stakeholders to monitor progress, identify areas for improvement, and make informed decisions about resource allocation, budgeting, and risk management.
By providing a consolidated view of the status of all projects within a portfolio or program, the report helps to ensure that projects are aligned with strategic goals and objectives, and that resources are being used effectively.