Introduction
In this section, we will explore some of the main examples of project, resource, finance, and time log reports, highlighting their importance and benefits for organizations. We will also discuss best practices for creating and presenting effective reports that can drive better decision-making and improve organizational performance.
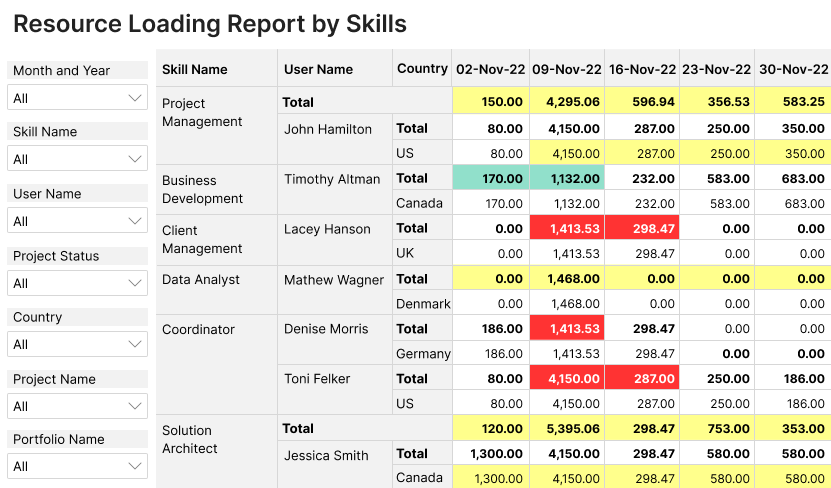
Resource Loading by Skill
The resource workload by skill report allows managers to quickly evaluate the workload and availability of different skill sets on their team.
This report provides a retrospective view of how workload has been distributed by project skill-wise and helps make informed strategic decisions on task redistribution, the need for new hires, staff cuts, etc.
If the report includes automatic color coding, it becomes much easier to use. The report allows the user to quickly identify successful or unsuccessful workload instances and identify trends over a specific date range without additional diagrams or tables.
By regularly checking the resource workload by skill report, the manager can easily identify bottlenecks when deciding which project to pursue and when.
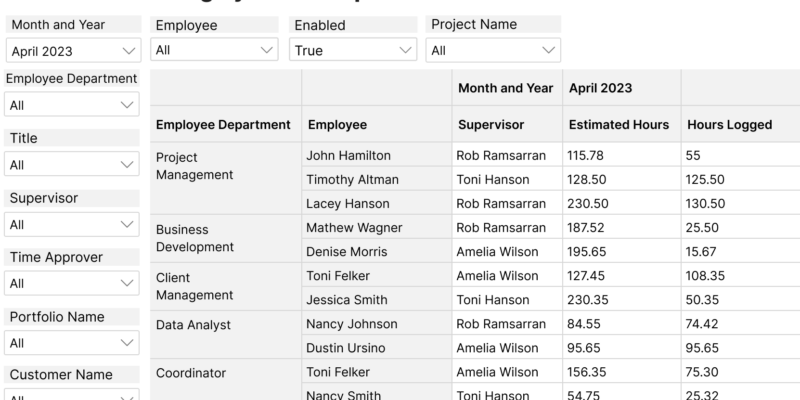
Resource Loading by Team/Department
Every manager appreciates the importance of understanding their employees’ workload.Is their time being used cost-effectively? How much time is available, or is there a need to solve a team overload problem?
A team or department resource loading report gives an accurate picture of team loading versus capacity. The Resource Loading by Team Report allows managers to:
- view and compare planned hours with actual hours,
- track the distribution of time among teams,
- make informed strategic decisions based on the report data.
The information capacity of the report can increase dramatically with additional filters that allow for extra fields, such as team name, supervisor, portfolio name, customer name, etc.
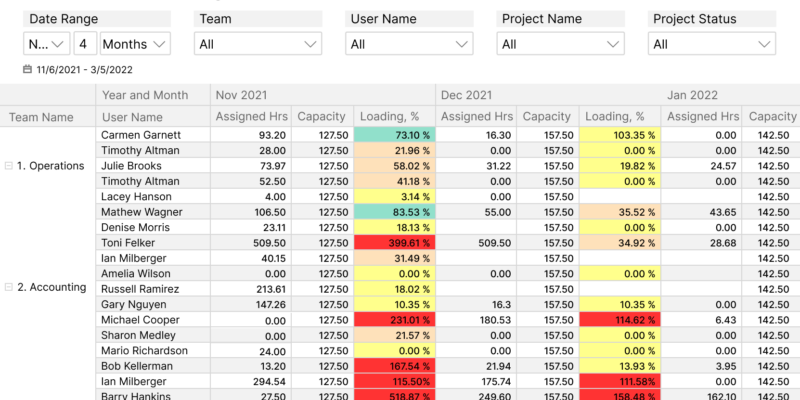
Resource Loading and Capacity by User
Actual loading distribution versus capacity by the user is one of the most important reports for a resource manager. Understanding the workload of each and every resource is the underlying factor for teamwork optimization, the need for staff hires or cuts, or taking measures to avoid employee burnout.
The User Loading and Capacity Report offers full visibility into the available/assigned hours ratio per user (coworker). The inclusion of metrics such as the annual target completion rate % makes this report an indispensable tool for any resource manager.
If the report includes automatic color coding functionality, report analysis and identification of strengths and bottlenecks can take less effort and time.
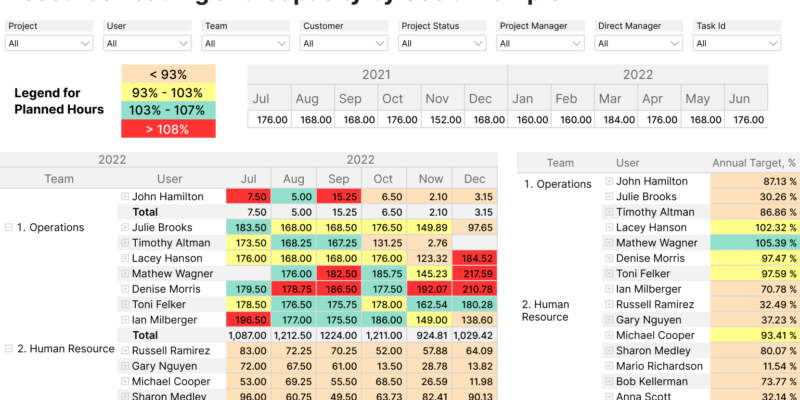
The report will help a manager quickly estimate the workload and availability of each coworker and make informed decisions on resource loading/availability, loading decrease/increase, reallocation to other projects, etc.
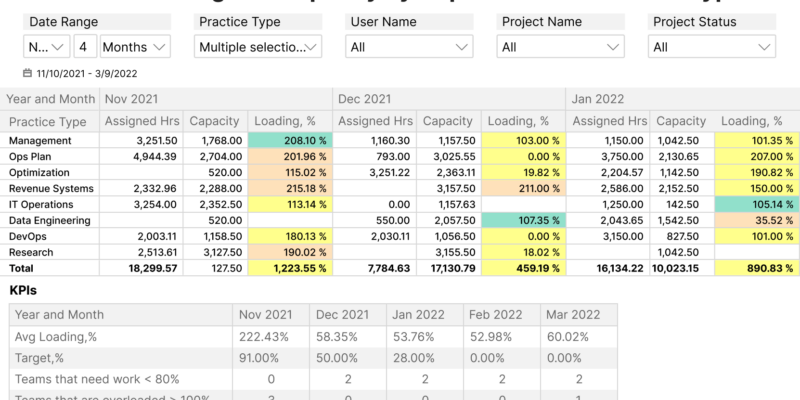
Resource Loading and Capacity by Department / Practice
The Resource Loading and Capacity Report provides a top-level view of actual hours vs capacity, enabling managers to identify underloaded and overloaded areas in the company. With this information, managers can make strategic decisions.
Color coding is a highly valuable optional feature that allows managers to quickly assess the report values without having to examine detailed figures. In addition to the loading and capacity report, managers can benefit from reports that reflect various KPIs.
For example, a KPI report could include totals or average values for various criteria used by the manager and show the degree to which the total values from the loading and capacity report correspond to chosen targets.