Imagine walking into a meeting and, with one glance, knowing exactly where every project in your organization stands. That‘s the power of a well-built project portfolio dashboard, which transforms scattered project data into an accessible and visually summarized view. In this article, we‘ll guide you through the essential elements every portfolio dashboard needs (and why they matter), so you can spend less time searching for answers and more time steering projects to success.
What is a project portfolio dashboard?
A project portfolio dashboard is a centralized, visual reporting tool that displays real-time information across multiple projects. Unlike a project dashboard, which focuses on a single initiative, portfolio dashboards offer a bird‘s-eye view of all active and planned work.
A project portfolio dashboard isn’t just a bigger version of your project dashboards. While a single project dashboard focuses on the nitty-gritty details of one initiative (think task completion rates, individual team member workloads, and specific deliverable statuses), a portfolio dashboard in project portfolio management zooms out to show the forest instead of the trees.
Benefits of project portfolio dashboards: why they matter
Who exactly benefits from this bird’s-eye view? Executives use portfolio dashboards to ensure projects align with business strategy and deliver expected ROI. PMO leaders rely on them to spot resource conflicts before they become project disasters. Program managers use them to coordinate dependencies across multiple related initiatives.
The promise of portfolio dashboards sounds compelling in theory, but what do they actually deliver in practice? The benefits extend far beyond prettier reports or flashier presentations – they fundamentally change how organizations approach project leadership.
- Real-time visibility into progress and performance: Portfolio dashboards provide continuous visibility into what’s happening across all initiatives. It helps leaders to spot trends, identify problems, and celebrate successes as they occur rather than weeks after the fact.
- Early identification of risks and bottlenecks: Early identification means early intervention, which typically means smaller problems, lower costs, and better outcomes. The math is simple: catching problems early saves money, time, and organizational stress.
- Improved resource allocation and planning: Portfolio dashboards reveal over-allocation before it becomes burnout, identify underutilization before it becomes waste, and highlight skill gaps before they become project delays.
- Better alignment with business goals: Portfolio dashboards connect tactical project execution with strategic business objectives. When stakeholders can see how individual projects contribute to larger goals, it helps organizations say “no” to projects that don’t serve strategic purposes and “yes” to initiatives that advance business objectives.
- Data-driven stakeholder communication: Portfolio dashboards replace opinion-based project discussions with fact-based strategic conversations. This shared visibility reduces organizational politics around project prioritization and resource allocation, replacing subjective preferences with objective performance data.
- Faster, more confident decisions: Thanks to project portfolio dashboards, instead of delaying decisions while gathering information from multiple sources, leaders can make informed choices based on dashboard insights.
📚 Read more: What does a portfolio manager do in project management?
Key elements every portfolio dashboard should include
Building an effective portfolio dashboard is like curating a museum exhibit. Every element needs to earn its place, tell part of a larger story, and guide visitors toward meaningful insights.
- High-level project status
Your dashboard’s opening act should answer the most fundamental question: “How are we doing?” This means presenting project health in a format that’s instantly digestible. Group projects by health (on track, at risk, delayed, completed) and display counts or percentages. This gives anyone immediate insight into the portfolio‘s current state.
- Portfolio KPIs
This is where your dashboard shifts from informative to insightful. Key Performance Indicators, like schedule variance, cost performance, ROI, and utilization, tell a deeper story. The trick is to focus only on project portfolio KPIs that influence decisions. If a metric doesn‘t help adjust budgets, reassign resources, or rethink scope, it‘s probably dashboard clutter.
- Budget vs. actuals
A strong dashboard shows where budgets stand today and where they‘re headed tomorrow. Go beyond simple over/under charts. Include burn rate trends, budget utilization, and forecasted final costs. These help stakeholders spot financial trouble early, before small overruns turn into major reforecasting headaches.
- Resource overview
People are your most valuable and most limited asset. Dashboards that expose workload, availability, and skills give you the clarity needed to plan smarter and avoid burnout. A resource overview helps you balance the load across your project portfolio and make the best use of your talent.
- Timeline view
Time is what ties projects together and often what tears them apart. A timeline view helps visualize how initiatives overlap, where delays could cascade, and when key milestones converge. Think of it as a bird‘s-eye view of your portfolio calendar. Whether it‘s a milestone map, a dependency chart, or a deadline tracker, this view helps you anticipate and plan.
- Risk indicators and issue logs
Dashboards that surface risk help prevent it. Aggregate project-level issues into a single view to identify portfolio-wide threats before they spread. Display overdue mitigation actions, systemic issues, and high-risk projects side by side.
- Strategic alignment indicators
Alignment indicators show which projects support which business objectives, strategic themes, or OKRs. Dashboards that map effort to strategy help stakeholders validate that time, budget, and talent are being invested where they‘ll have the most impact.
- Drill-down and filter capabilities
One dashboard shouldn‘t try to serve everyone the same way. Executives want summaries. Portfolio managers need detail. Department leads care about their slice of the pie. Make your dashboard flexible enough to serve all of them. Allow users to filter by department, time period, project type, or strategic priority.
Types of project portfolio dashboards
Not all portfolio dashboards are created equal, and the most effective organizations recognize that different stakeholders need different views of the same underlying data. It’s like having multiple camera angles of the same sporting event – each perspective reveals insights that others might miss.
Executive overview dashboards
C-suite leaders don’t have time for operational minutiae, but they desperately need strategic visibility. Executive dashboards focus on the big picture: overall portfolio health, strategic alignment, ROI performance, and major risk indicators. These dashboards answer questions like “Are we investing in the right projects?” and “What threatens our strategic objectives?”
PMO or portfolio manager dashboards
Project Management Office leaders and portfolio managers live in the operational details that make strategic success possible. Their dashboards emphasize resource utilization, delivery performance, budget management, and cross-project coordination. These dashboards serve as mission control for portfolio operations, highlighting resource conflicts, budget variances, timeline risks, and coordination opportunities.
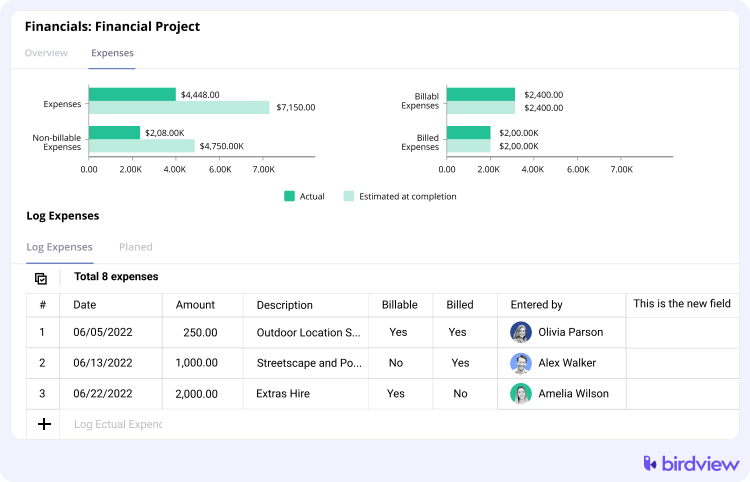
Financial dashboards
CFOs and financial teams need portfolio visibility that connects project performance to financial outcomes. Financial dashboards track cost performance, forecast accuracy, cash flow implications, and ROI realization across the portfolio.
Risk and issue dashboards
Risk management teams and governance committees need aggregated views of threats across the entire portfolio. Risk dashboards consolidate individual project risks, identify systemic threats, and track mitigation progress.
📚 Read more: Project portfolio risk management: best practices, examples & tools
Custom dashboards
Smart organizations recognize that different departments, business units, or functional teams might need tailored views of portfolio data. Custom dashboards filter and present information relevant to specific audiences while maintaining a connection to overall portfolio performance. These might include department-specific project views, customer-focused delivery dashboards, or innovation pipeline tracking that serves specialized stakeholder needs.
Project portfolio dashboard examples
Theory is helpful, but concrete examples bring concepts to life. Let’s explore three real-world dashboard approaches that demonstrate how different organizations solve portfolio visibility challenges.
Example 1: Portfolio 360 Dashboard
The Portfolio 360 Dashboard represents the Swiss Army knife approach to portfolio visibility. This dashboard gives executives a complete, real-time snapshot of organizational project health through carefully curated metrics and intuitive visualizations.
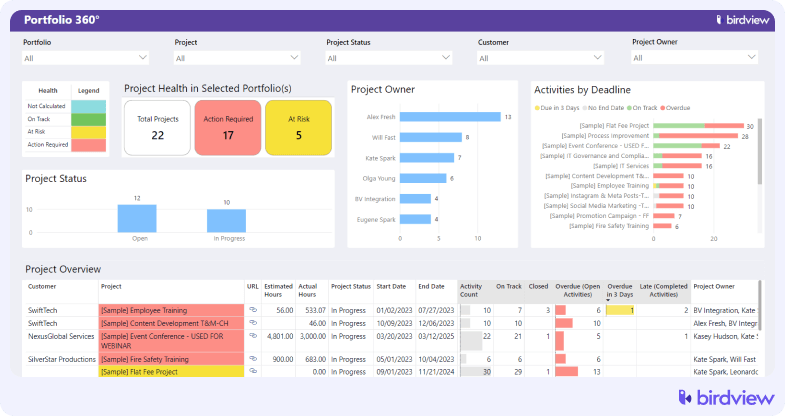
What makes this dashboard effective is its layered information architecture. The top level shows critical summary metrics: total projects, overall health distribution, key milestone status, and resource utilization trends. Users can quickly grasp whether the portfolio is generally healthy or requires immediate attention.
The Portfolio 360’s strength lies in its ability to serve multiple audiences through the same interface. Executives get strategic summaries, program managers access operational details, and resource managers find capacity planning insights.
Example 2: Executive Summary Dashboard
Sometimes less really is more, and the Executive Summary Dashboard proves this point elegantly. Designed specifically for C-suite leaders and senior stakeholders, this dashboard sacrifices comprehensive detail for crystal-clear strategic insight.
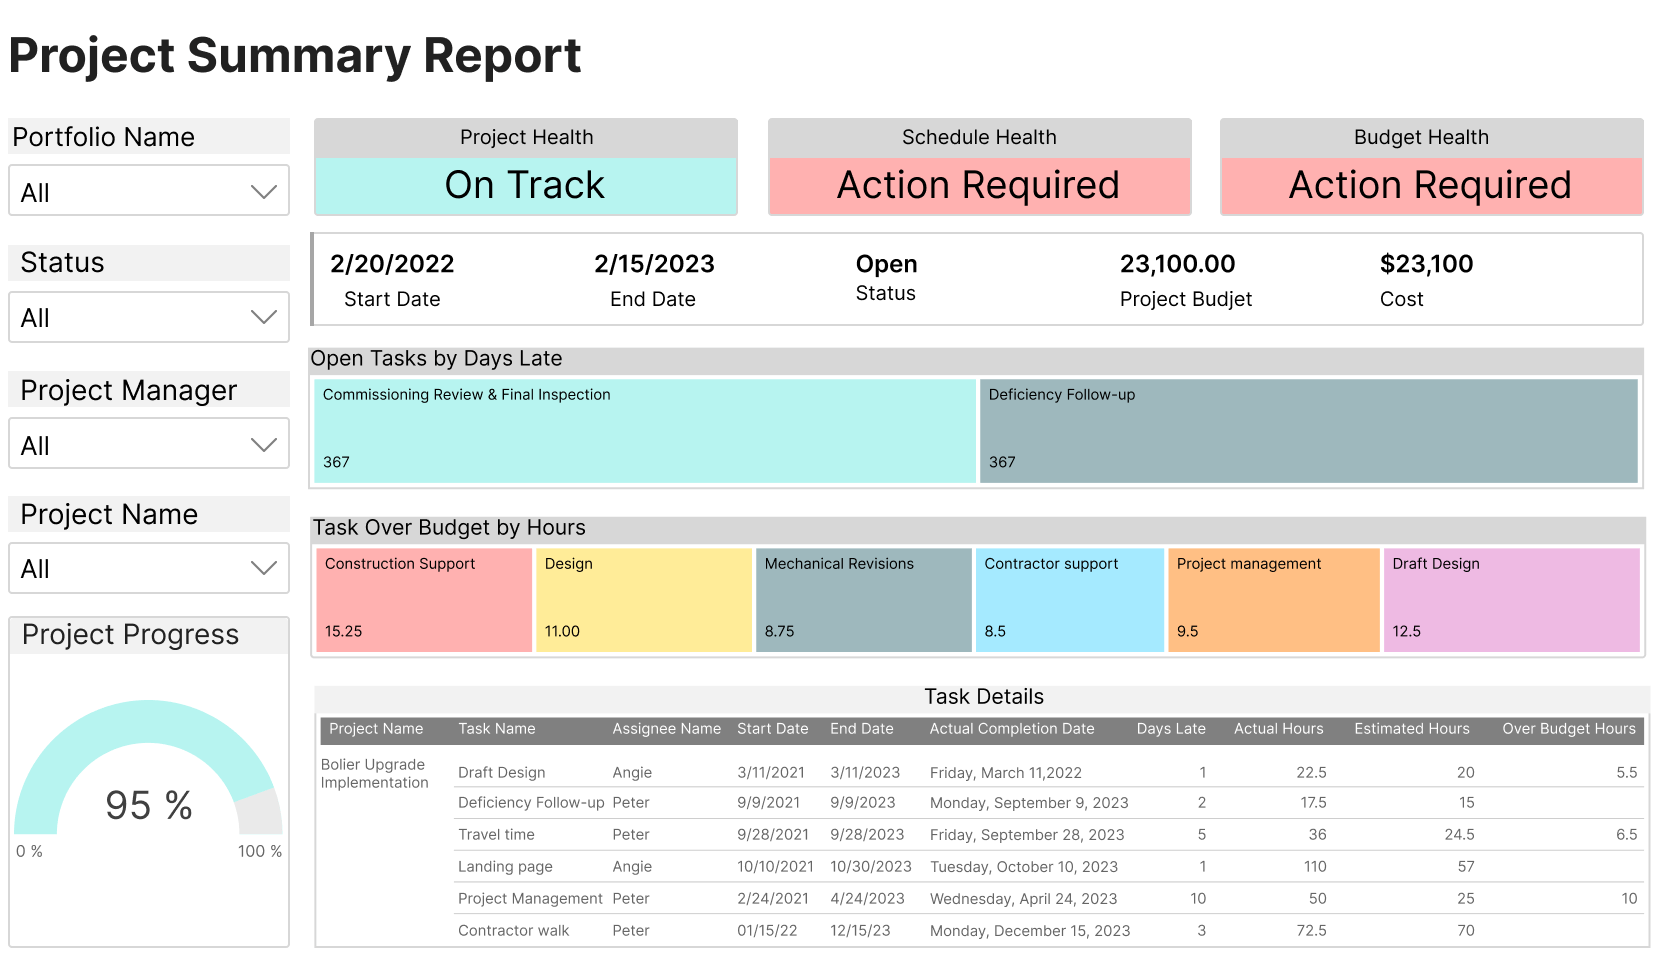
The genius of this approach lies in its disciplined focus on decision-driving metrics. Instead of showing everything, it presents only information that influences strategic choices: overall portfolio health, budget performance against plan, strategic objective progress, and major risk indicators that require executive attention.
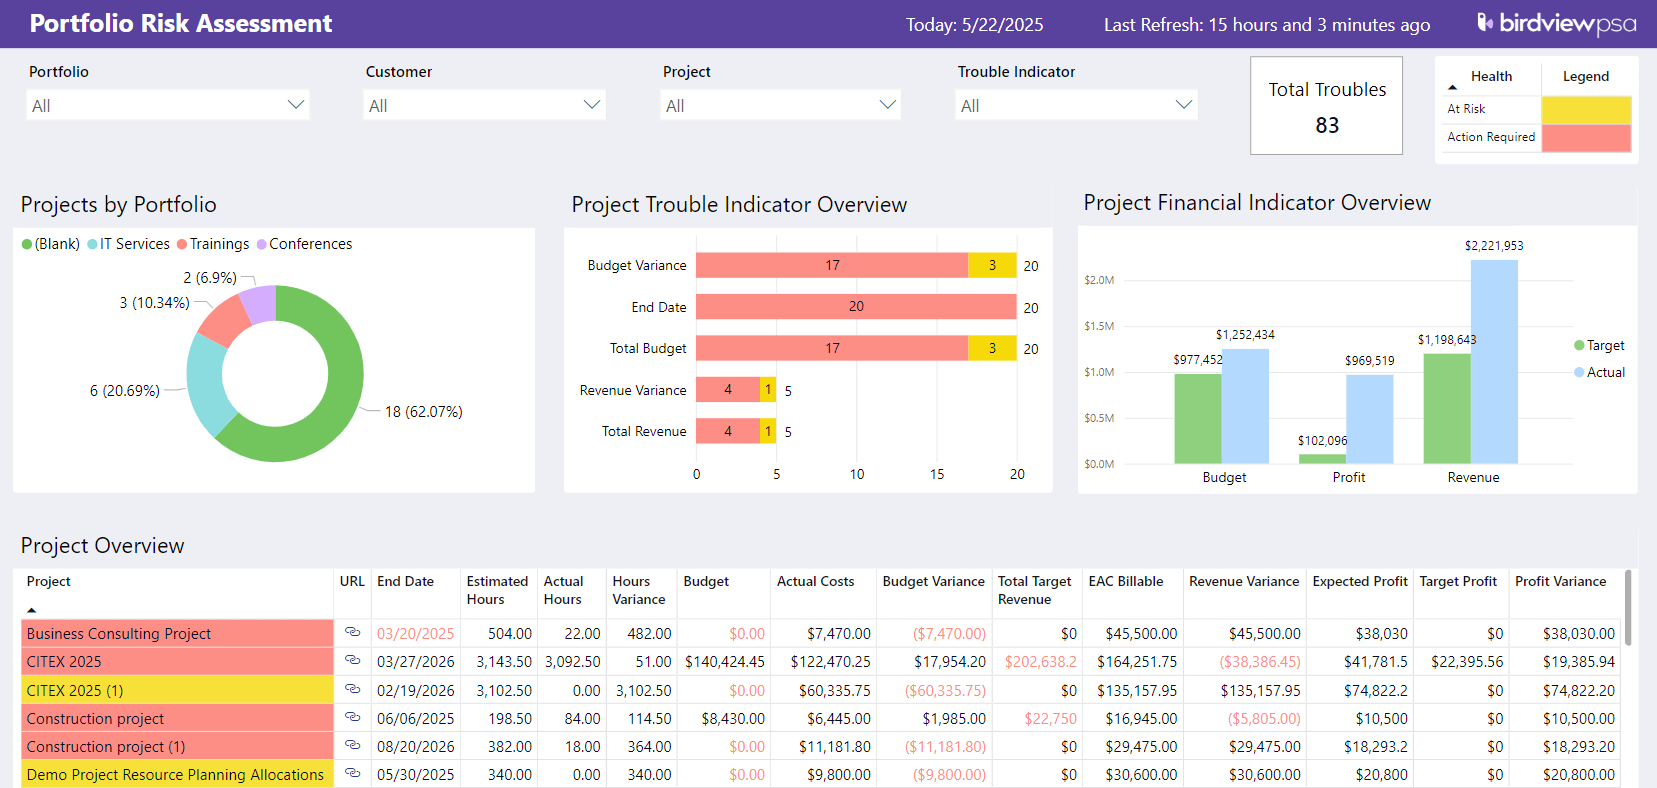
Example 3: Portfolio Risk Assessment Dashboard
This specialized dashboard centralizes timeline risks, financial risks, resource risks, and strategic risks across all portfolio projects. For CFOs, PMO leaders, and operational heads focused on governance and forecasting, this dashboard transforms risk management from reactive problem-solving to proactive threat prevention. It’s particularly valuable for organizations managing large, complex portfolios where individual project risks can threaten broader business objectives.
Best practices for building and using project portfolio dashboards
The truth is, most dashboards fail spectacularly at their primary job. They’re either information graveyards stuffed with every conceivable metric, or they’re so oversimplified that they tell you nothing useful.
Creating effective portfolio dashboards requires more than selecting the right metrics and designing attractive visualizations. Success depends on following proven practices that ensure your dashboard improves decision-making rather than just looking impressive in presentations.
1. Define what you want to measure first
Before you pick metrics or start designing, ask: what decisions will this dashboard support? Focus on real scenarios, like spotting budget overruns or resource underuse, and let those guide your metrics and layout.
2. Choose metrics that matter to each audience
Executives care about strategic goals; PMOs focus on delivery and resources; finance watches costs. Your dashboard should highlight what each group needs most, with flexible views that show primary metrics up front and deeper details when needed.
3. Don‘t overload the dashboard
If users can‘t find key info in 5 seconds, the dashboard‘s too crowded. Keep it clean and purposeful. Show what matters first, and avoid adding every available metric “just in case.”
4. Use visual elements (graphs, charts, color coding) wisely
Good visuals tell a clear story. Use intuitive charts and consistent color codes (red for risk, green for good) to guide the eye. Prioritize clarity over flashy design.
5. Keep data updated in real time
Outdated dashboards lead to poor decisions. Real-time updates build trust and ensure the data reflects current project conditions.
6. Use integrated tools to reduce manual effort
Manually updating dashboards isn‘t sustainable. Use integrated tools that sync data automatically from your project, finance, and resource systems to keep things accurate and low-maintenance.
📚 Read more: Best project portfolio management software 2025
How Birdview PSA helps you create effective portfolio dashboards
Having the right tools and platform capabilities is essential. Birdview PSA addresses the common challenges that organizations face when building portfolio visibility solutions.
- Unified view across project, resource, and financial data
When project data lives in one platform, resource information sits in another system, and financial data comes from a third source, creating unified portfolio views becomes a major integration challenge. Birdview PSA eliminates this problem by maintaining project, resource, and financial data within a single integrated platform.
- Customizable dashboards for different roles and needs
Recognition that different stakeholders need different dashboard views is built into Birdview PSA’s design philosophy. The platform provides dashboard customization capabilities that let organizations create role-specific views without duplicating data maintenance efforts.
- Real-time updates and built-in BI reporting tools
Manual dashboard maintenance kills long-term success. Birdview PSA’s reporting tools generate dashboard content automatically, ensuring information remains current without requiring significant manual effort.
- Drill-down capabilities from portfolio to task
Birdview PSA’s drill-down capabilities let users start with portfolio overviews and navigate progressively deeper into project details, resource assignments, and individual task status. This hierarchical navigation supports different analysis needs while maintaining context between portfolio-level patterns and project-level details.
- Visual tools like Gantt, workload views, and progress charts
Different stakeholders process information differently, so Birdview PSA provides multiple visualization options for presenting portfolio data. Gantt charts show timeline relationships and dependencies across projects. Workload views reveal resource utilization and capacity patterns. And progress charts track completion status and performance trends.
Final thoughts: build dashboards that drive decisions
Portfolio dashboards are strategic assets that can transform how organizations approach project leadership, resource allocation, and business value delivery. But realizing this potential requires moving beyond dashboard creation to dashboard utilization – building systems that actually improve decision-making rather than just providing better information displays.
If you’re ready to transform your portfolio management approach, Birdview PSA provides the integrated platform and dashboard capabilities needed to turn these concepts into reality. With unified data management, customizable dashboards, and built-in business intelligence tools, Birdview PSA eliminates the technical barriers that often prevent organizations from achieving effective portfolio visibility.