

Updated: August 2026
Resource forecasting is the practice of projecting future demand for people and skills against the capacity you expect to have available. It answers a different question than scheduling. Scheduling asks who works on what next week. Forecasting asks something harder: will the people you need in three months exist on the bench at all?
Resource scheduling, by contrast, is the assignment of named people to specific work on specific dates. One looks ahead at supply and demand in aggregate; the other commits names to a calendar.
This guide covers four things: what a forecast is built from, the steps to produce one, how often to revise it, and where forecasting hands over to the resource schedule.
What is resource forecasting?
Resource forecasting is the practice of estimating what resources a project or business will need in the future. The estimate rests on three inputs: past data, current trends, and expected demand.
It answers a simple question. Who and what will we need, and when?
A forecast is a planning document, not a schedule. It sets out the shape of future demand so leaders can act before the gap appears.
In business, forecasting drives three decisions:
- Staffing: how many people, with which skills, and by what date
- Budgets: what the planned work will cost
- Utilization: whether the people you have are used well, not idle and not overloaded
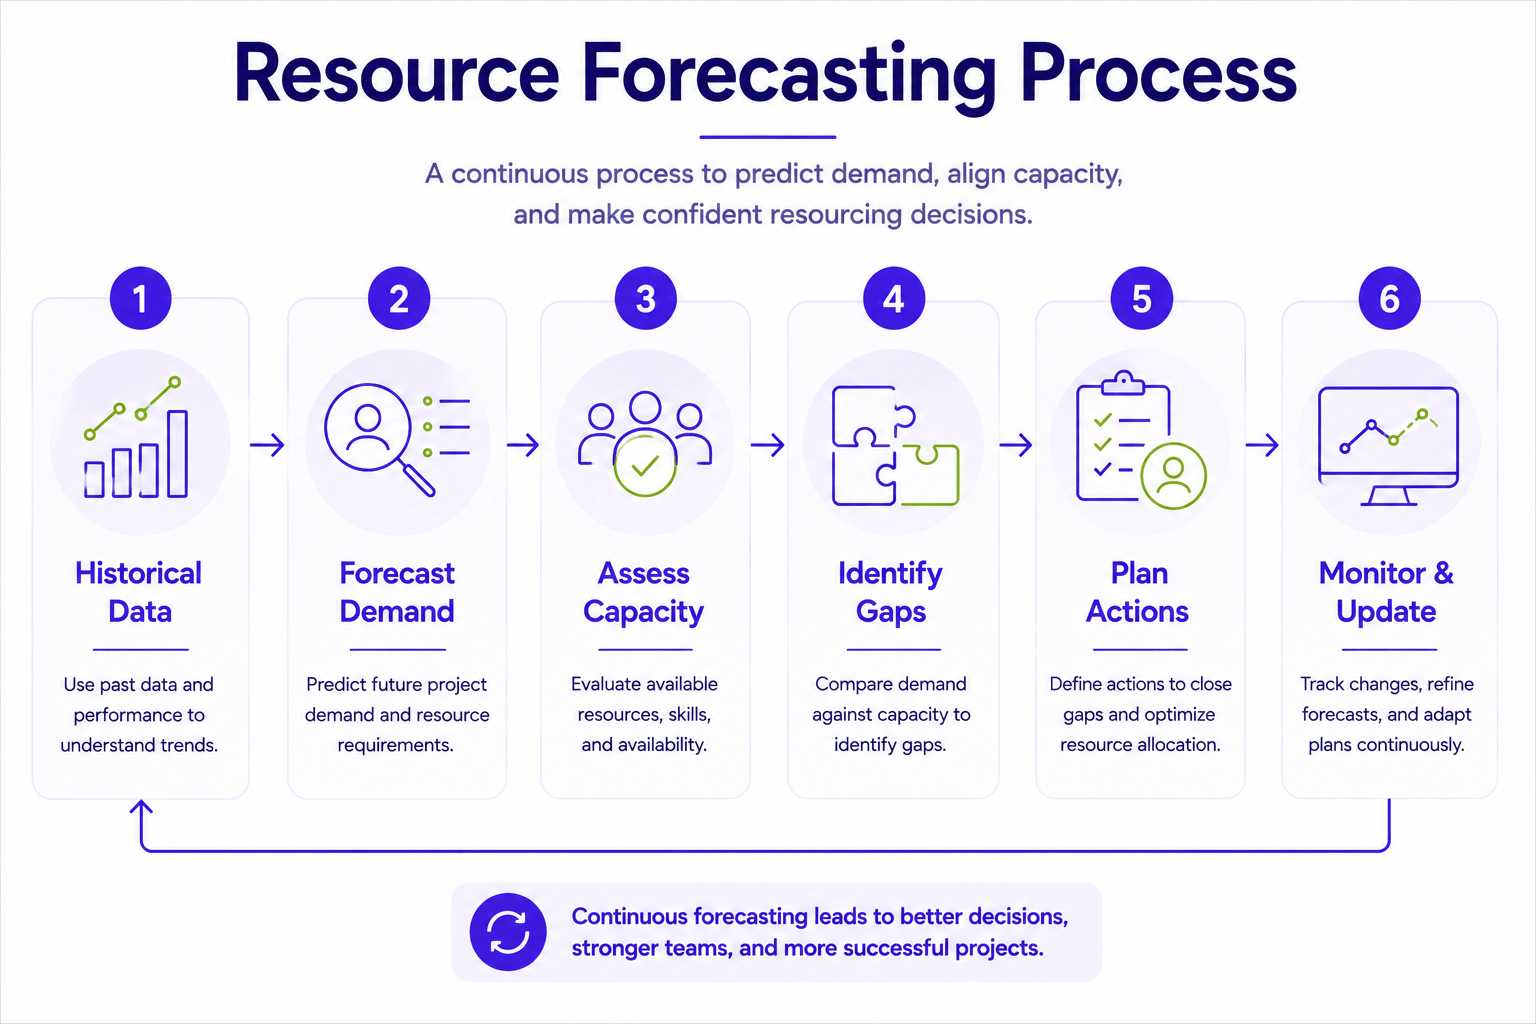
Resource forecasting vs resource scheduling
The two terms get used interchangeably. The confusion is expensive. A team that schedules well can still be short three developers next quarter, because nobody forecast the demand.
Forecasting looks forward over months. It estimates what the pipeline will require (how many engineers, which skills, at what cost) before the work is committed. Inputs: past utilization, the sales pipeline, planned time off. Output: a gap. Five engineers needed, two available.
Scheduling looks forward over days and weeks. It assigns named people to committed tasks inside a project timeline, so the right person is free on the right day. Inputs: the task list, dependencies, current availability. Output: an assignment. The mechanics of that step are covered in resource scheduling.
Planning sits between them. Resource planning decides how the people you have get spread across the work you have accepted. Forecasting tells you whether that split is even possible.
A quick test to keep them apart:
- Read the question you are trying to answer.
- If the answer is a name plus a date, that is scheduling.
- If it is a headcount number attached to a quarter, that is forecasting.
- If it resolves into a share of someone’s week, that is planning.
What happens when the two are treated as one
Firms that run forecasting inside the scheduling tool forecast only as far as the schedule reaches. That is the current quarter. Hiring lead times are longer than that.
The result is a recurring pattern. The gap surfaces the week the project starts. By then two options remain: contractors at a premium, or a delayed start.
Why is resource forecasting important?
Three reasons stand out.
It helps organizations plan ahead. A forecast shows whether you will have enough people to meet future demand. This matters most where demand swings up and down. Without a forecast, resource management there is guesswork.
It improves utilization. When you know what the next months need, you avoid both idle time and overloaded people. Both waste money. One burns hours you already paid for; the other burns the team.
It keeps budgets under control. Forecasts turn resource needs into numbers you can price. Staying inside budget becomes far easier than explaining an overrun after the fact.
Why this works
A forecast changes the order of decisions. Instead of reacting to a gap, you see it early and choose how to close it:
- Spot the shortfall or surplus in the forecast.
- Decide whether to reassign, hire, or move a deadline.
- Act while the options are still cheap.
That third step is the whole point. Act late, and the only options left are overtime and contractors.
Challenges in resource forecasting
Forecasting pays off. But several things get in the way of an accurate forecast, and most teams hit all of them.
Data quality and availability: Bad or missing historical data produces bad forecasts. Clean data, kept current, is the base everything else sits on.
External factors: Market shifts, industry trends and one-off events change what you need and when. They are hard to model. Build them in anyway.
Project complexity: Multi-stream projects pull in many skills at once. The more moving parts, the more the forecast depends on careful modeling rather than a single average.
Human factors: People leave. People get sick. These swings in availability are the hardest to predict, and they hit delivery dates directly.
Uncertainty: No technique removes it. Plan to adjust as new information lands.
Resource forecasting challenges at a glance
| Challenge | Why it affects the forecast | How to improve forecasting |
|---|---|---|
| Poor or inconsistent data | Incomplete historical data, outdated schedules, or inconsistent resource information create unreliable assumptions. | Standardize data collection and regularly validate project, resource, and availability information. |
| Changing project demand | Projects can be added, delayed, cancelled, or expanded, changing future resource requirements. | Refresh forecasts regularly and include both committed work and probability-weighted pipeline demand. |
| Complex skill requirements | Available headcount does not necessarily mean the required roles, skills, or expertise are available. | Forecast by role and skill rather than relying on total headcount. |
| Resource availability changes | Leave, turnover, illness, training, and competing projects can reduce expected capacity. | Include planned leave, existing allocations, utilization targets, and known availability changes. |
| External factors | Market conditions, client decisions, and shifting business priorities can alter future demand. | Update assumptions frequently and use scenario planning to test significant changes. |
| Forecast uncertainty | Future workload can never be predicted with complete certainty. | Use probabilities, alternative scenarios, and regular forecast updates instead of relying on one fixed prediction. |
Where companies go wrong
Most forecasts fail on the inputs, not the math. Run this check before you trust a number:
- Historical project data is complete and recent
- Skills and roles are recorded, not just headcount
- Leave, notice periods and known absences are in the system
- Pipeline work carries a probability, not a yes/no flag
- Someone owns the forecast and updates it on a fixed cadence
Close these gaps and resource forecasting starts paying for itself. Utilization improves. Projects land. The whole operation runs tighter.
Benefits of effective resource forecasting
Good forecasting pays off in five ways.
Better resource allocation. Forecasting lets you spread people across projects sensibly. No one is buried, no one sits idle. Productivity goes up and costs go down.
Sharper decisions. Once you know what you will need, hiring, training, and outsourcing calls get easier. You use the team you have better, and projects run cleaner.
Less risk. Forecasting surfaces resource gaps early. Close them in advance and you avoid the delays and shortages that come from finding out too late.
Budgets that match reality. A forecast ties money to future demand. Funds go to the right projects and areas, so overruns shrink.
Clearer conversations with clients and executives. An open forecast lets you state needs and limits plainly. That builds trust. Teams collaborate better when everyone sees the same picture.
Why this works
Each benefit rests on the same thing: visibility ahead of time. A schedule tells you what is booked today. A forecast tells you what is coming. Decisions made weeks early cost less than decisions made under pressure. Hiring, reprioritizing, and renegotiating all get cheaper with lead time.
Quick check: are you getting these benefits?
- You can name your resource gaps for the next quarter.
- Hiring and outsourcing decisions reference the forecast.
- Budget requests are backed by forecast demand, not last year’s numbers.
- Clients hear about capacity limits before they become delays.
- Nobody on the team is at 120% while someone else is at 40%.
What information is needed for accurate resource forecasting?
A forecast is only as good as its inputs. Five sets of data do the heavy lifting.
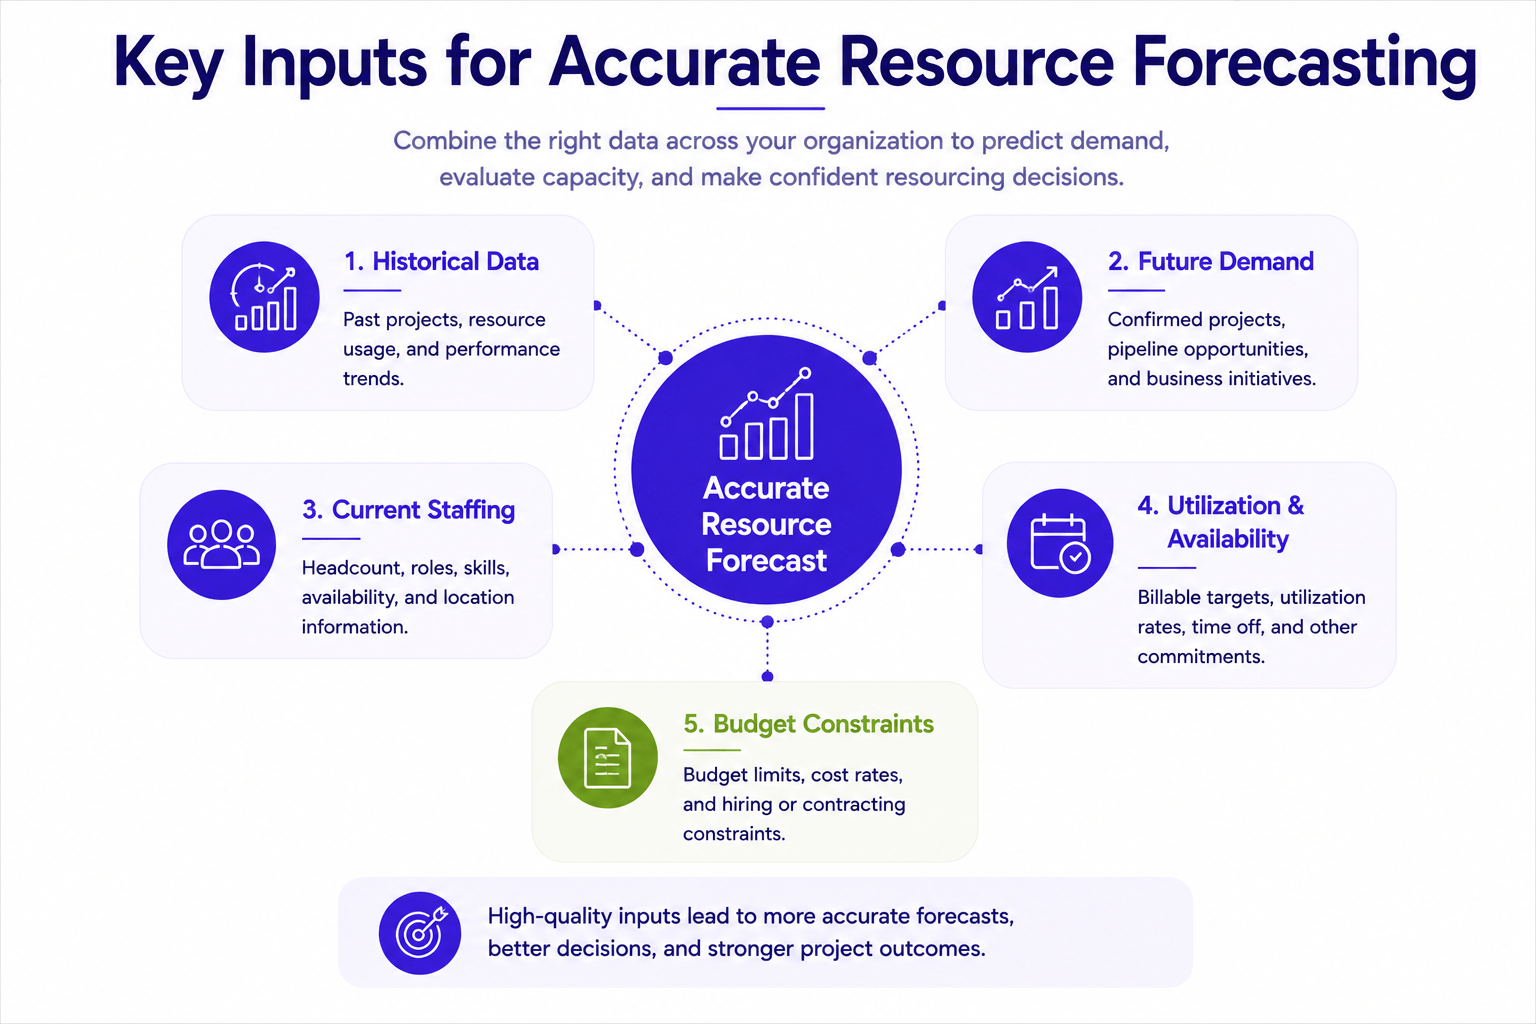
1. Historical data
Past projects tell you what work actually costs in people and hours. Pull staffing levels, delivery timelines, and utilization from completed work. Patterns show up fast.
2. Future demand
Next, look at what’s coming: new projects, planned initiatives, and any shift in client volume. Connect your CRM (the sales pipeline) to your resource management platform. That link is what turns demand forecasting from a guess into a number. In Birdview, for example, opportunities from HubSpot or Salesforce convert into forecasted demand automatically, so a deal moving stages in the pipeline shows up in the resource forecast without anyone re-entering data.
3. Staffing levels
You need a current headcount you trust. Who works here, what skills they hold, and which roles sit open.
4. Resource utilization
Today’s usage predicts tomorrow’s gaps. Get a clear picture of how people spend their time, including the inefficiencies and the bench time nobody logs. Underused capacity is still capacity.
5. Budget constraints
Money sets the ceiling. Factor in financial limits, caps on headcount, and any other hard limits on what you can add.
Data readiness checklist
- Historical project data, exportable and reasonably clean
- Sales pipeline connected to the resource management tool
- Current headcount with skills and open roles mapped
- Utilization tracked per person, not just per team
- Budget and hiring limits documented for the forecast period
Where companies go wrong
Most teams collect four of these five and call it done. The missing piece is usually the pipeline link. Without it, forecasts cover only signed work, so every deal that closes brings a crunch. The second common gap is utilization measured at team level instead of person level. Team averages hide the overloaded specialist and the analyst with three free days a week. Both problems look minor on a dashboard. Both wreck a forecast.
How to forecast resources: a step-by-step process
A forecast is a repeatable calculation, not a once-a-year estimate.
1. Collect historical utilization. Pull actual hours by person, role, and project type over the last four quarters at least. Memory is the single largest source of forecast error. Unbilled and overrun work vanishes from recollection.
2. Convert the pipeline into demand. Take opportunities from the CRM with their probability and expected start date. Translate each one into roles and hours. A 60% opportunity does not mean 60% of the people. It means the role is needed in 60% of the futures you are planning for.
3. Subtract known unavailability. Vacation, statutory holidays, training, parental leave, and the internal work that never reaches a project plan. A forecast built on nominal capacity overstates what you have by 15–25% in most service teams.
4. Compare demand against capacity by skill, not by headcount. Ten available people do not help if the shortage is two people with a specific certification. That is why the forecast reads from the same skill profiles the staffing process uses.
5. Model at least two scenarios. One where the pipeline lands as expected. One where the largest opportunity slips a quarter. The gap between them is the size of the decision you are making.
6. Name the action for each gap. Hire, subcontract, retrain, or decline the work. A forecast that produces a chart but no decision is unfinished.
Where companies go wrong
Most teams stop after step four. They see the gap, chart it, and share it. Then nothing changes, because no one owns the response. The other common failure is step three. Planners use nominal capacity because it is easier to pull, and the forecast is wrong before anyone reads it.
How often to revise a forecast
Monthly for the next two quarters. Quarterly beyond that.
Cadence matters more than precision. A rough forecast revised every month beats an exact one produced once a year. The pipeline behind it stops being true within weeks.
Some changes can’t wait for the next cycle. Revise straight away when:
- a large opportunity moves in or out of the pipeline
- a key person resigns
Why this works: frequent, rough passes keep the forecast close to reality. One precise annual pass is out of date before anyone reads it.
Practical use
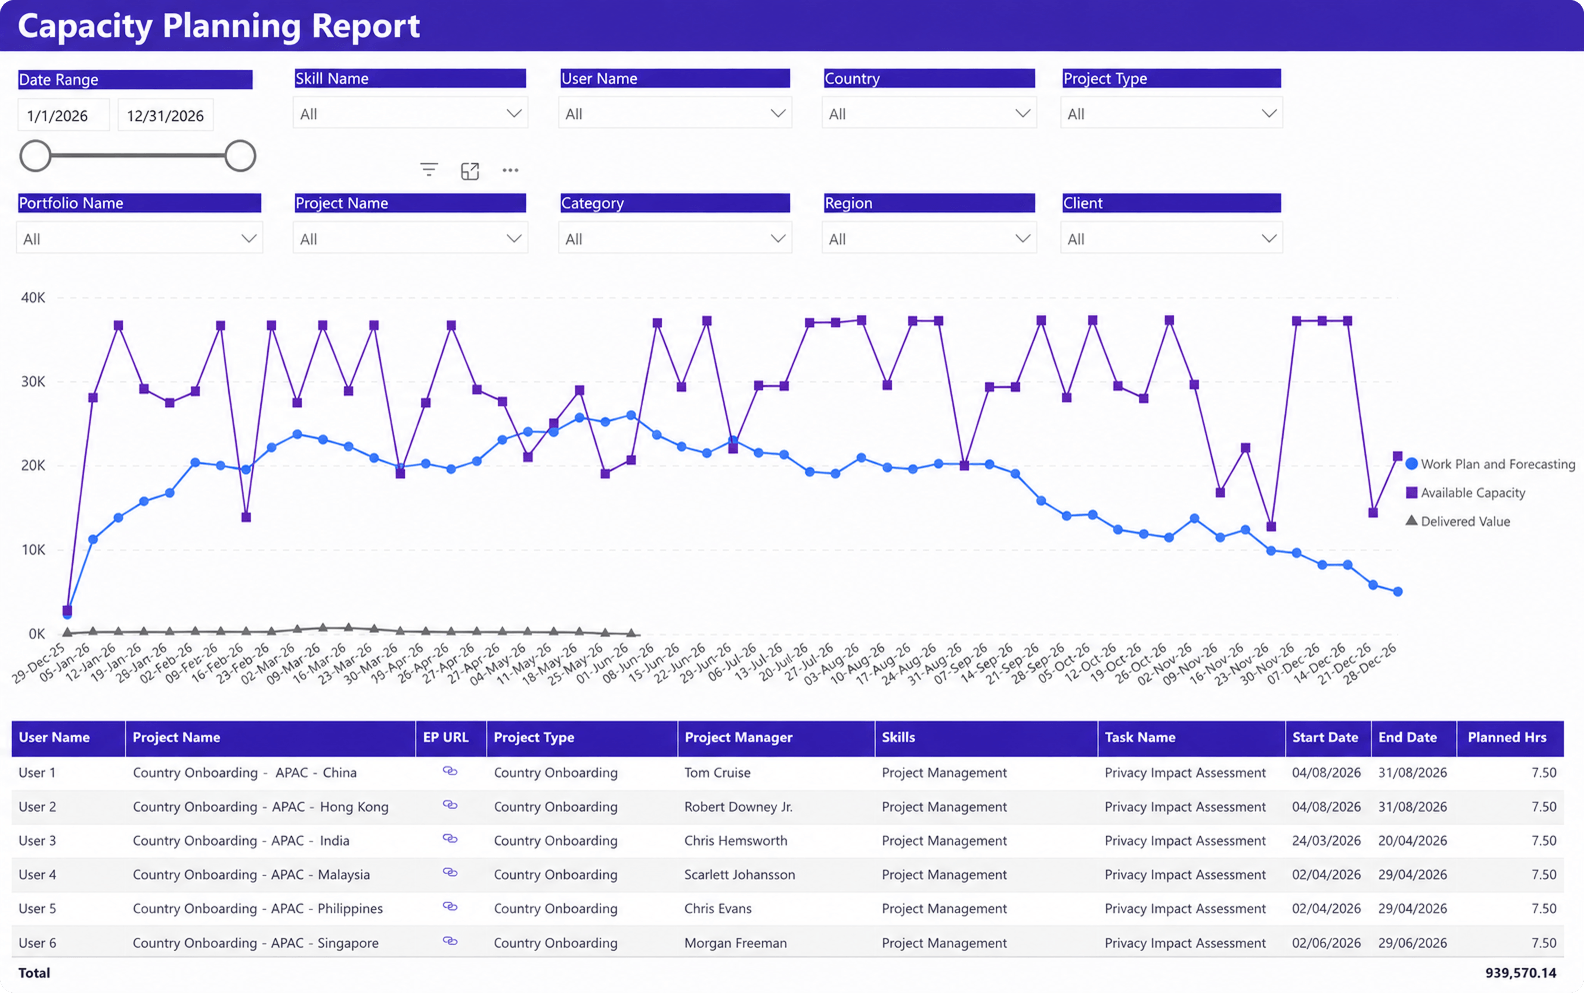
Forecasting earns its keep when it exposes the gap between what a project will need and what the team can actually supply.
Example:
Say an engineering company has a new project coming up that calls for a specific area of expertise. The forecast shows the company needs 5 more engineers with those skills. The resource capacity report tells a different story: only 2 such engineers are free. That is a gap of three. The company starts recruiting employees or contractors to close it.
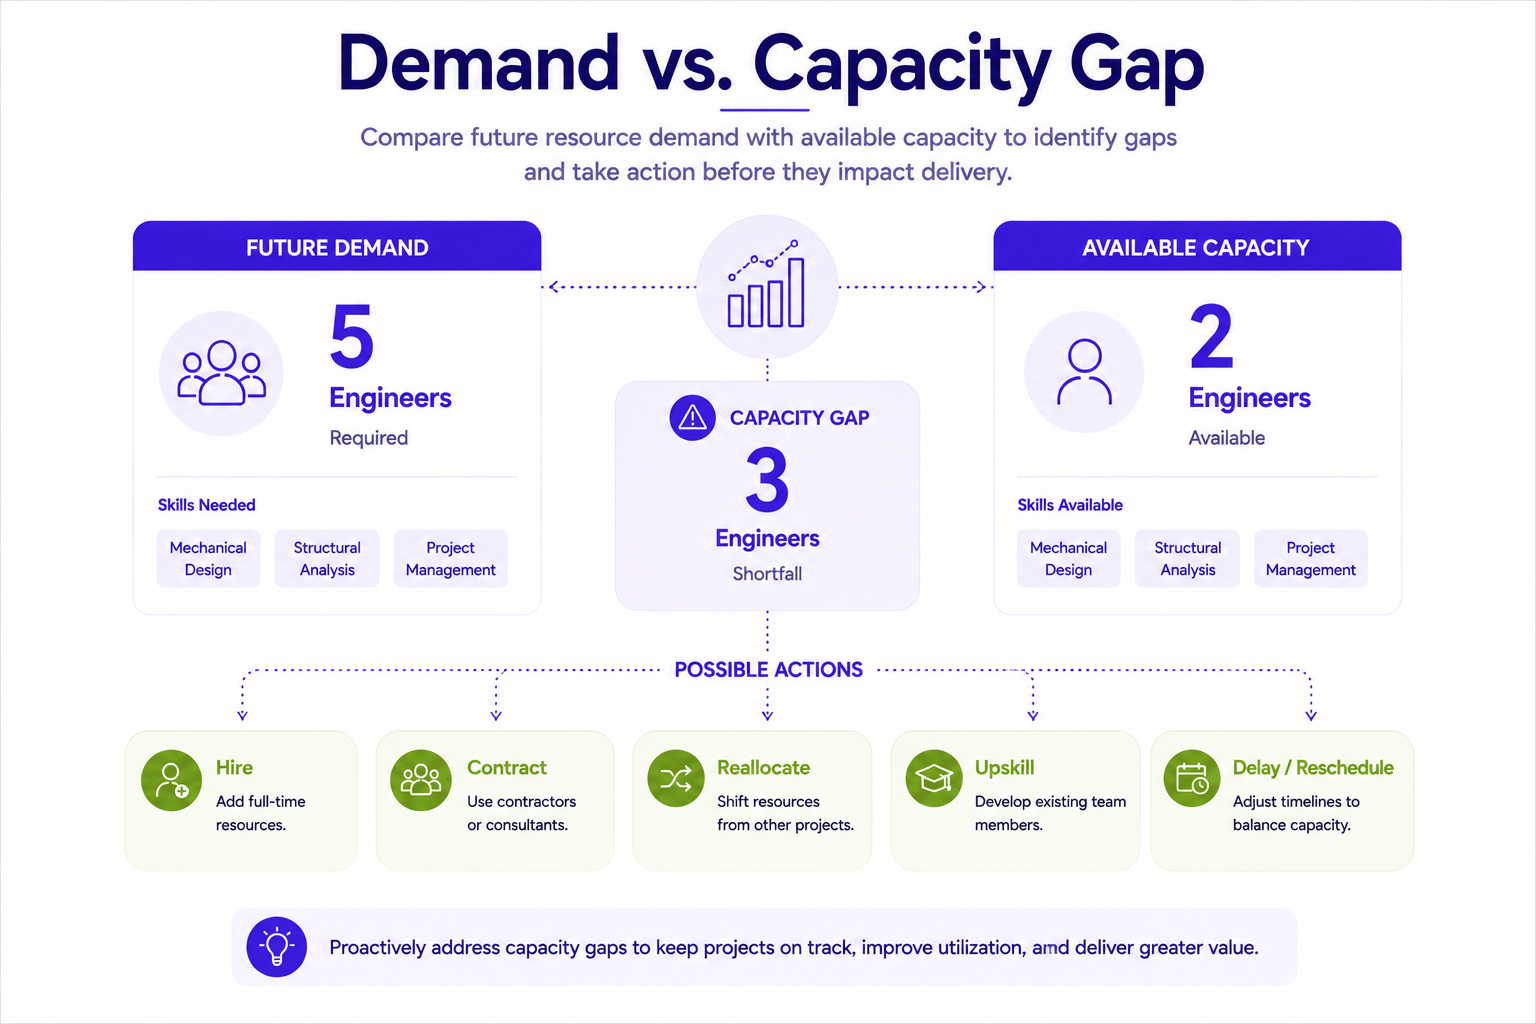
How to close a gap like this:
- Run the forecast to size the demand by skill, not just by headcount.
- Pull a current resource capacity analysis for the same skill.
- Subtract one from the other. The remainder is your gap.
- Decide how to fill it: hire, contract, train, or move the deadline.
- Re-check the gap once the fix is in motion.
Why this works
Forecast and capacity data answer two different questions. One says what the work demands. The other says what the bench holds. Read together, they turn a staffing surprise into a scheduled decision. You make that decision weeks early, while hiring and training are still options. That is how teams keep projects on time and on budget with the right skills in place.
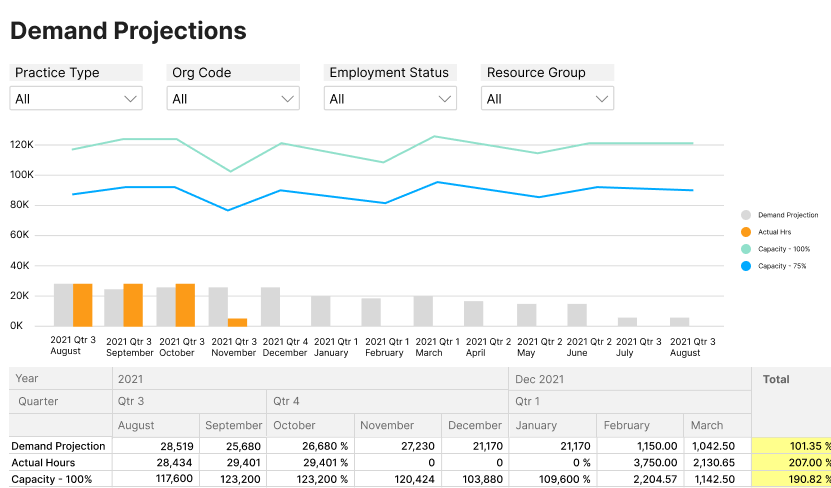
Monitor forecast demand against available capacity
Resource scenario planning and impact analysis
Definition
Resource scenario planning and impact analysis both answer one question: what happens to the project if the resource picture changes? Here is what each one does.
What is resource scenario planning
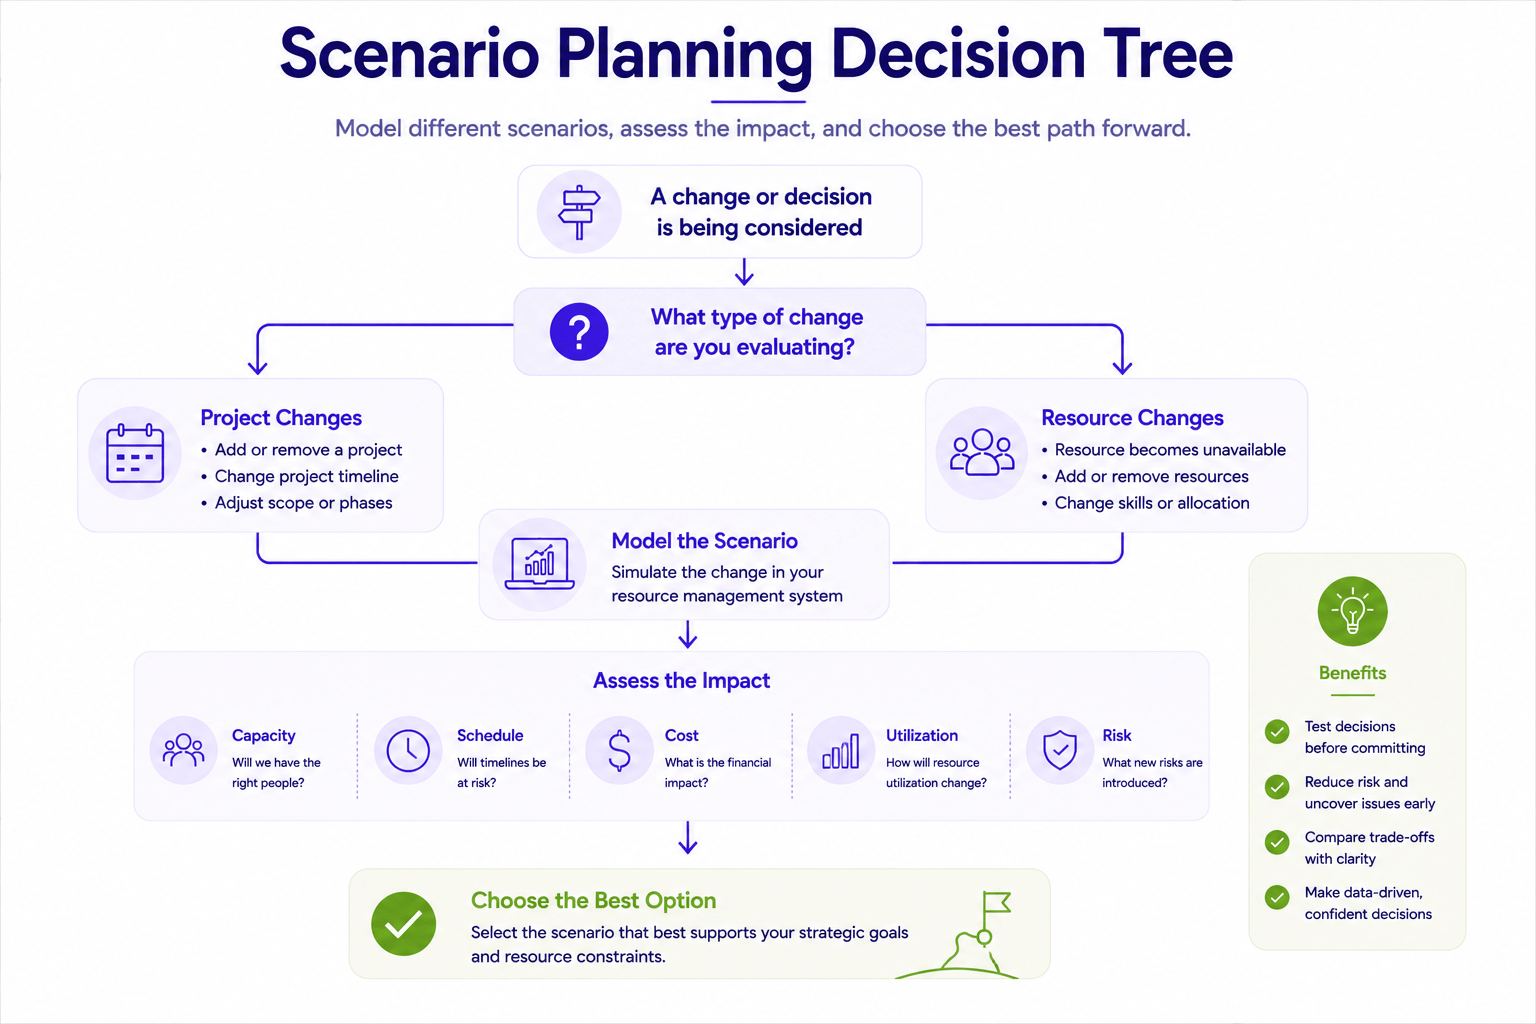
Resource scenario planning is the practice of building “what if” versions of your resource plan.
A project manager builds a scenario: what happens if two more people join this project, or two leave it. Each version shows a different delivery date, cost, and workload. Compare them, and the best allocation strategy becomes visible.
How to run a scenario in four steps:
- Pick one change to test: add two people, remove two, shift a start date.
- Apply that change to the current plan.
- Read what moves: dates, cost, workload, quality.
- Compare the versions side by side and choose.
What is resource impact analysis
Resource impact analysis is the measurement of what a resource change does to the project. It looks at cost, schedule, quality, risk, and scope.
Suppose a project has to lose two people. Impact analysis shows the price of that decision in milestones, budget, and quality, before anyone signs off. Nobody guesses. You allocate with open eyes and set expectations the client will recognize later.
Why this works
Both techniques move the argument earlier. Without them, the conversation about a missed deadline happens only after the date has passed. With them, it happens while the plan is still on the screen and still changeable. That is the whole difference: a scenario costs an hour, a broken commitment costs a quarter.
Examples of scenario planning and impact analysis
“If you want to make God laugh, tell him your plans.” Project managers know the saying well. Your project will deviate from the plan, that is the reality. What separates a strong project manager is anticipating the change, and its consequences, before either arrives.
Four situations where scenario planning earns its keep:
- Choosing next year’s portfolio. There are 15 projects and initiatives in the pipeline. The budget covers only 5 or 6. We need several scenarios of what to run, each built on a different priority: budget, timeline, or resources.
- Picking an allocation strategy. We need several resource allocation scenarios across 5 upcoming projects, one per optimization goal: lowest cost, shortest timeline, highest strategic value.
- Testing a schedule change. We shift dates, dependencies, or duration on one project. What happens to resources on the others?
- Testing a resource change. We move people between projects. Again: what happens to the rest?
How to run either exercise:
- Fix the question. One change, one decision, one portfolio choice.
- Copy the current plan into a scenario. Never edit the live one.
- Make the change: dates, dependencies, duration, or assignments.
- Read the ripple across every other project, not just the one you touched.
- Compare scenarios side by side against the criterion you care about.
- Commit the winner. Keep the rejected options; they are your fallback.
Common resource planning scenarios to model
| Scenario | Change to test | What to evaluate | Possible action |
|---|---|---|---|
| New project enters the pipeline | Add forecast demand for the potential project. | Available capacity, required skills, utilization, timing, and cost. | Accept, delay, hire, contract, or reallocate resources. |
| Key resource becomes unavailable | Remove or reduce the resource’s available capacity. | Schedule impact, workload distribution, skills coverage, and delivery risk. | Reallocate work, use a contractor, or adjust the schedule. |
| Project timeline changes | Move the project’s start date, end date, or major phases. | Resource conflicts, future capacity, utilization, and dependencies. | Reschedule work or redistribute resources across projects. |
| Hiring scenario | Add planned resources, roles, or skills to future capacity. | Capacity gap, utilization, hiring cost, and expected demand. | Hire, use contractors, upskill existing staff, or postpone hiring. |
| Project mix or priorities change | Add, remove, delay, or reprioritize projects. | Capacity, resource conflicts, cost, strategic value, and delivery feasibility. | Select the project mix that best fits available resources and business priorities. |
Why this works
Together, impact analysis and scenario planning turn risk management from reactive to proactive. Problems surface while there is still time to act. That lifts the odds of project success. It also cuts delays, lowers costs, and keeps clients satisfied.
AI-powered resource forecasting in organizations
AI-powered resource forecasting is the use of automation, data analysis, and predictive modeling to project future resource needs. More and more organizations lean on it to sharpen their planning, and decisions get sharper as a result. Here is what AI does for a forecast:
Data analysis and pattern recognition: AI algorithms read large volumes of historical data and find patterns, trends, and links. Past allocation, utilization, and project outcomes hold insights that manual analysis misses.
Demand forecasting: AI reads many data sources at once (market trends, customer behavior, outside factors) and projects future demand. Teams see resource needs early and adjust the plan.
Machine learning models: These models learn from historical data and grow more accurate over time. They weigh dozens of variables that shape resource needs.
Real-time updates: AI-driven tools report on resource use and project progress as it happens. Plans shift on the fly, and resources move with changing conditions.
Scenario simulations: AI platforms simulate scenarios against different assumptions. Teams see the outcome of each allocation strategy before committing to one. Uncertainty becomes part of the decision, not a blind spot.
Integration with business software: AI connects to the systems you already run: CRM, project management, HR. Data flows between them, so forecasts rest on current information.
Resource optimization: AI algorithms balance allocation across projects using skill sets, availability, and priorities. The result is less idle capacity and fewer overloaded people.
How to introduce AI into your forecasting process
- Clean up the inputs first: project data, timesheets, skills, availability.
- Connect the source systems so data flows without manual export.
- Start with one use case (demand forecasting or utilization), not all seven.
- Compare AI output against your own forecast for two or three cycles.
- Run scenarios before you trust a single number.
- Expand to more projects once the model tracks reality.
Where companies go wrong
They buy the tool before fixing the data. A model trained on half-empty timesheets returns half-empty answers. The second mistake is treating output as a decision. AI shows the pattern; a manager still owns the call on who works on what.
AI changes what a forecast can do. With AI-generated insight and predictive modeling, firms see resource needs coming. Utilization improves, and the reasoning behind each decision is stronger. Solutions differ widely, so pick the one that fits your requirements and objectives.
FAQ: resource forecasting
What is the difference between resource forecasting and resource scheduling?
Forecasting estimates future capability needs over months. It produces a gap. Scheduling assigns named people to committed tasks over days and weeks. It produces an assignment. Forecasting tells you whether the schedule you intend to build is possible.
How far ahead should a resource forecast look?
Far enough to act on it. If hiring takes three months, a forecast that reaches only two months out cannot change anything. Most service firms forecast two quarters in detail and four at the portfolio level.
What data does a forecast need?
Four inputs:
- Historical utilization by role
- The sales pipeline, with probabilities and start dates
- Known unavailability
- Skill profiles for the current team
The first and the last are the two firms most often lack.
Can resource forecasting be done in a spreadsheet?
For a single team, yes. It stops working once the pipeline and the delivery plan live in different files owned by different people. The forecast then becomes a snapshot of two sources that have already drifted apart.
How often should a resource forecast be revised?
Monthly for the near horizon. And immediately after any event that moves capacity or demand: a signed deal, a lost one, a resignation, a slipped start date. A forecast revised quarterly is a document. A forecast revised on events is a decision tool.
How accurate should a forecast be?
Accurate enough to change a decision. Chasing precision past that point costs more than the error it removes. The useful test: the forecast would have to be wrong by a lot before you would act differently.
Where companies go wrong: skill-level forecasting
Skills are where most firms are weakest, and this is not a professional-services problem alone. Deloitte studied skills-based organizations: 1,021 workers and 225 business and HR executives. Only 10% of HR executives say they classify skills into a working taxonomy, even though most have an effort under way [1]. Without that taxonomy a forecast can only count heads. The World Economic Forum’s Future of Jobs Report 2025 puts a large share of today’s skill sets on track to change by 2030 [2]. The skills you forecast against are themselves moving.
Sources
- Deloitte Insights – The skills-based organization: a new operating model for work and the workforce – https://www.deloitte.com/us/en/insights/topics/talent/organizational-skill-based-hiring.html
- World Economic Forum – Future of Jobs Report 2025, skills outlook – https://www.weforum.org/publications/the-future-of-jobs-report-2025/in-full/3-skills-outlook/

