- The most important consulting KPIs include billable utilization, realization rate, project profitability, project margin, revenue forecast accuracy, client profitability, and resource capacity utilization.
- Effective consulting dashboards combine financial, delivery, and resource metrics to provide a complete view of business performance.
- Utilization alone is not enough. Consulting firms should track profitability, realization, and forecasting metrics alongside resource performance to understand the true drivers of business success.
- Project profitability and project margin help consulting leaders identify delivery issues, pricing challenges, and margin erosion before they affect overall financial results.
- Revenue forecast accuracy and capacity utilization support better hiring, staffing, and investment decisions by providing visibility into future demand and resource needs.
- Different stakeholders focus on different KPIs. CFOs prioritize profitability, forecasting, and revenue metrics, while Operations leaders focus on utilization, capacity, project health, and delivery performance.
- Dashboard examples such as project score cards, resource utilization dashboards, capacity planning dashboards, executive dashboards, and revenue and profit dashboards help leaders connect operational activity to financial outcomes.
- Many consulting firms struggle with disconnected systems, inconsistent KPI definitions, manual reporting processes, and limited visibility into profitability, making it difficult to trust and act on performance data.
- The most effective KPI dashboards are built on connected project, resource, time-tracking, and financial data, providing leaders with more accurate reporting and faster decision-making.
- Consulting firms that focus on a small set of business-critical KPIs and review them consistently are better positioned to improve profitability, optimize resource utilization, and support sustainable growth.
Consulting KPIs help firms measure the performance indicators that directly affect revenue, profitability, utilization, and growth. The most effective consulting dashboards combine delivery, resource, financial, and forecasting metrics in a single reporting framework, giving leaders the visibility they need to make better staffing, pricing, and investment decisions.
Many consulting firms collect large amounts of operational and financial data. They track projects, timesheets, budgets, invoices, utilization, and forecasts. The challenge is not a lack of information. The challenge is knowing which metrics matter and how they connect to business outcomes.
A dashboard that focuses on the right consulting KPIs helps leaders identify risks earlier, improve resource allocation, increase profitability, and make more confident decisions about future growth.
What are the most important consulting KPIs?
The most important consulting KPIs include billable utilization rate, realization rate, project profitability, project margin, revenue forecast accuracy, client profitability, and resource capacity utilization. Together, these metrics help consulting firms improve profitability, forecast demand more accurately, optimize resource allocation, and make better business decisions.
Why consulting firms struggle to measure performance
Many consulting firms track large amounts of project and financial data but lack visibility into the metrics that directly affect profitability, utilization, and growth.
As firms grow, information often becomes fragmented across multiple systems. Project managers may work in one platform, finance teams in another, and resource managers in spreadsheets. As a result, leaders spend more time gathering data than analyzing it.
Disconnected systems
Consulting firms frequently manage projects, resources, time tracking, CRM data, and financial information in separate applications. This creates reporting silos. Teams may produce different versions of the same metric depending on where the data originates. When leaders cannot trust the numbers, dashboards lose value.
Delayed reporting
Many organizations still rely on manual reporting processes. By the time utilization reports, project status updates, and financial summaries reach executives, the information may already be outdated. Problems that could have been addressed early become much more difficult to solve.
Inconsistent KPI definitions
Different teams often calculate the same metric differently. One department may define utilization based on billable hours, while another includes internal work. Finance may calculate project margins differently from delivery teams. These inconsistencies create confusion and reduce confidence in reporting.
Limited visibility into profitability
Revenue alone does not tell the full story. A project can generate significant revenue while producing little profit. Similarly, a large client may appear valuable until labor costs, write-offs, and discounts are considered. Without visibility into profitability metrics, firms can make decisions based on incomplete information.
What makes a good consulting KPI dashboard?
A good consulting KPI dashboard goes beyond reporting numbers. It provides clear, actionable insights that help leaders understand performance and make better decisions across delivery, finance, and operations.
The most effective dashboards share a few key characteristics:
- They focus on business outcomes, not just activity metrics
- They combine operational and financial data in one view
- They track trends over time instead of relying on static snapshots
- They support day-to-day decision-making across teams
The most important consulting KPIs for delivery and profitability
Not every metric deserves executive attention.
The most valuable consulting KPIs help firms understand how effectively they generate revenue, utilize resources, deliver projects, and maintain profitability.
Billable utilization rate
Billable utilization measures the percentage of available time consultants spend on billable client work. It is one of the strongest indicators of consulting efficiency and revenue generation. Low utilization may indicate excess capacity, while high utilization can increase delivery risk and burnout. Because labor is the largest cost for most consulting firms, utilization directly affects profitability.
Realization rate
Realization rate measures the percentage of billable work that is ultimately invoiced and collected. Discounts, write-offs, scope changes, and unbilled work can reduce realization and create revenue leakage. High utilization combined with low realization often signals delivery or billing inefficiencies.
Project profitability
Project profitability compares project revenue against delivery costs. It helps consulting firms identify which engagements generate healthy returns, improve pricing decisions, and uncover delivery inefficiencies before they affect overall business performance.
Revenue forecast accuracy
Revenue forecast accuracy compares projected revenue against actual results. Accurate forecasts support hiring, budgeting, and investment decisions, while poor forecasts can lead to resource shortages, excess capacity, or missed growth opportunities.
Resource capacity utilization
Resource capacity utilization measures future workload distribution and available capacity across teams. It helps leaders anticipate resource shortages, balance workloads, and make more informed staffing decisions before delivery is affected.
Client profitability
Client profitability measures profitability at the account level. It helps consulting firms identify their most valuable client relationships, understand the impact of discounts and scope changes, and make better account management decisions.
Project margin
Project margin measures profit as a percentage of project revenue. Tracking margins throughout delivery helps firms identify budget overruns, inefficient resource use, and profitability risks before projects are completed.
Dashboard examples for consulting firms
The most effective consulting dashboards focus on a specific business objective. Rather than trying to display every available metric, they organize KPIs around the decisions leaders need to make.
Consulting profitability dashboard
What it shows
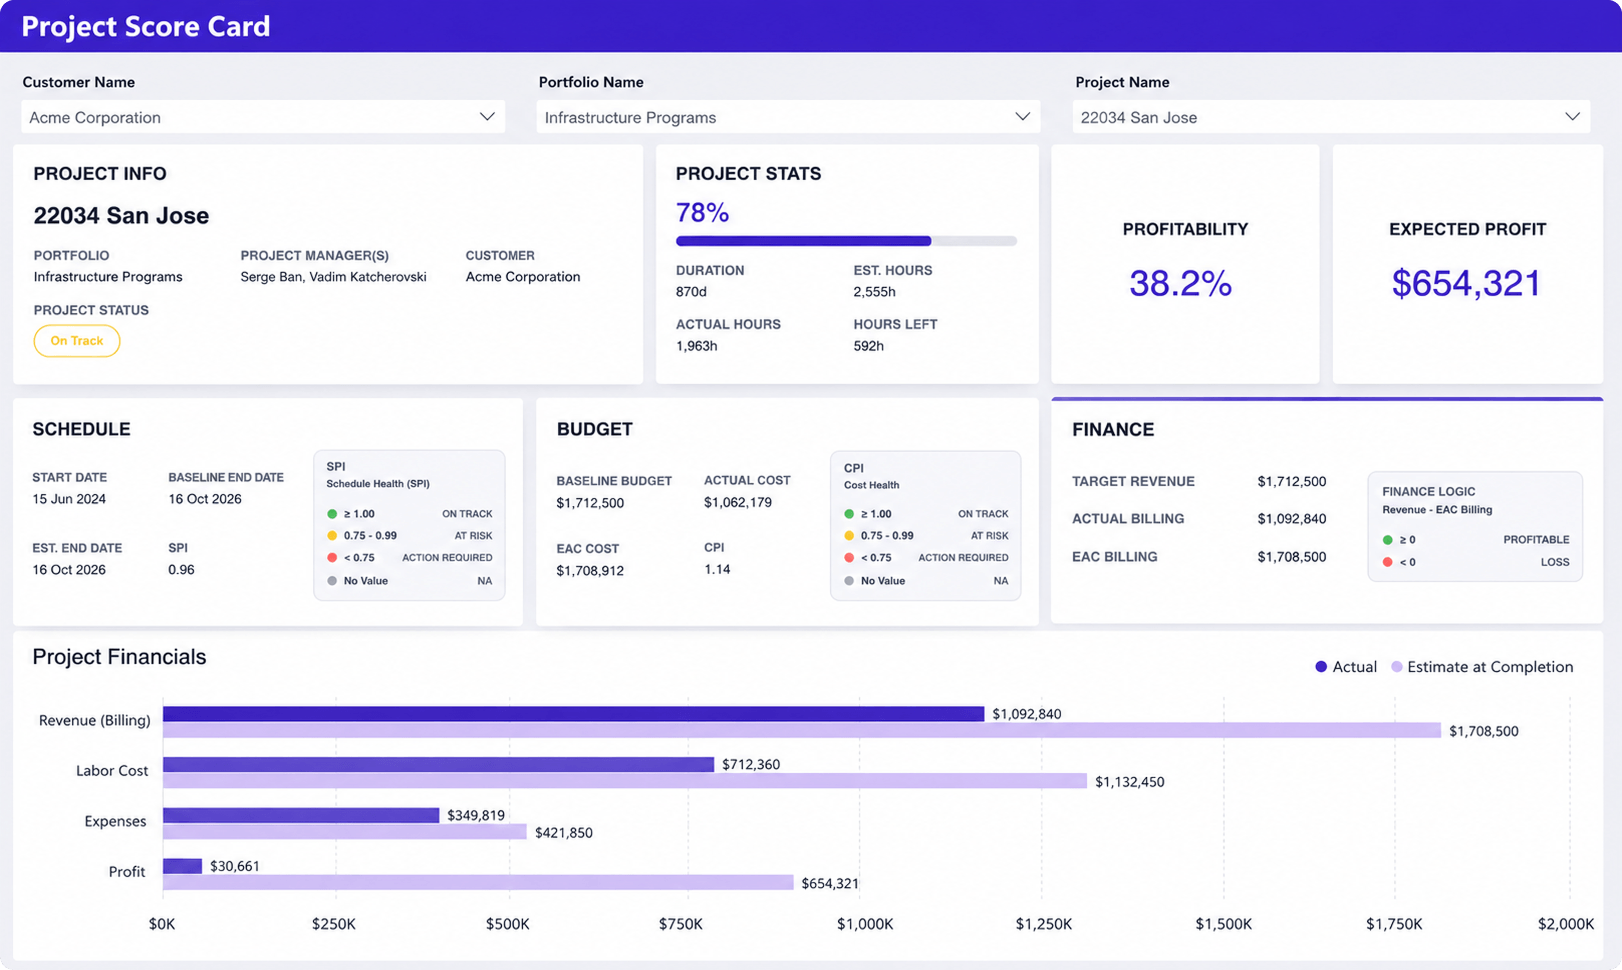
A project score card combines project health, budget performance, and financial results in a single view. It helps leaders compare actual performance against forecasts and quickly assess whether a project is on track to meet its profitability goals.
KPIs included
- Project status
- Schedule Performance Index (SPI)
- Cost Performance Index (CPI)
- Budget vs actual cost
- Revenue (billing)
- Labor costs
- Expenses
- Profitability percentage
- Expected profit
- Actual vs estimated-at-completion billing
- Actual vs estimated-at-completion costs
- Hours consumed vs hours remaining
Why consulting leaders use it
Project score cards help consulting leaders connect project delivery performance with financial results. By tracking schedule health, budget performance, revenue, costs, and profit in one place, they can identify risks earlier, improve forecasting accuracy, and protect project margins before issues affect profitability.
Resource utilization dashboard
What it shows
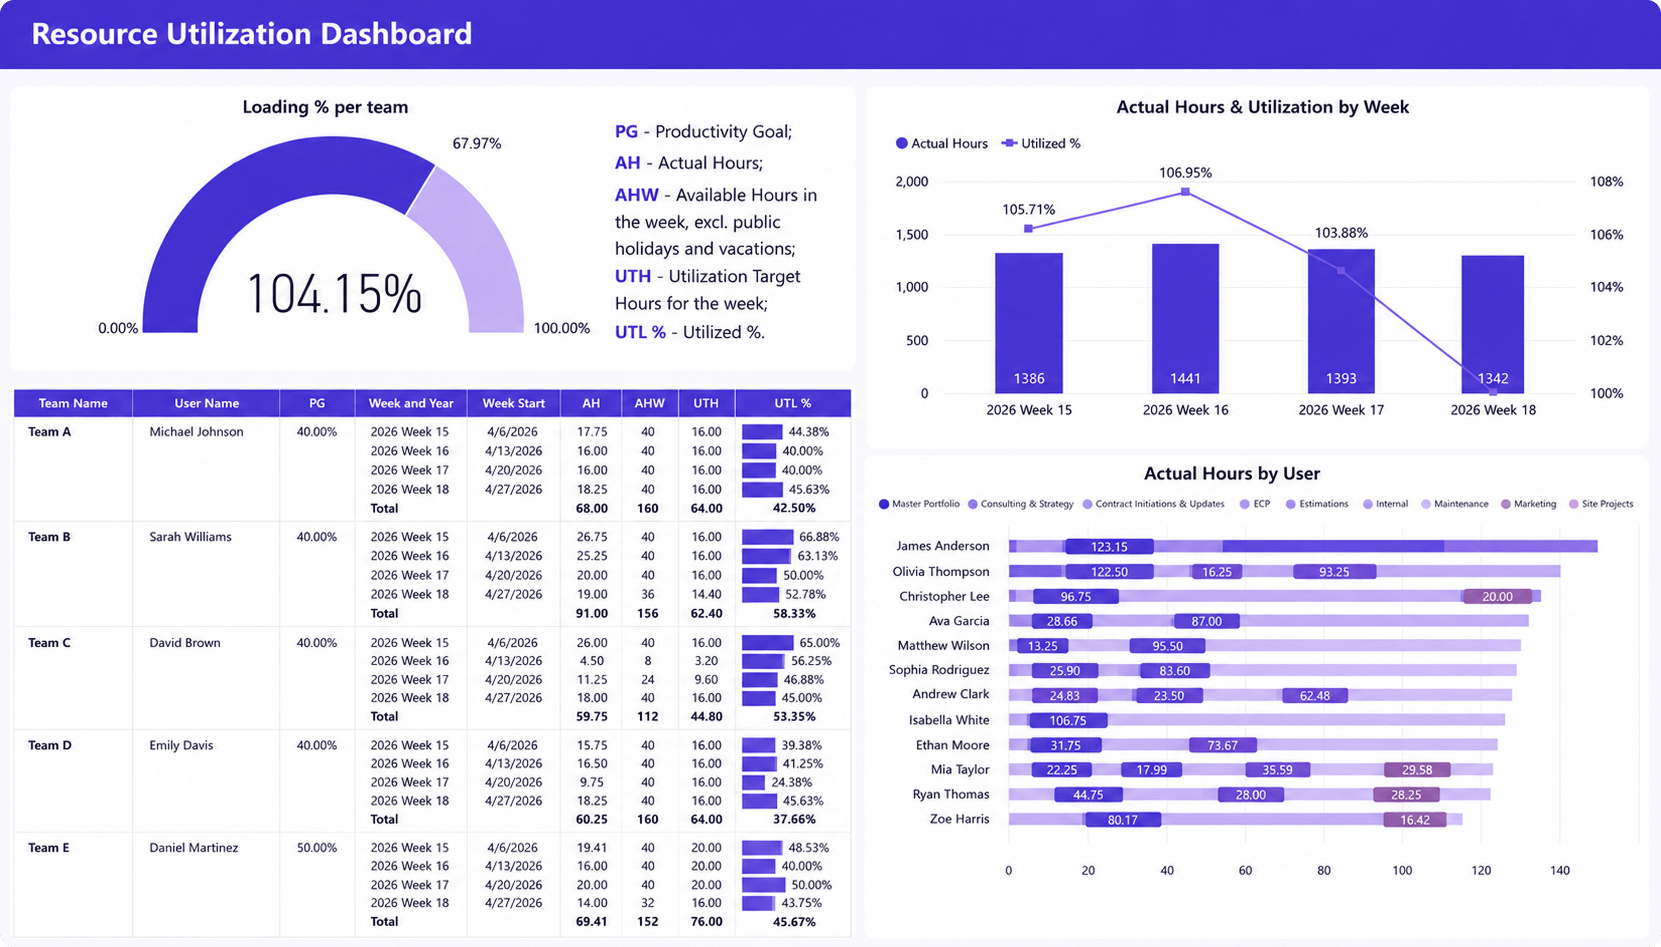
A resource utilization dashboard provides visibility into how effectively consulting teams are using available capacity. It helps leaders monitor utilization levels, workload distribution, and resource allocation trends across teams and individuals.
KPIs included
- Utilization percentage
- Team loading percentage
- Actual hours worked
- Available hours
- Utilization target hours
- Actual vs target utilization
- Weekly utilization trends
- Resource allocation by user
- Hours by project or portfolio
- Team utilization performance
Why consulting leaders use it
Resource utilization dashboards help consulting leaders balance workloads, reduce bench time, and identify capacity risks early. By monitoring utilization across teams and individuals, they can improve staffing decisions and maximize revenue-generating work.
Capacity planning dashboard
What it shows
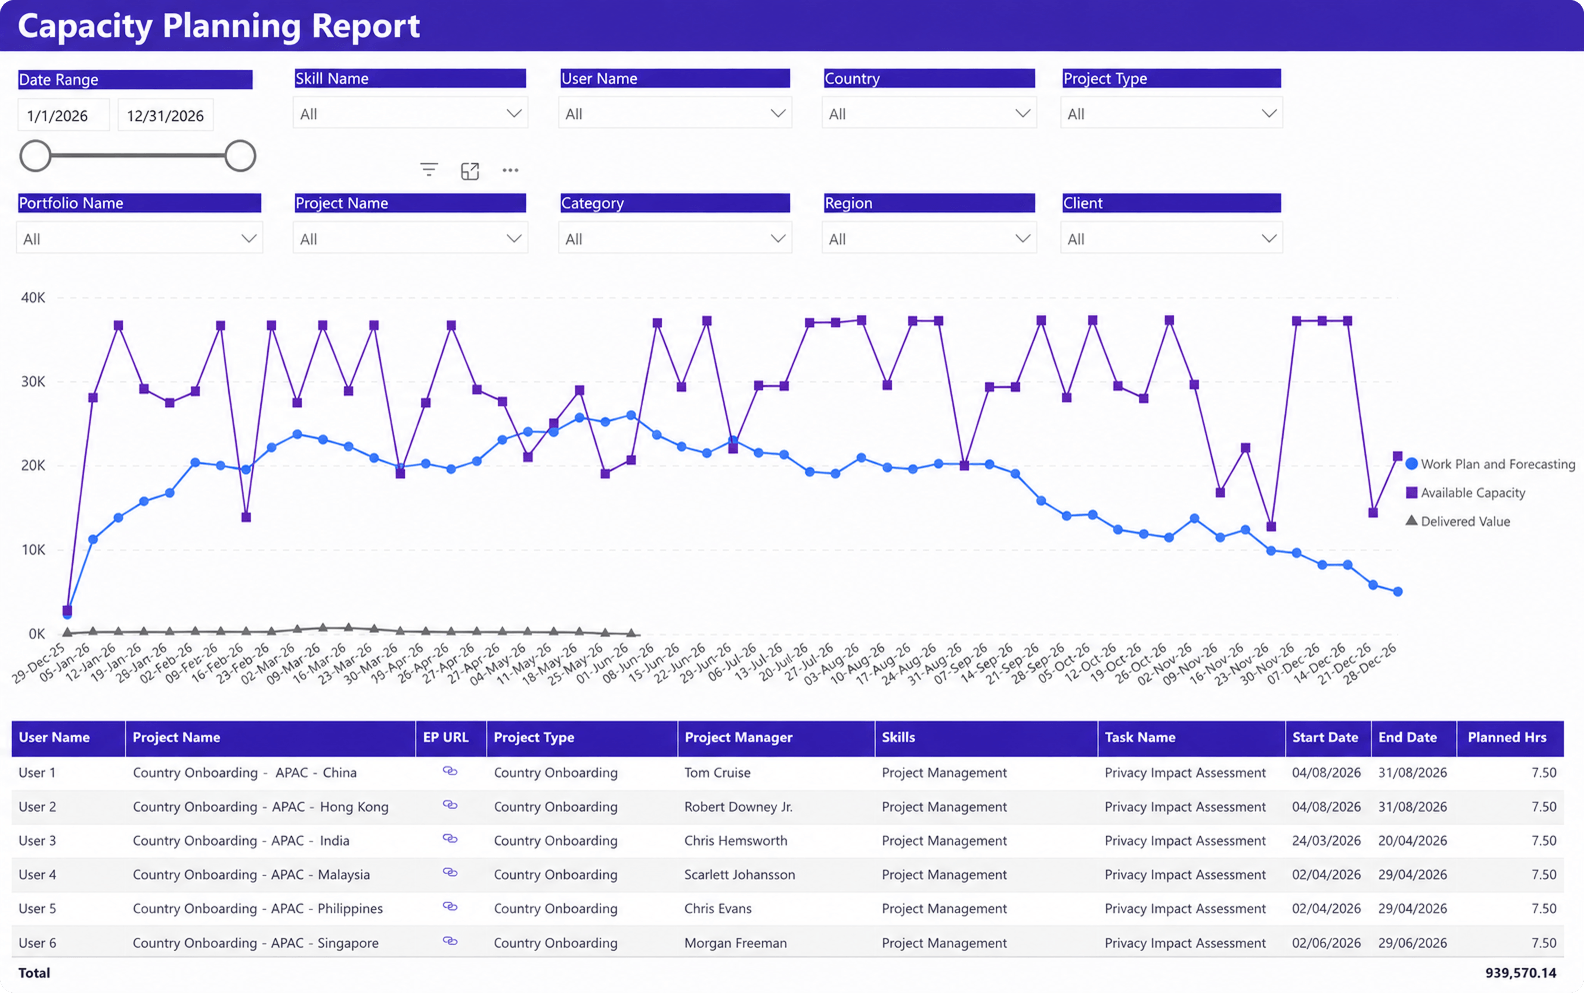
A capacity planning dashboard provides a forward-looking view of resource demand, available capacity, and planned work across the organization. It helps leaders compare forecasted workload against available resources and identify future staffing gaps before they affect project delivery.
KPIs included
- Available capacity
- Planned workload
- Forecast demand
- Delivered value
- Planned hours
- Resource availability trends
- Capacity by skill set
- Capacity by project type
- Capacity by region or team
- Future resource requirements
Why consulting leaders use it
Capacity planning dashboards help consulting leaders align staffing decisions with future demand. By identifying upcoming resource shortages or excess capacity early, they can improve forecasting accuracy, reduce bench time, and support sustainable growth.
Many consulting firms use PSA platforms and Power BI dashboards to visualize future capacity. Solutions such as Birdview PSA can combine resource plans, project demand, and availability data into a single reporting view.
Revenue, cost & profit dashboard
What it shows
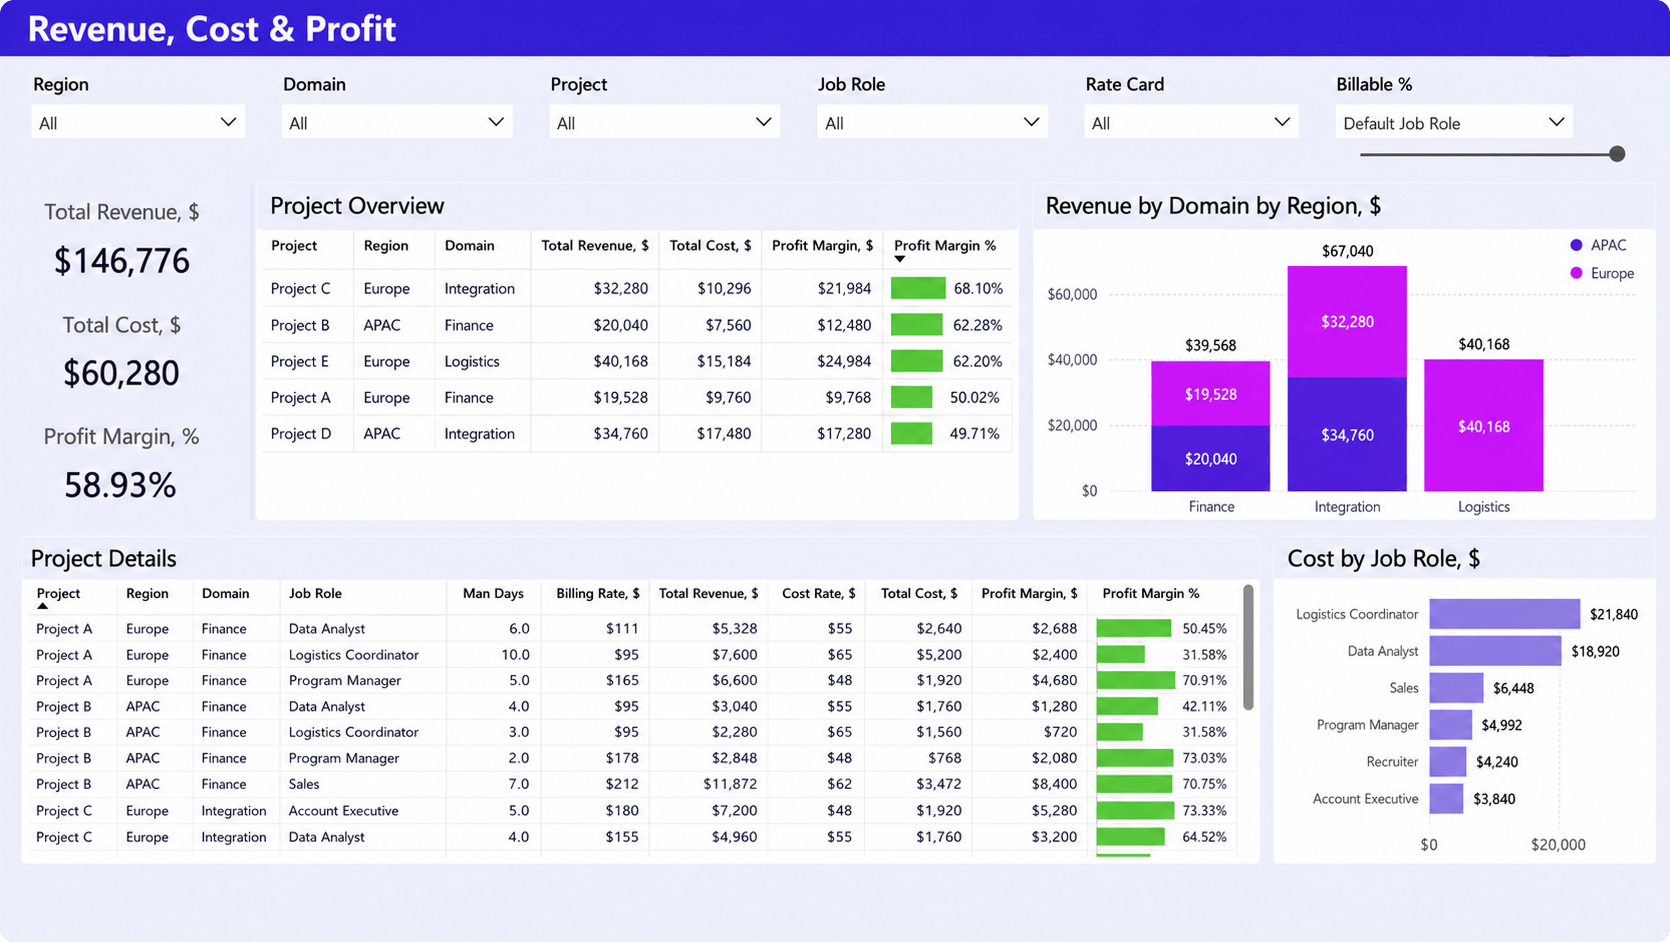
A revenue, cost, and profit dashboard provides a consolidated view of financial performance across projects, teams, and service areas. It helps leaders understand how revenue, costs, and margins vary across the business and identify the factors that influence profitability.
KPIs included
- Total revenue
- Total cost
- Profit margin percentage
- Revenue by project
- Revenue by region
- Revenue by service area
- Project profitability
- Cost by job role
- Billing rates
- Cost rates
- Profit margin by project
- Profit margin by service area
Why consulting leaders use it
Revenue, cost, and profit dashboards help consulting leaders understand which projects, services, and teams generate the strongest financial results. By tracking profitability drivers across the business, they can improve pricing decisions, control delivery costs, and increase overall margins.
Executive consulting dashboard
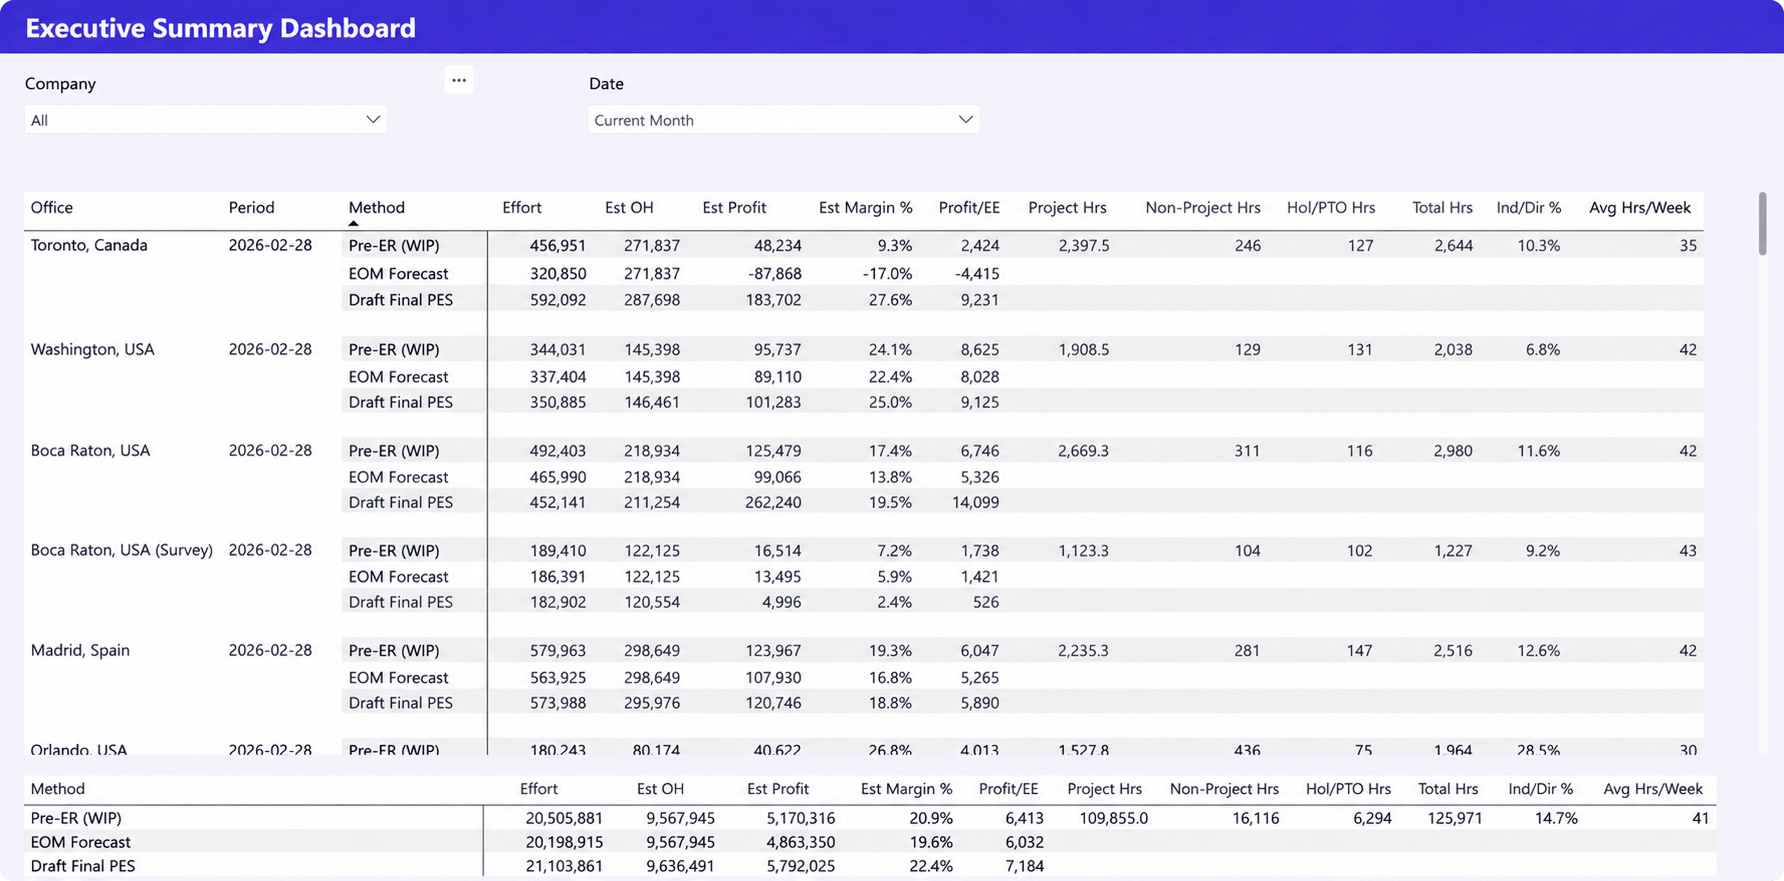
What it shows
An executive consulting dashboard provides a high-level view of operational and financial performance across offices, business units, or regions. It helps leaders compare profitability, effort, project hours, utilization, and forecasted results to evaluate overall business health.
KPIs included
- Estimated profit
- Estimated margin percentage
- Revenue forecasts
- Project hours
- Non-project hours
- Holiday/PTO hours
- Total hours worked
- Utilization percentage
- Profit per employee
- Overhead costs
- Effort by office or business unit
- Forecast vs actual performance
Why consulting leaders use it
Executive dashboards help consulting leaders monitor performance across the organization without reviewing multiple reports. By combining operational and financial metrics in one view, they can identify trends, compare business units, and make more informed strategic decisions.
Client portfolio dashboard
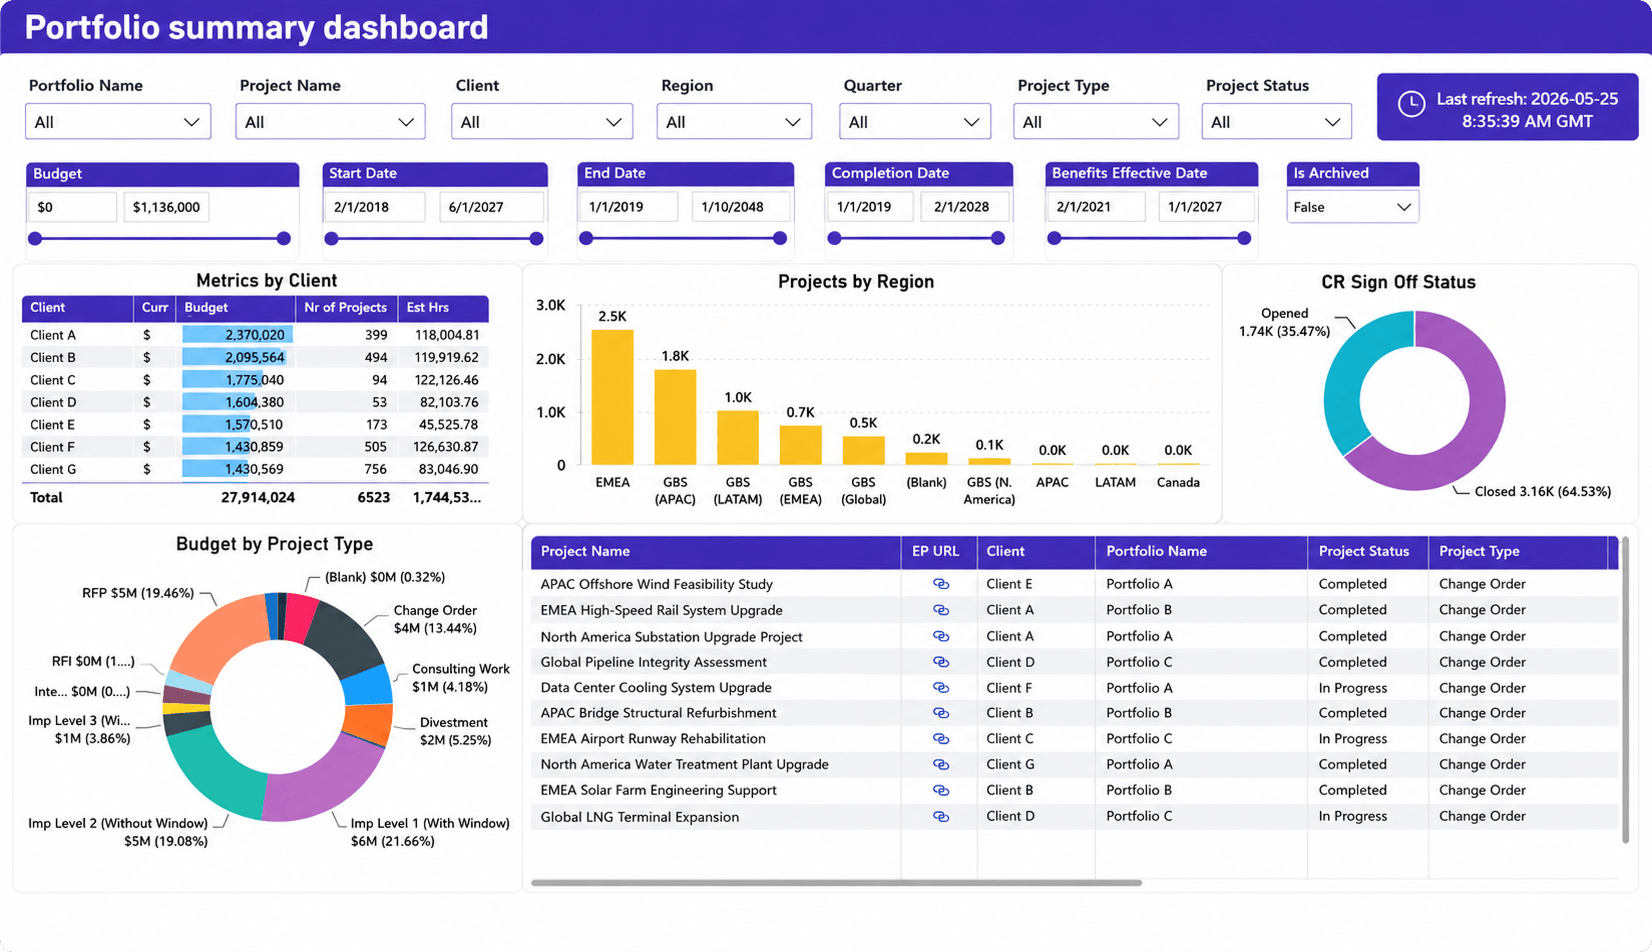
What it shows
A client portfolio dashboard provides a consolidated view of projects, budgets, and performance across clients, regions, and portfolios. It helps leaders evaluate portfolio composition, monitor project status, and understand where resources and investments are concentrated.
KPIs included
- Portfolio budget
- Budget by client
- Number of projects
- Estimated project hours
- Projects by region
- Budget by project type
- Project status
- Project completion trends
- Portfolio distribution by client
- Change request status
- Active vs completed projects
Why consulting leaders use it
Client portfolio dashboards help consulting leaders evaluate performance across their entire project portfolio rather than individual engagements. By monitoring budgets, project volumes, client investments, and portfolio health in one place, they can prioritize resources, identify strategic opportunities, and make more informed investment decisions.
Which KPIs matter most for CFOs?
CFOs need visibility into financial performance, profitability, forecasting accuracy, and business growth. While delivery metrics remain important, financial outcomes typically drive decision-making.
- Revenue forecast accuracy supports budgeting, hiring, investment planning, and cash flow management.
- Realization rate helps finance teams identify revenue leakage caused by write-offs, discounts, and unbilled work.
- Project margin provides early visibility into financial performance and profitability risks.
- Client profitability helps identify the most valuable client relationships and supports pricing decisions.
- Revenue per consultant provides a useful benchmark for operational efficiency and business performance.
Which KPIs matter most for operations leaders?
Operations leaders focus on delivery performance, resource management, capacity planning, and execution efficiency.
- Utilization helps leaders balance workloads and maximize revenue-generating work.
- Capacity availability helps teams prepare for future demand and avoid staffing shortages.
- Resource forecast accuracy improves hiring, staffing, and workforce planning decisions.
- Project health helps leaders identify schedule, budget, and resource risks before they affect delivery.
- Delivery performance measures how consistently projects are completed according to client expectations.
Common KPI mistakes consulting firms make
Tracking KPIs does not automatically improve performance. Many consulting firms invest heavily in reporting but still struggle to improve profitability, forecasting accuracy, or resource utilization because they focus on the wrong metrics or use inconsistent reporting practices.
Some of the most common mistakes consulting firms make when building KPI dashboards include:
- Tracking too many metrics
Dashboards overloaded with KPIs often create more confusion than clarity. The most effective consulting dashboards focus on a small group of metrics that directly influence business outcomes. - Focusing only on utilization
Utilization is important, but it does not tell the full story. High utilization can still result in poor financial performance if projects have low margins or significant write-offs. - Measuring delivery and finance separately
When project performance and financial reporting exist in different systems, leaders struggle to understand how delivery decisions affect profitability. - Relying on manual reporting
Manually compiling reports consumes valuable time and often results in outdated information. This limits a firm’s ability to identify and respond to issues quickly. - Using inconsistent KPI definitions
Different teams may calculate the same metric differently, leading to conflicting reports and reduced confidence in the data.
Consulting firms that achieve the greatest value from KPI reporting focus on a consistent set of business-critical metrics and ensure that operational and financial data are connected. This creates a more reliable foundation for decision-making and improves visibility into profitability, resource performance, and future growth opportunities.
Effective KPI dashboards start with connected operational data
The most effective consulting dashboards combine project delivery, resource management, time tracking, and financial data in a single reporting environment. Without connected data, even the best-designed dashboards provide limited value.
When operational and financial information is connected, leaders can see how staffing decisions affect profitability, how project performance impacts revenue forecasts, and where future capacity risks may emerge.
Many consulting firms use PSA platforms and business intelligence tools to consolidate this information and create more reliable reporting. For example, Birdview PSA can centralize project, resource, time, and financial data while supporting Power BI dashboards that provide a more complete view of business performance.
FAQ: consulting KPIs and dashboards
What KPIs should consulting firms track?
Most consulting firms should track utilization, realization, project profitability, project margin, client profitability, revenue forecast accuracy, capacity utilization, and delivery performance. The exact mix depends on business goals, service offerings, and reporting maturity.
What is the most important consulting KPI?
There is no single KPI that applies to every firm. However, utilization, realization, and project profitability are often considered the most influential because they directly affect revenue generation and profitability.
How do consulting firms measure profitability?
Consulting firms typically measure profitability by comparing project or client revenue against labor costs, expenses, and delivery costs. Common profitability metrics include gross margin, project margin, project profitability, and client profitability.
What is the difference between utilization and realization?
Utilization measures how much available time is spent on billable work. Realization measures how much of that billable work is ultimately invoiced and collected. A consultant can have high utilization but low realization if significant work is discounted or written off.
How often should KPI dashboards be reviewed?
Operational dashboards are often reviewed weekly, while executive and financial dashboards are typically reviewed monthly. Some firms also monitor key utilization, capacity, and project health indicators in real time to support day-to-day decision-making.
What should a consulting KPI dashboard include?
A consulting KPI dashboard should include financial, resource, and delivery metrics such as utilization, realization, project profitability, project margin, revenue forecasts, capacity utilization, and client profitability. The exact KPIs depend on the firm’s goals and reporting requirements.
Conclusion
The most effective consulting KPI dashboards do more than display information. They help leaders understand how delivery performance, resource utilization, profitability, and forecasting accuracy influence business outcomes.
By focusing on the right consulting KPIs and connecting operational and financial data, firms can improve visibility, make more informed decisions, and identify risks before they affect profitability.
As reporting maturity grows, dashboards become more than management tools. They become a foundation for better planning, stronger financial performance, and sustainable growth.
See how consulting firms use Birdview PSA and Power BI dashboards to improve utilization, profitability, and forecasting visibility.